JB Hi-Fi’s 27% Drop: What the Financials Actually Show
1 min ago

Commonwealth Bank of Australia (CBA) posted a return on equity of 13.1% in its most recent half-year results, a full 2.4 percentage points above the Big Four sector average. Its shares, meanwhile, have fallen 13.37% over six months while all three major rivals climbed. That gap between business quality and share price trajectory is the tension at the centre of any CBA stock analysis in May 2026. With 1H FY26 results now reported and KPMG’s sector-wide data providing a fresh peer baseline, this is a timely moment to assess whether CBA’s premium fundamentals still justify its premium price. What follows is a four-metric framework covering net interest margin, return on equity, capital adequacy, and dividend sustainability, measured against the Big Four aggregate, then stress-tested through a valuation lens.
No individual bank stock can be evaluated in isolation. The Big Four share macro exposures, regulatory oversight from the Australian Prudential Regulation Authority (APRA), and competitive dynamics in mortgage and business lending. When one outperforms or underperforms, the relevant question is always “relative to what?”
KPMG’s 1H26 banking analysis, released on 5 May 2026, provides the baseline. The sector-level figures establish the water CBA swims in:
Two patterns stand out. Lending volumes are growing, which means banks are competing aggressively for market share. Yet ROE is compressing, which means that competition is eroding the profitability of each dollar of equity deployed. CBA’s individual results need to be read against this backdrop: a sector where volume is available but margin is under pressure.
These two metrics appear in every bank earnings release. Understanding precisely what they capture is the difference between reading a headline and evaluating a business.
Net interest margin (NIM) is the spread between what a bank earns on its loans and what it pays on deposits and wholesale funding, expressed as a percentage of interest-earning assets. For CBA, this figure matters more than for most companies in other sectors because approximately 85% of CBA’s revenue comes from lending income. NIM is, in effect, the single largest lever on profitability.
Return on equity (ROE) measures the annual profit a bank generates per dollar of shareholder equity on its balance sheet.
CBA’s ROE of 13.1% means the bank generated $13.10 in profit for every $100 of equity on its books during the half-year period, annualised. By comparison, the sector average was $10.70 per $100.
A third metric, the Common Equity Tier 1 (CET1) ratio, warrants a brief introduction here. CET1 measures the proportion of a bank’s highest-quality capital relative to its risk-weighted assets. APRA sets minimum thresholds, and the ratio serves as a barometer of whether a bank can absorb losses without threatening depositors or requiring external support. CBA’s CET1 is examined in the scorecard section that follows.
For readers who want to go deeper on what each ratio actually measures before assessing the scorecard, our dedicated guide to valuing ASX bank shares using NIM, ROE and CET1 walks through each metric with worked examples drawn from the Big Four’s H1 2026 results, including how APRA’s capital adequacy framework shapes the CET1 floor that all four banks must maintain.
The comparison table below places CBA’s 1H FY26 figures directly alongside the sector aggregates from KPMG’s report.
| Metric | CBA | Sector Average | CBA Advantage / Trend |
|---|---|---|---|
| NIM | 1.99% | 1.78% | +21 bps premium; contracting |
| ROE | 13.1% | 10.7% | +2.4 ppts premium; sector-leading |
| CET1 | 12.3% | Not aggregated (KPMG) | Comfortably above APRA minimums |
| 1H Cash Profit | $5.45 billion | n/a (individual) | Beat analyst forecasts |
On every ratio, CBA leads. The NIM premium of 21 basis points and the ROE premium of roughly 2.4 percentage points are not marginal; they reflect structural advantages in deposit franchise, cost efficiency, and pricing power.
The complication is the direction of travel. CBA’s NIM contracted during 1H26, driven by competitive mortgage pricing and a shift toward lower-yielding assets. In absolute terms, 1.99% remains sector-leading. In trend terms, the margin is narrowing, and that trajectory is what the market has been re-pricing.
CBA’s scale provides a partial buffer. The bank holds:
The APRA Prudential Standard APS 110 sets the binding capital adequacy requirements for Australian authorised deposit-taking institutions, including a mandatory CET1 conservation buffer and an additional 1.0% surcharge for domestic systemically important banks, the category into which CBA falls as the country’s largest lender.
That volume base means even a thinner margin generates substantial aggregate profit. Whether it generates enough profit to justify the current share price is a separate question.
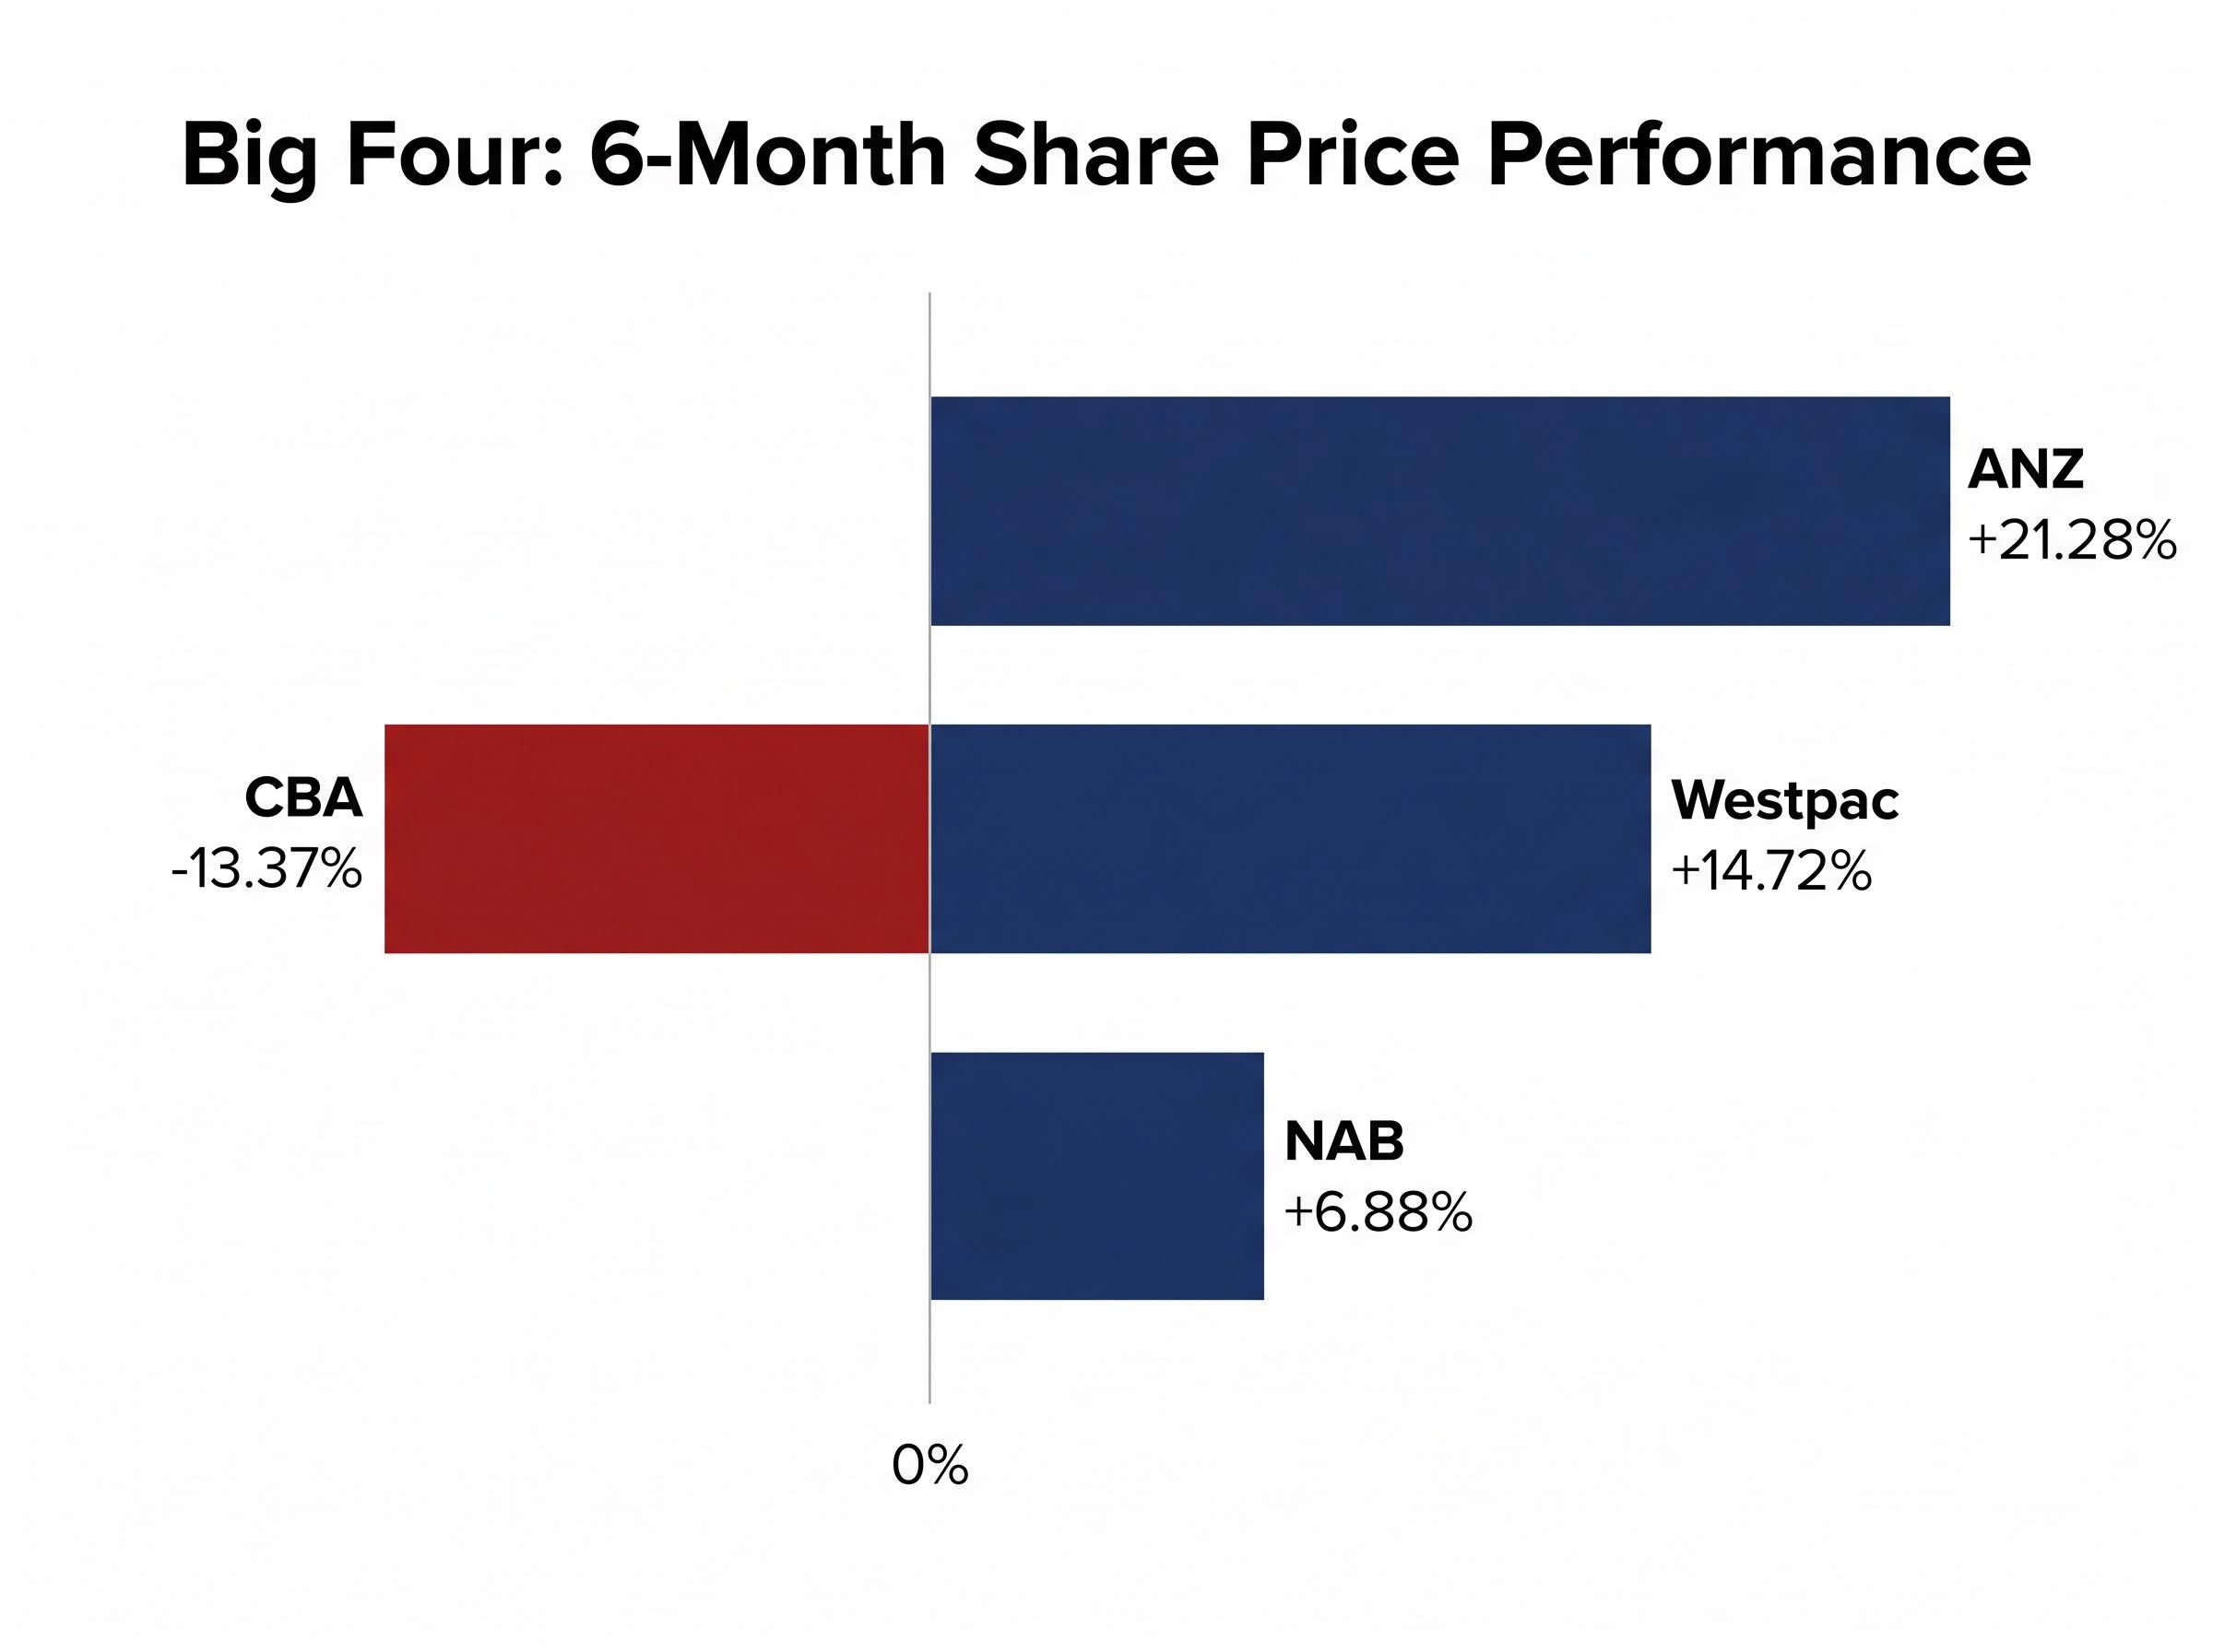
Over the past six months, CBA shares fell 13.37%. Over the same period, ANZ rose 21.28%, Westpac gained 14.72%, and NAB added 6.88%. The re-rating of CBA’s peers, while CBA itself declined, signals that the market is distinguishing between improving value elsewhere and stretched valuation at CBA.
The Big Four share price divergence in 2026 reflects more than sector rotation: all 14 analysts covering CBA held sell ratings as of late April, with an average price target of $130.34, a consensus that was already priced into the market before the 1H FY26 results confirmed margin contraction.
CBA declared a 1H FY26 interim dividend of $2.35 per share, fully franked, bringing the full-year payout to $4.65 per share. The bank targets a payout ratio of 70-80% of cash earnings, a range it has maintained comfortably on the back of a $5.45 billion half-year profit.
For Australian retail and SMSF investors, the franking credit is where the real arithmetic lives. The table below shows the yield comparison at a share price of $156.42.
| Yield Measure | Rate |
|---|---|
| CBA Cash Dividend Yield | Below 3% |
| Grossed-Up Yield (incl. franking) | Approximately 4% |
| Term Deposit Benchmark | Approximately 4.25% |
On a cash basis, the yield is thinner than what a term deposit currently offers. The grossed-up yield closes much of that gap, but does not eliminate it entirely.
For SMSF investors in accumulation phase or retirees in pension phase (where the fund’s tax rate can be 0% or 15%), the franking credit refund can make CBA’s effective yield genuinely competitive with, or superior to, term deposits. The advantage is most material for investors in lower marginal tax brackets.
The dividend itself appears sustainable at current profit levels. The risk to watch is longer-term: if NIM continues to compress, the profit base underpinning the payout ratio narrows.
CBA’s quality is not in dispute. The question is price.
Three reference points frame the valuation gap:
At 3.8x price-to-book, CBA trades at a level that Morningstar has characterised as an “expensive outlier” among Australian banks. The premium metrics are real, but the multiple leaves limited margin of safety if earnings growth disappoints.
The market has already signalled discomfort with the valuation. Despite the 1H FY26 profit beat, CBA shares fell approximately 10.52% in one week following the Q1 FY26 NIM disclosure. Year-to-date performance sits at -3.79%. The market is penalising margin trajectory rather than rewarding absolute profit levels.
The market reaction to bank earnings has become a reliable indicator of how investors weight NIM trajectory against headline profit: NAB’s share price fell nearly 3% on May 5 despite underlying profit growth of 6.4%, a pattern that mirrors the response to CBA’s own Q1 NIM disclosure and suggests the sector is repricing the durability of margin expansion, not just its level.
A dividend discount model (DDM) offers one framework for estimating CBA’s intrinsic value. Using the most recent full-year dividend of $4.65, growth rate assumptions of 2-4%, and discount rates ranging from 6-11%, analysis published by Rask produces a wide scenario range: $52.89 at the bearish end to $238.00 at the optimistic end, with a central estimate of approximately $98.33.
That spread is not a failure of the model. It illustrates how sensitive intrinsic value is to the long-run growth and discount rate assumptions an investor selects. Adjusting the central estimate for franking credits lifts it to approximately $143.80, still below the current share price of $156.42.
Macro assumptions in bank valuations drive a far wider output range than most investors expect: the same NAB model produces fair value estimates from $19.00 to $85.50 per share depending on the growth and discount rate inputs selected, a sensitivity range that puts the CBA DDM spread of $52.89 to $238.00 in appropriate context.
On a mid-case basis, the franking-adjusted DDM estimate implies CBA is trading at a modest premium to fair value. Investors with more optimistic growth assumptions may reach a different conclusion; those with more conservative discount rates will see a wider gap.
CBA demonstrably leads the Big Four on the metrics that matter most to bank investors: a 21 basis point NIM premium, an ROE running 2.4 percentage points above the sector, and a CET1 ratio of 12.3% that sits comfortably above regulatory minimums. A franchise spanning 15 million customers and more than 20% of the mortgage market provides structural durability.
The picture is more complicated on two fronts. The forward P/E of 26-27x, roughly double CBA’s own historical average, embeds optimistic assumptions about earnings growth. And the NIM contraction trend, which triggered the sharpest single-week sell-off in recent quarters, signals that margin headwinds are not yet resolved.
For investors evaluating CBA at current levels, the framework reduces to four metrics worth monitoring in future results:
CBA remains a benchmark-quality institution. Whether it represents benchmark value at $156.42 depends on each investor’s assumptions about where those four metrics land over the next two to three years.
This article is for informational purposes only and should not be considered financial advice. Investors should conduct their own research and consult with financial professionals before making investment decisions. Past performance does not guarantee future results. Financial projections are subject to market conditions and various risk factors.
—
Return on equity (ROE) measures how much profit a bank generates for every dollar of shareholder equity; CBA's ROE of 13.1% means it earned $13.10 per $100 of equity, which is 2.4 percentage points above the Big Four sector average of 10.7%.
CBA's net interest margin for 1H FY26 was 1.99%, representing a 21 basis point premium over the Big Four sector average of 1.78%, though the margin has been contracting due to competitive mortgage pricing.
At a share price of $156.42, CBA's cash dividend yield sits below 3%, but the grossed-up yield including franking credits rises to approximately 4%, still slightly below the term deposit benchmark of around 4.25%, though the advantage varies significantly by the investor's marginal tax rate.
Over the six months to May 2026, CBA shares fell 13.37% while ANZ rose 21.28%, Westpac gained 14.72%, and NAB added 6.88%, with the market repricing CBA's stretched valuation (forward P/E of 26-27x) and penalising its net interest margin contraction trajectory rather than rewarding its headline profit levels.
The Common Equity Tier 1 (CET1) ratio measures a bank's highest-quality capital as a proportion of risk-weighted assets; CBA's CET1 of 12.3% sits comfortably above APRA's mandatory minimums, indicating the bank has a strong capital buffer to absorb potential losses.