Just 19 semiconductor stocks, representing roughly 15% of the S&P 500 by weight, account for approximately 70% of the index’s entire $5.1 trillion in market capitalisation gains so far in 2026. For investors who believe a broad index fund delivers a diversified slice of the American economy, that single statistic reframes the assumption.
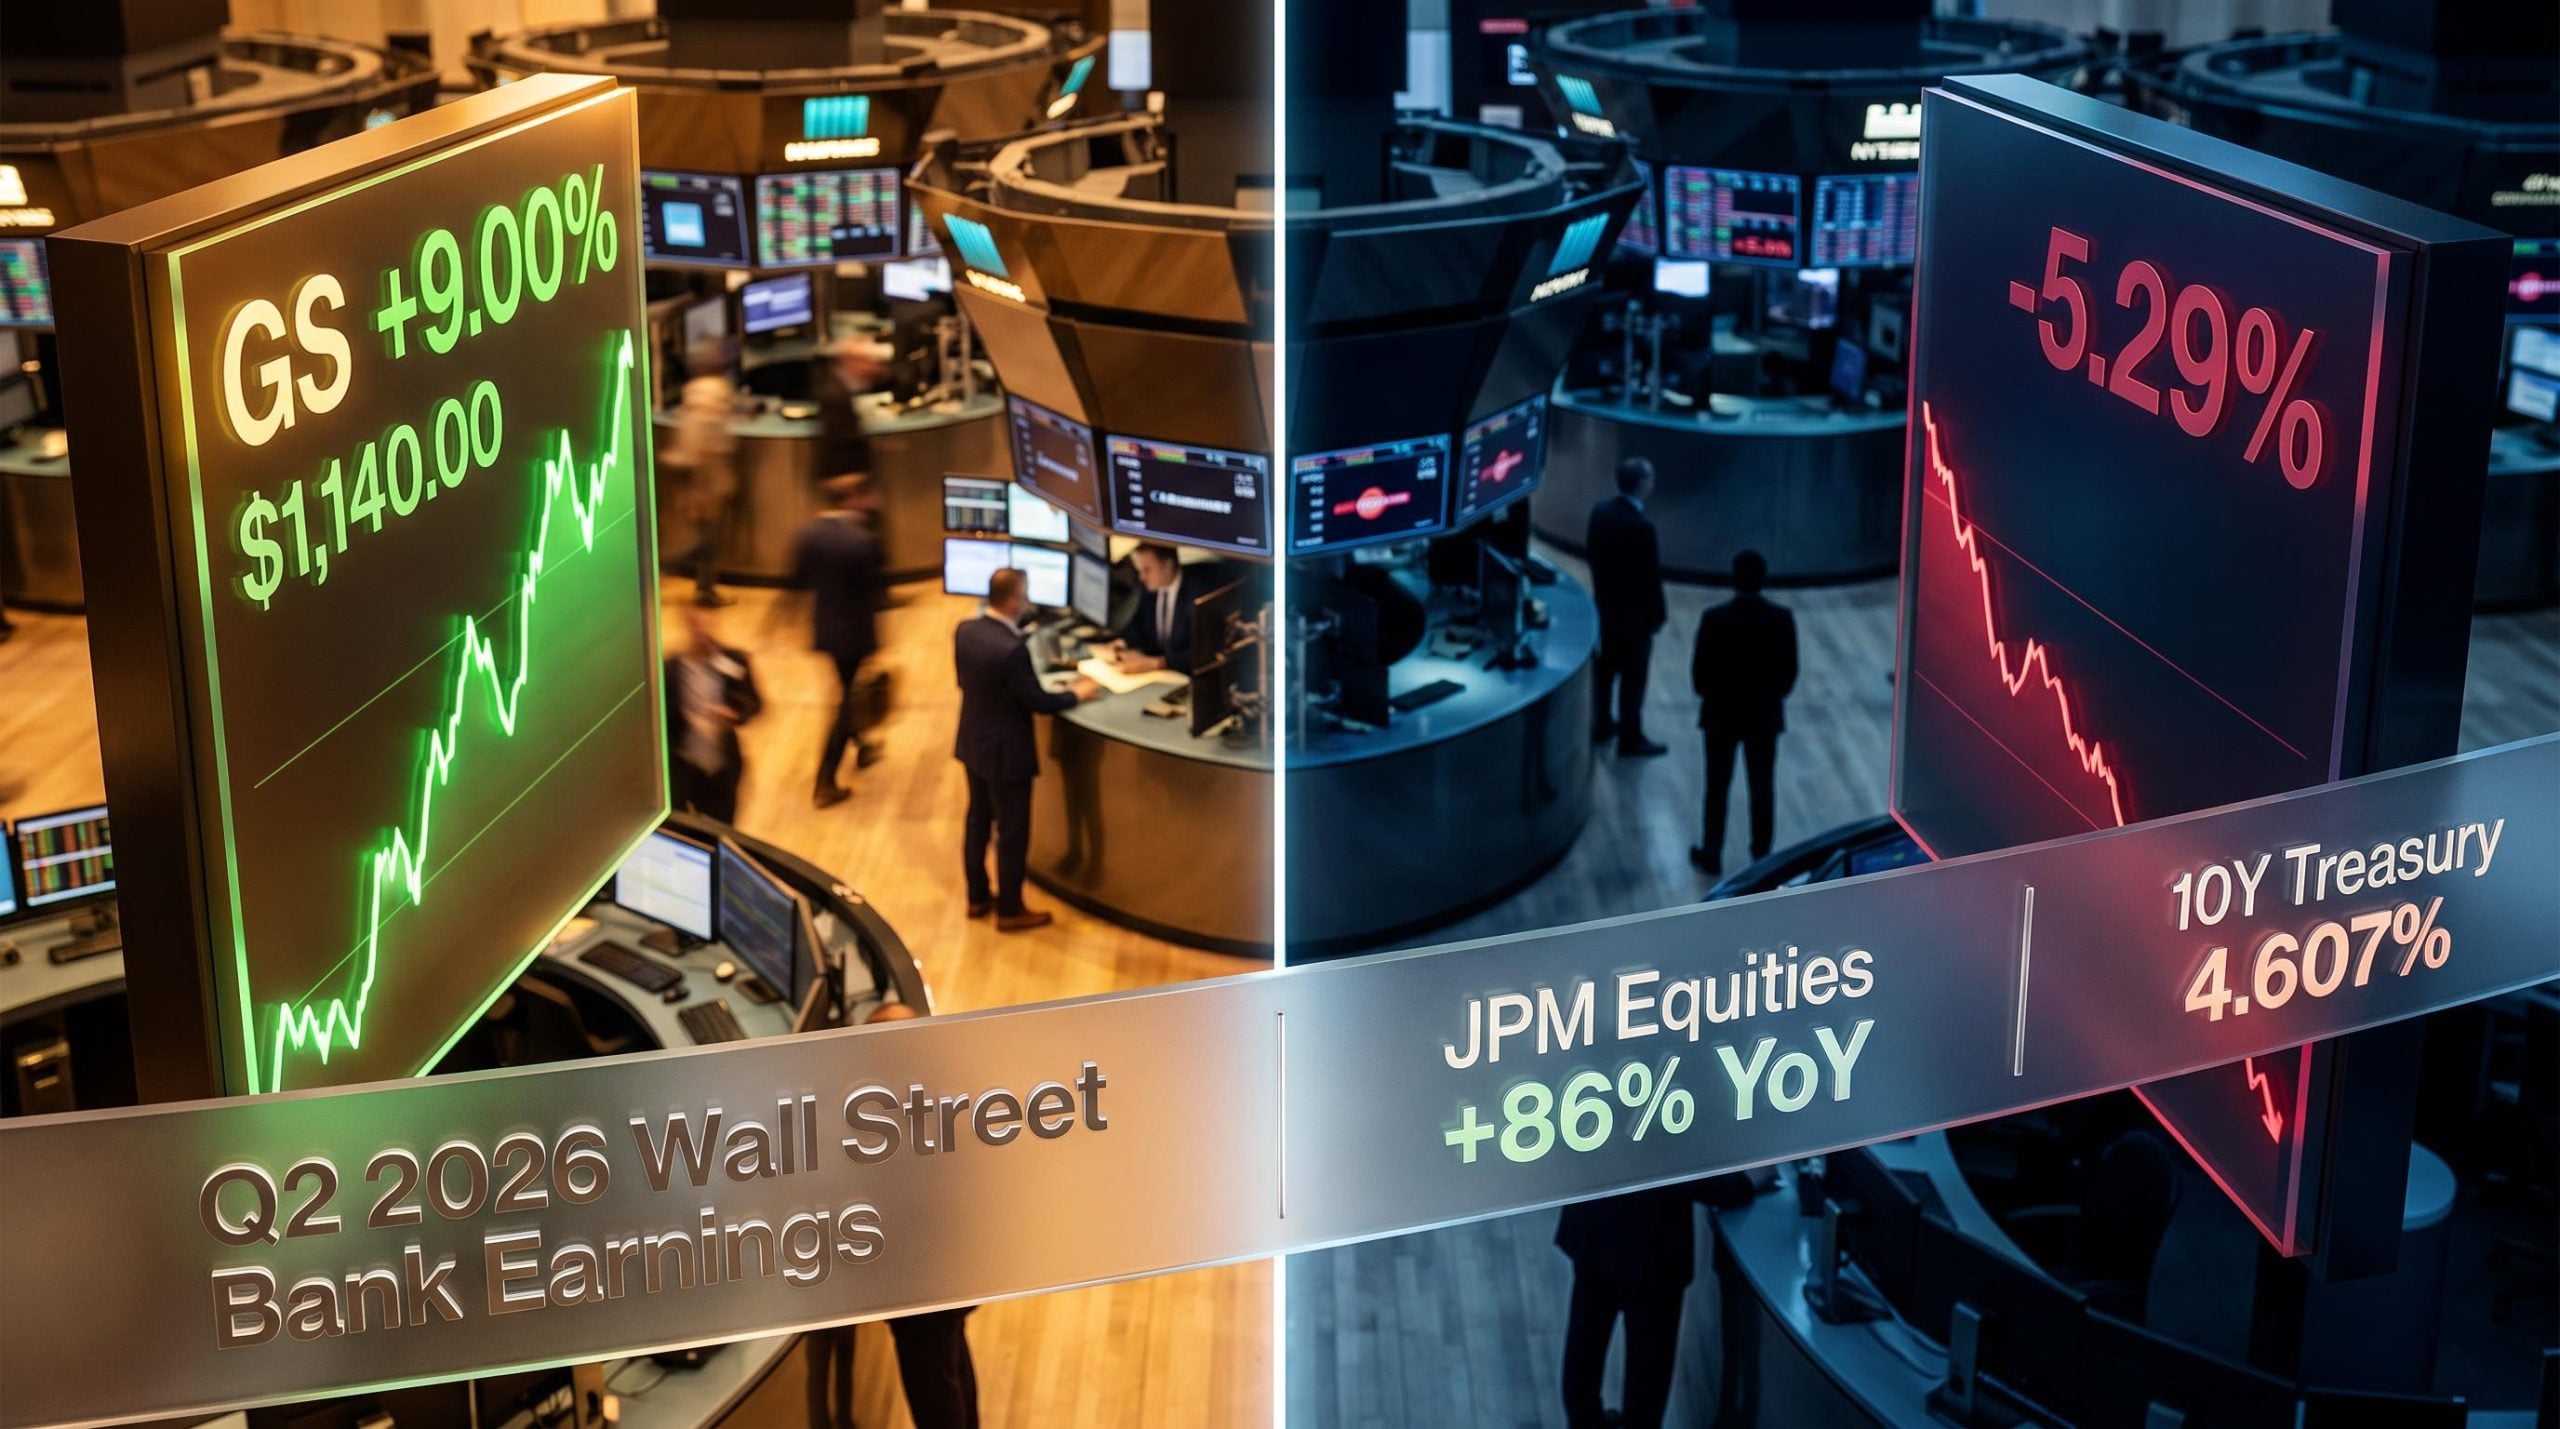
The S&P 500 has printed 13 all-time highs across the past 20 trading sessions, most recently closing at a record on 1 May 2026 at 7,230.12. On 14 May, the index pushed higher again. The Dow Jones Industrial Average declined. The equal-weighted S&P 500 underperformed its cap-weighted counterpart by 102 basis points in a single session. More constituents hit 52-week lows than 52-week highs on the same day the headline number flattered a market that is narrower than it appears.
What follows is an analysis of what the semiconductor-driven concentration data actually signals, why the divergence between cap-weighted and equal-weighted index performance is a metric worth monitoring closely, and what a scenario-based assessment of a semiconductor stall would mean for investors holding broad S&P 500 exposure.
How concentrated has the S&P 500 actually become?
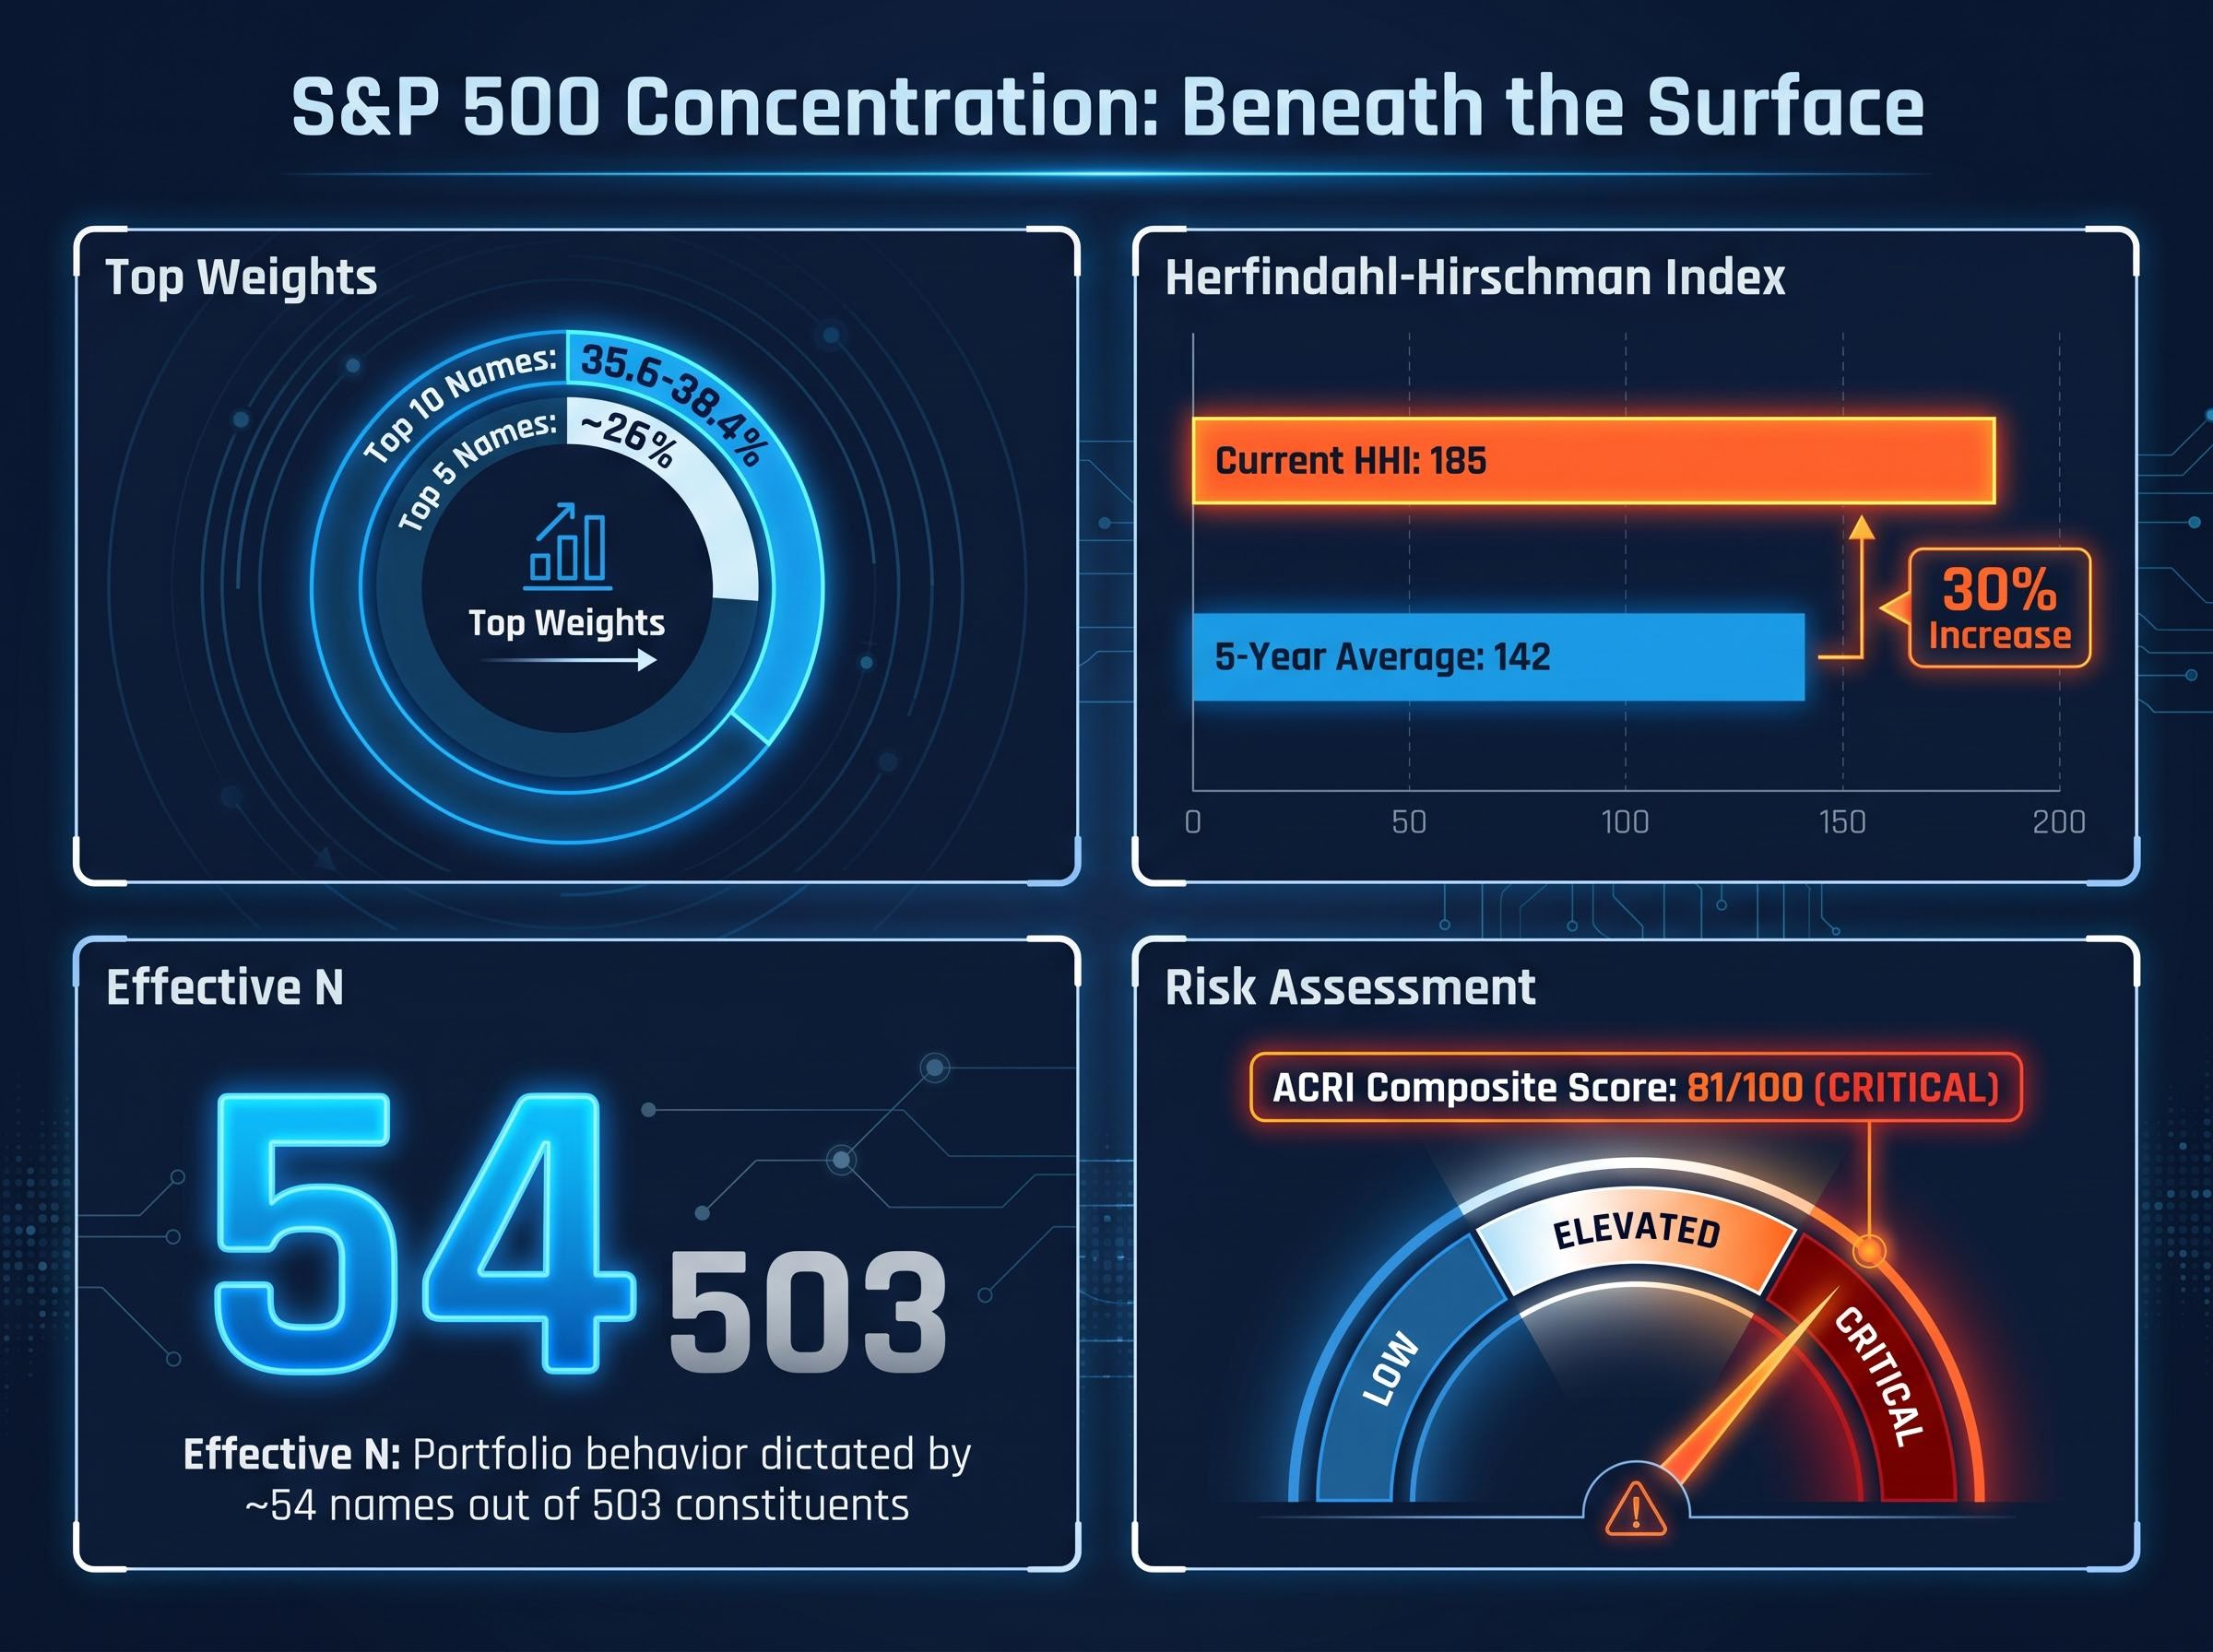
The familiar headline figure, the top 10 names in the S&P 500, only scratches the surface. A deeper look at the index’s structural composition reveals concentration that is historically anomalous by several institutional-grade measures:
- Top 10 weight: The 10 largest names account for approximately 35.6-38.4% of SPY; the top 5 alone represent roughly 26%
- HHI (Herfindahl-Hirschman Index): Currently at 185, versus a 5-year average of 142, a 30% increase in index concentration
- Effective N: Approximately 54, meaning the index’s return behaviour is driven by fewer than 54 stocks rather than all 503 constituents
- ACRI composite score: 81/100, rated “CRITICAL”
AhaSignals Concentration Risk Assessment The ACRI composite score of 81/100 flags the S&P 500 as “top-heavy and vulnerable to mega-cap earnings or policy shocks.” AhaSignals notes that “AI capex can amplify S&P 500 concentration risk when large index weights depend on the same AI infrastructure narrative.”
That effective-N figure is the one that should sharpen attention. An investor holding a cap-weighted S&P 500 fund owns 503 names on paper. In practice, the portfolio’s behaviour is dictated by roughly 54.
Passive index concentration has reached a structural inflection point: the cap-weighted S&P 500 returned 86% over three years versus 43% for the equal-weighted version, yet the entire performance gap was driven by valuation expansion rather than superior earnings growth, a distinction that carries significant implications for investors assuming broad market exposure.
The semiconductor layer within the concentration story
The concentration is not evenly distributed across the technology sector. Within the S&P 500’s approximately 33.6% information technology allocation, a tighter cluster of 19 semiconductor stocks accounts for roughly 15% of total index weight.
These names have driven an outsized share of 2026 returns. According to Reuters analysis cited on 14 May 2026, semiconductors contributed approximately 70% of the index’s $5.1 trillion in year-to-date market capitalisation gains. A separate measurement from the 2026 lows shows the chip complex accounting for approximately 37.6% of the $8.64 trillion total gain from trough to current levels. The two figures capture distinct timeframes but point in the same direction: the S&P 500’s performance in 2026 is, to a remarkable degree, a semiconductor story.
When big ASX news breaks, our subscribers know first
Why the gap between cap-weighted and equal-weighted performance matters
On 14 May 2026, the S&P 500 set another all-time high. The Dow fell. The equal-weighted S&P 500 trailed its cap-weighted counterpart by 102 basis points in a single session. And on a day the headline index made history, 46 constituents hit 52-week lows versus just 34 reaching 52-week highs.
46 stocks hitting 52-week lows on the same day the S&P 500 touched an all-time high. That single data point captures the paradox of a market where the index and the median stock are telling different stories.
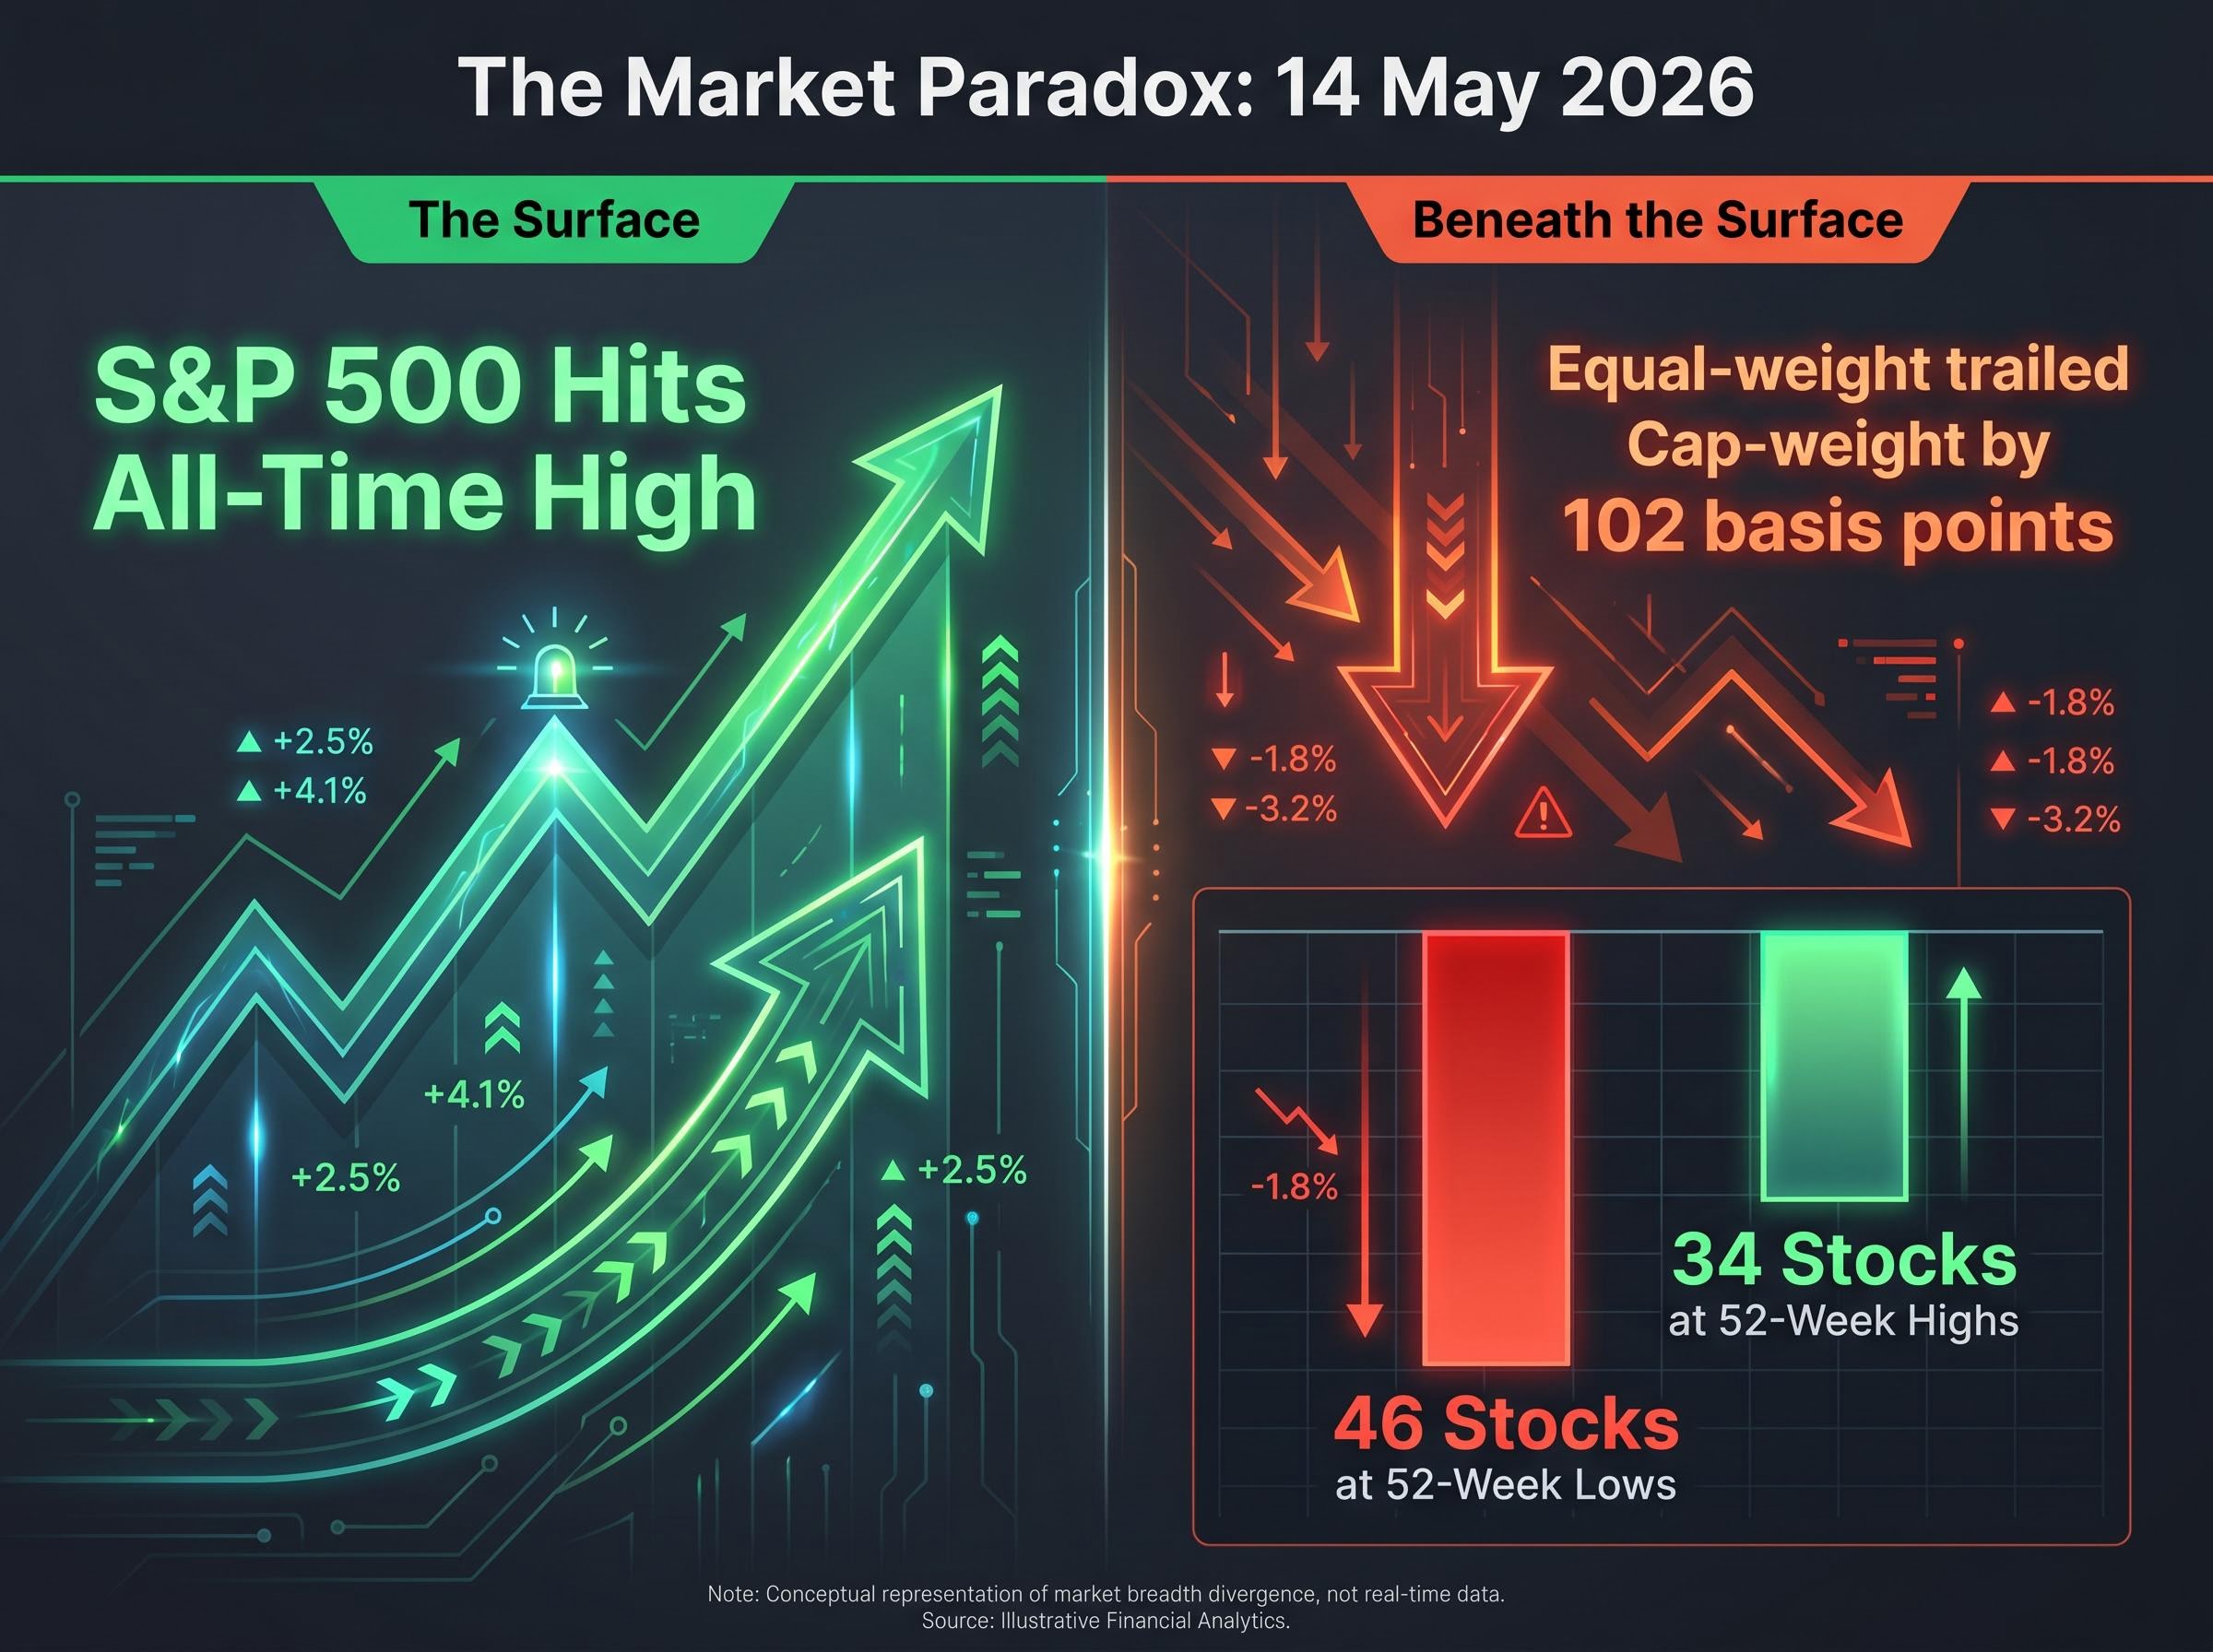
The mechanism is straightforward. Cap-weighted indices amplify the returns of their largest constituents. When a small group of mega-cap names rallies while the median stock is flat or negative, the headline index rises even as market breadth deteriorates. The result is an index that looks healthy at the top line but is increasingly fragile underneath.
Breadth deterioration of this magnitude carries measurable historical precedent: sub-25% breadth readings have preceded 5-15% drawdowns roughly 80% of the time within 60 days, based on approximately 12 comparable episodes since 1994, a base rate that gives the current divergence between cap-weighted performance and equal-weighted participation concrete probabilistic weight.
| Metric | Cap-Weighted (SPY) | Equal-Weighted (RSP) | Historical Context |
|---|---|---|---|
| YTD return (as of 13 May 2026) | +8.71% | +6.94% | ~177 bps spread |
| 14 May single-session divergence | Positive (new ATH) | -102 bps relative | Approaching 2023 extremes |
| Sector leaders (14 May) | Comms +2.65%, IT +0.98% | Utilities -1.26%, Financials -1.07% | Two sectors drove gains; most declined |
The 177 basis point year-to-date spread between SPY and RSP is approaching the extremes recorded in 2023, when the cap-weight vs. equal-weight gap was one of the largest on record. Historical research across multiple strategy desks suggests that when this divergence becomes persistent, forward three-to-five year returns for the leadership group tend to compress, and the probability of a leadership rotation rises.
What narrow market leadership actually means: a brief history of S&P 500 concentration risk
The 2026 data sits within a pattern that has repeated, with variations, across three distinct market episodes. Each resolved differently, but all shared the same early warning: breadth deteriorated before the index.
- Dot-com era (1998-2000): A cluster of mega-cap technology and telecom names dominated index returns. Cap-weighted outperformance over equal-weight reached extreme levels. Breadth, measured by advance/decline lines and new highs, rolled over months before the March 2000 index peak. The unwind was severe; leadership collapsed and equal-weight and value recovered earlier.
- Magnificent Seven phase (2020-2023): Seven mega-cap tech names delivered the majority of S&P 500 returns. The 2023 cap-weight vs. equal-weight gap was one of the largest on record. Resolution came through rotation within the growth cohort rather than a broad crash, with semiconductors and AI infrastructure stepping into the leadership role.
- Current semiconductor concentration (2026): Nineteen chip names now drive approximately 70% of year-to-date gains. The cap-weight vs. equal-weight spread is approaching or matching 2023 extremes. Breadth metrics on individual sessions are already flashing warning signals.
What separates 2026 from the dot-com era
Today’s semiconductor leaders carry a genuine structural advantage over the 1999-2000 cohort: stronger free cash flow generation, dominant competitive positions, and balance sheets that can absorb a downturn without existential risk. Nvidia, TSMC, Broadcom, and ASML are profitable businesses with multi-year revenue visibility, not speculative names running on narrative alone.
That differentiator reduces the probability of a dot-com-style collapse. It does not eliminate the risk of multiple compression if growth expectations disappoint. A stock trading at a cycle-peak multiple on mid-cycle margins does not need an earnings crisis to de-rate; a deceleration in the growth trajectory is sufficient.
The bull case: why the semiconductor rally may have further to run
Institutional investors remain heavily positioned in semiconductors for reasons that are analytically defensible, not merely momentum-driven. The constructive case rests on several reinforcing pillars:
- Picks-and-shovels positioning: Semiconductor and equipment makers sit at the infrastructure layer of the AI build-out, less exposed to which software model wins and more leveraged to aggregate compute demand growth
- Multi-year capex visibility: Micron, AMD, Broadcom, TSMC, and ASML benefit from hyperscaler capital expenditure commitments extending through 2026-2028, providing revenue visibility that few other sectors can match
- Balance sheet quality: High free cash flow and low leverage differentiate the current leadership cohort from prior concentration episodes
- Earnings momentum: The AI infrastructure spending cycle is generating double-digit earnings-per-share growth expectations across the chip complex
Cisco’s Q3 FY26 results, reported on 13 May 2026, provided a concrete near-term data point: revenue of $15.8 billion (up 12% year-on-year), an earnings-per-share beat of approximately 6%, and an upward revision of its AI infrastructure order outlook to $4 billion from $3 billion. Shares rose 17% after hours.
The session on 14 May reflected this momentum. The semiconductor ETF advanced 2.38%, with On Semiconductor gaining approximately 10%, Marvell up 7%, Micron up 3%, and Nvidia adding 2.2%. The BofA Global Fund Manager Survey for April 2026 ranked “long global semiconductors” as tied for the most crowded institutional trade, yet managers remained reluctant to reduce exposure because the trade continues to deliver.
Estimating the AI bull market runway requires weighing verifiable demand data against valuation multiples that leave little room for error: hyperscalers spent $130 billion on AI infrastructure in Q1 2026 alone, yet leading semiconductor names trade at 60-85x forward earnings, a multiple range historically associated with late-stage rather than early-stage pricing.
Where the rally could stall: four risk scenarios
The concentration data becomes most actionable when paired with specific scenarios that could disrupt the semiconductor leadership. Each of the following represents a distinct risk type with a concrete trigger investors can monitor.
| Scenario | Trigger / Data Point | Semiconductor Impact |
|---|---|---|
| AI capex digestion | Hyperscaler capex guidance cuts or ROI-driven spending pauses | Revenue deceleration hits GPU, memory, and equipment names simultaneously |
| Export control escalation | New US restrictions on AI chip sales to China; Nvidia CEO Jensen Huang attended the Trump-Xi summit delegation (13-15 May 2026) | Addressable market compression for Nvidia, AMD, ASML, Lam Research, KLA |
| Multiple compression | Guidance miss or growth deceleration from any top-5 semiconductor name | Crowded positioning accelerates de-risking; expectations leave zero margin for error |
| Macro tightening | April PPI at +6.0% YoY; 20- and 30-year Treasuries above 5% | Higher discount rates compress valuations on long-duration growth assets first |
The demand and policy scenarios carry sector-specific risk. The valuation and macro scenarios carry market-wide implications that would hit semiconductors disproportionately because of their elevated multiples and concentrated positioning.
The macro backdrop tightens the margin for error
The April 2026 Producer Price Index came in at +6.0% year-on-year, the highest reading since December 2022, with a monthly increase of +1.4% and an energy component surge of +7.8%. Treasury yields reflect the pressure: 20-year and 30-year bonds both trade above 5%, the 10-year sits at 4.481%, and market-implied probability of a Fed rate hike at the December 2026 meeting has risen to approximately 39%. Zero rate cuts are priced for 2026.
With long-end yields at these levels, the equity risk premium for long-duration growth assets is historically thin. AI semiconductor stocks are priced as if the market is early in a secular boom, but the discount rate backdrop is late-cycle restrictive. That combination leaves minimal room to absorb any earnings or guidance disappointment before the valuation arithmetic turns unfavourable.
The VIX at 17.87 suggests the options market is not pricing the tail risks outlined above, a potential signal that hedging costs remain underweight relative to the concentration of index-level risk in a single sector.
The next major ASX story will hit our subscribers first
What investors in broad index funds should actually do with this information
An effective-N of approximately 54 means that a cap-weighted S&P 500 fund delivers less diversification than the 503-name label implies. The top 10 holdings, at 35.6-38.4% of the index, carry more weight than the bottom 400 combined. For investors whose entire equity allocation runs through SPY, IVV, or similar vehicles, the semiconductor exposure is larger than many would assume from the fund name alone.
Three portfolio questions are worth answering with specificity:
- What is the actual semiconductor weighting across all equity holdings, including overlap between index funds, sector ETFs, and individual positions?
- How would a 20-30% drawdown in the top 10 names affect total portfolio value, given their combined weight?
- Is the equal-weighted S&P 500 (RSP, which returned +6.94% year-to-date versus SPY’s +8.71%) a suitable complement for reducing single-sector concentration?
Beyond portfolio composition, three early-warning indicators can help frame the ongoing risk:
- Cap-weight vs. equal-weight spread: Sustained widening beyond the current 177 basis points signals further breadth deterioration
- Advance/decline breadth: Persistent sessions where more stocks decline than advance, even on positive index days, indicate narrowing leadership
- New highs vs. new lows count: The 14 May session’s 46 lows versus 34 highs at an all-time index high is the type of divergence that preceded leadership rotations in comparable historical episodes
The HHI reading of 185 versus a 5-year average of 142 provides a single summary measure of how far current concentration has departed from recent norms. That gap is the quantitative foundation for any rebalancing discussion.
For investors who have audited their semiconductor concentration and are exploring how rebalancing toward underrepresented parts of the market might reduce single-sector exposure, our deep-dive into small-cap rotation signals examines the Russell 2000’s 6-percentage-point year-to-date outperformance over the S&P 500, the institutional fund flow data behind the shift, and the valuation gap between the two indices that has historically preceded periods of small-cap leadership.
This article is for informational purposes only and should not be considered financial advice. Investors should conduct their own research and consult with financial professionals before making investment decisions.
Concentration is the feature until it becomes the risk
The semiconductor-led S&P 500 rally is backed by real earnings, genuine AI infrastructure demand, and balance sheets that distinguish this cycle’s leaders from prior concentration episodes. The bull case has near-term data supporting it, from Cisco’s order book revision to hyperscaler capex commitments extending through 2028.
The concentration, however, is now the market’s single largest structural vulnerability. When 19 stocks account for 70% of year-to-date gains, the rally’s fragility is the index’s fragility.
Narrow leadership can persist for longer than sceptics expect. It did in 2023, and it may again. What it does not do is resolve quietly. In every comparable historical episode, the metrics that deteriorated first were not the headline index level but the breadth indicators: the cap-weight vs. equal-weight spread, the advance/decline line, the ratio of new highs to new lows. Those metrics are deteriorating now.
The question for investors holding broad index exposure is not whether the semiconductor thesis is correct. It may well be. The question is whether they have examined their actual concentration and decided, deliberately, that the exposure is appropriate for their risk tolerance. That examination is worth conducting before the market conducts it for them.
Past performance does not guarantee future results. Financial projections are subject to market conditions and various risk factors.