Cochlear Share Price Crash: What the Fundamentals Actually Show
1 hr ago
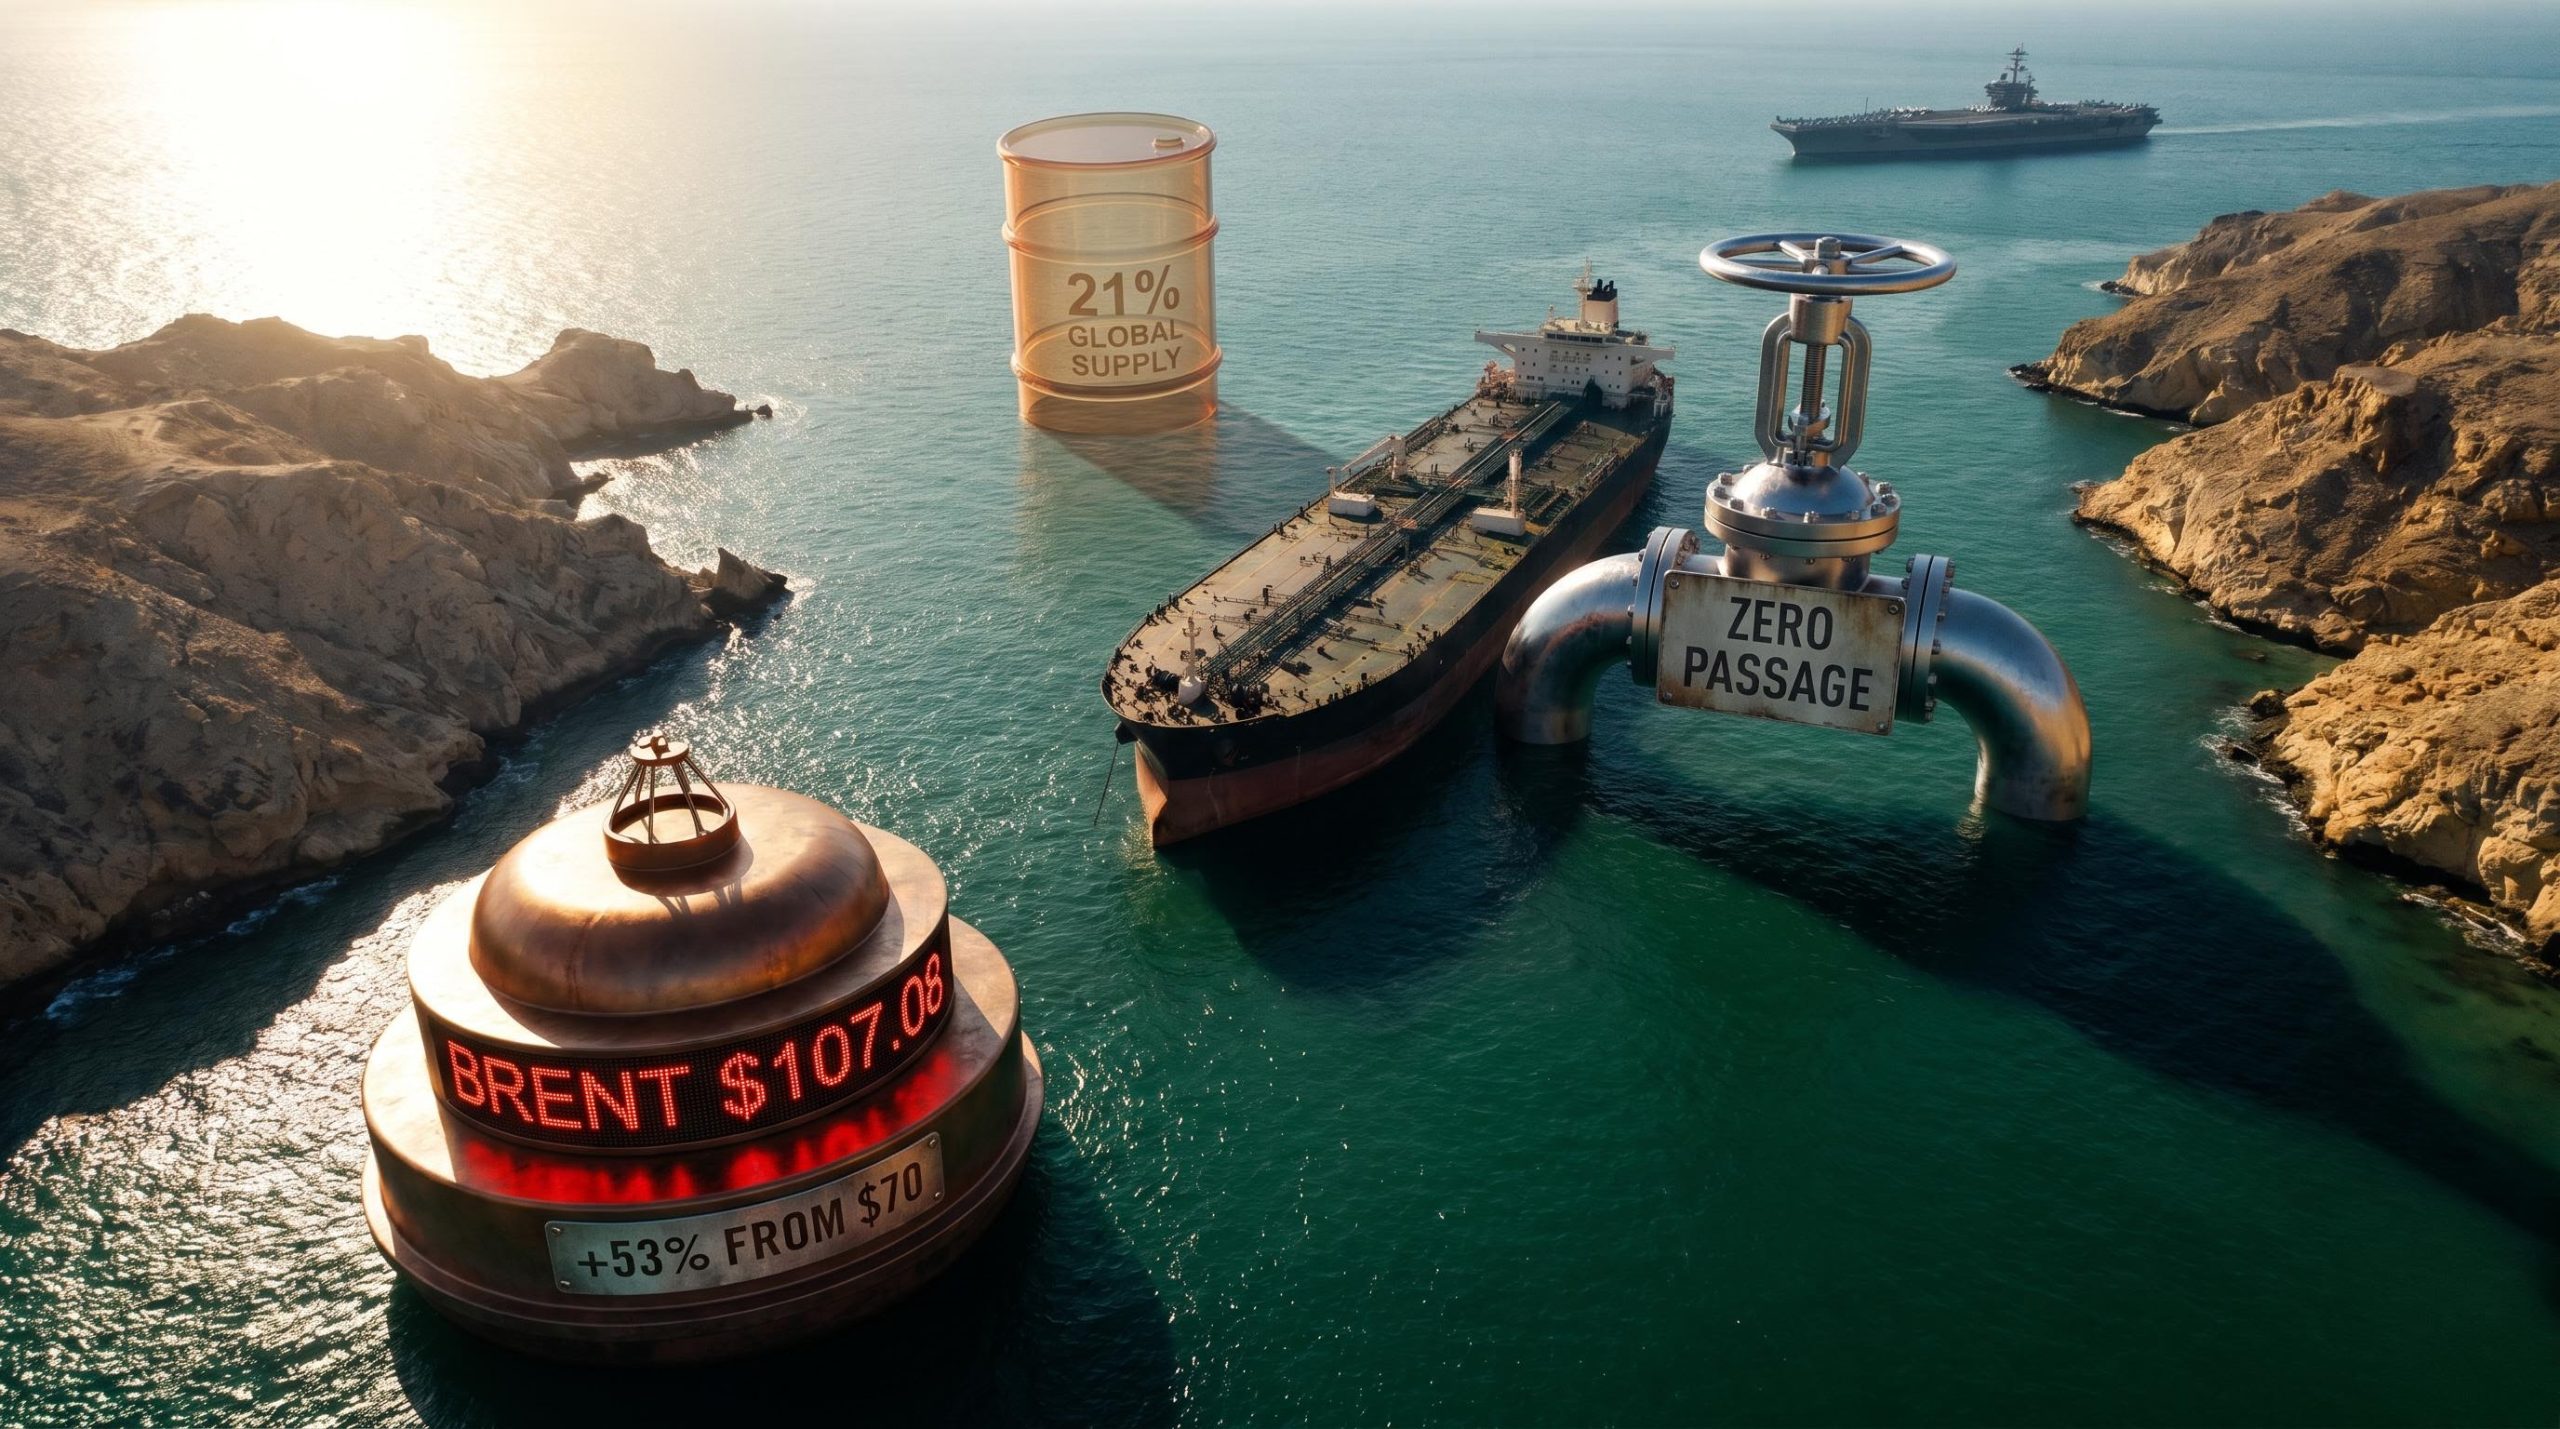
Brent crude closed at $107.08 on 13 May 2026, more than 50% above the roughly $70 level where it sat before a joint U.S.-Israel military strike on Iran changed everything in late February. That number is not an abstraction on a trading screen. It is the price embedded in every litre of petrol, every freight surcharge on consumer goods, and every inflation forecast shaping the Federal Reserve’s next move. The driver is not an OPEC decision or a demand collapse. It is a narrow waterway off Iran’s southern coast whose effective closure has removed roughly a fifth of global oil supply from the market in a matter of weeks. Peace talks are stalled, a Trump-Xi summit in Beijing produced no Strait of Hormuz breakthrough, and indirect negotiations via Oman remain pending. What follows explains exactly why the Strait matters, how the crisis moved oil prices to where they are, what two divergent scenarios look like in dollar terms, and how this shock is rippling into inflation, Federal Reserve policy, and portfolio positioning.
The Strait of Hormuz sits between Oman and Iran, connecting the Persian Gulf to the Gulf of Oman and the Arabian Sea. The navigable shipping lane is remarkably constrained, a corridor so narrow that it seems almost absurd to describe it as the passage through which the global energy system breathes.
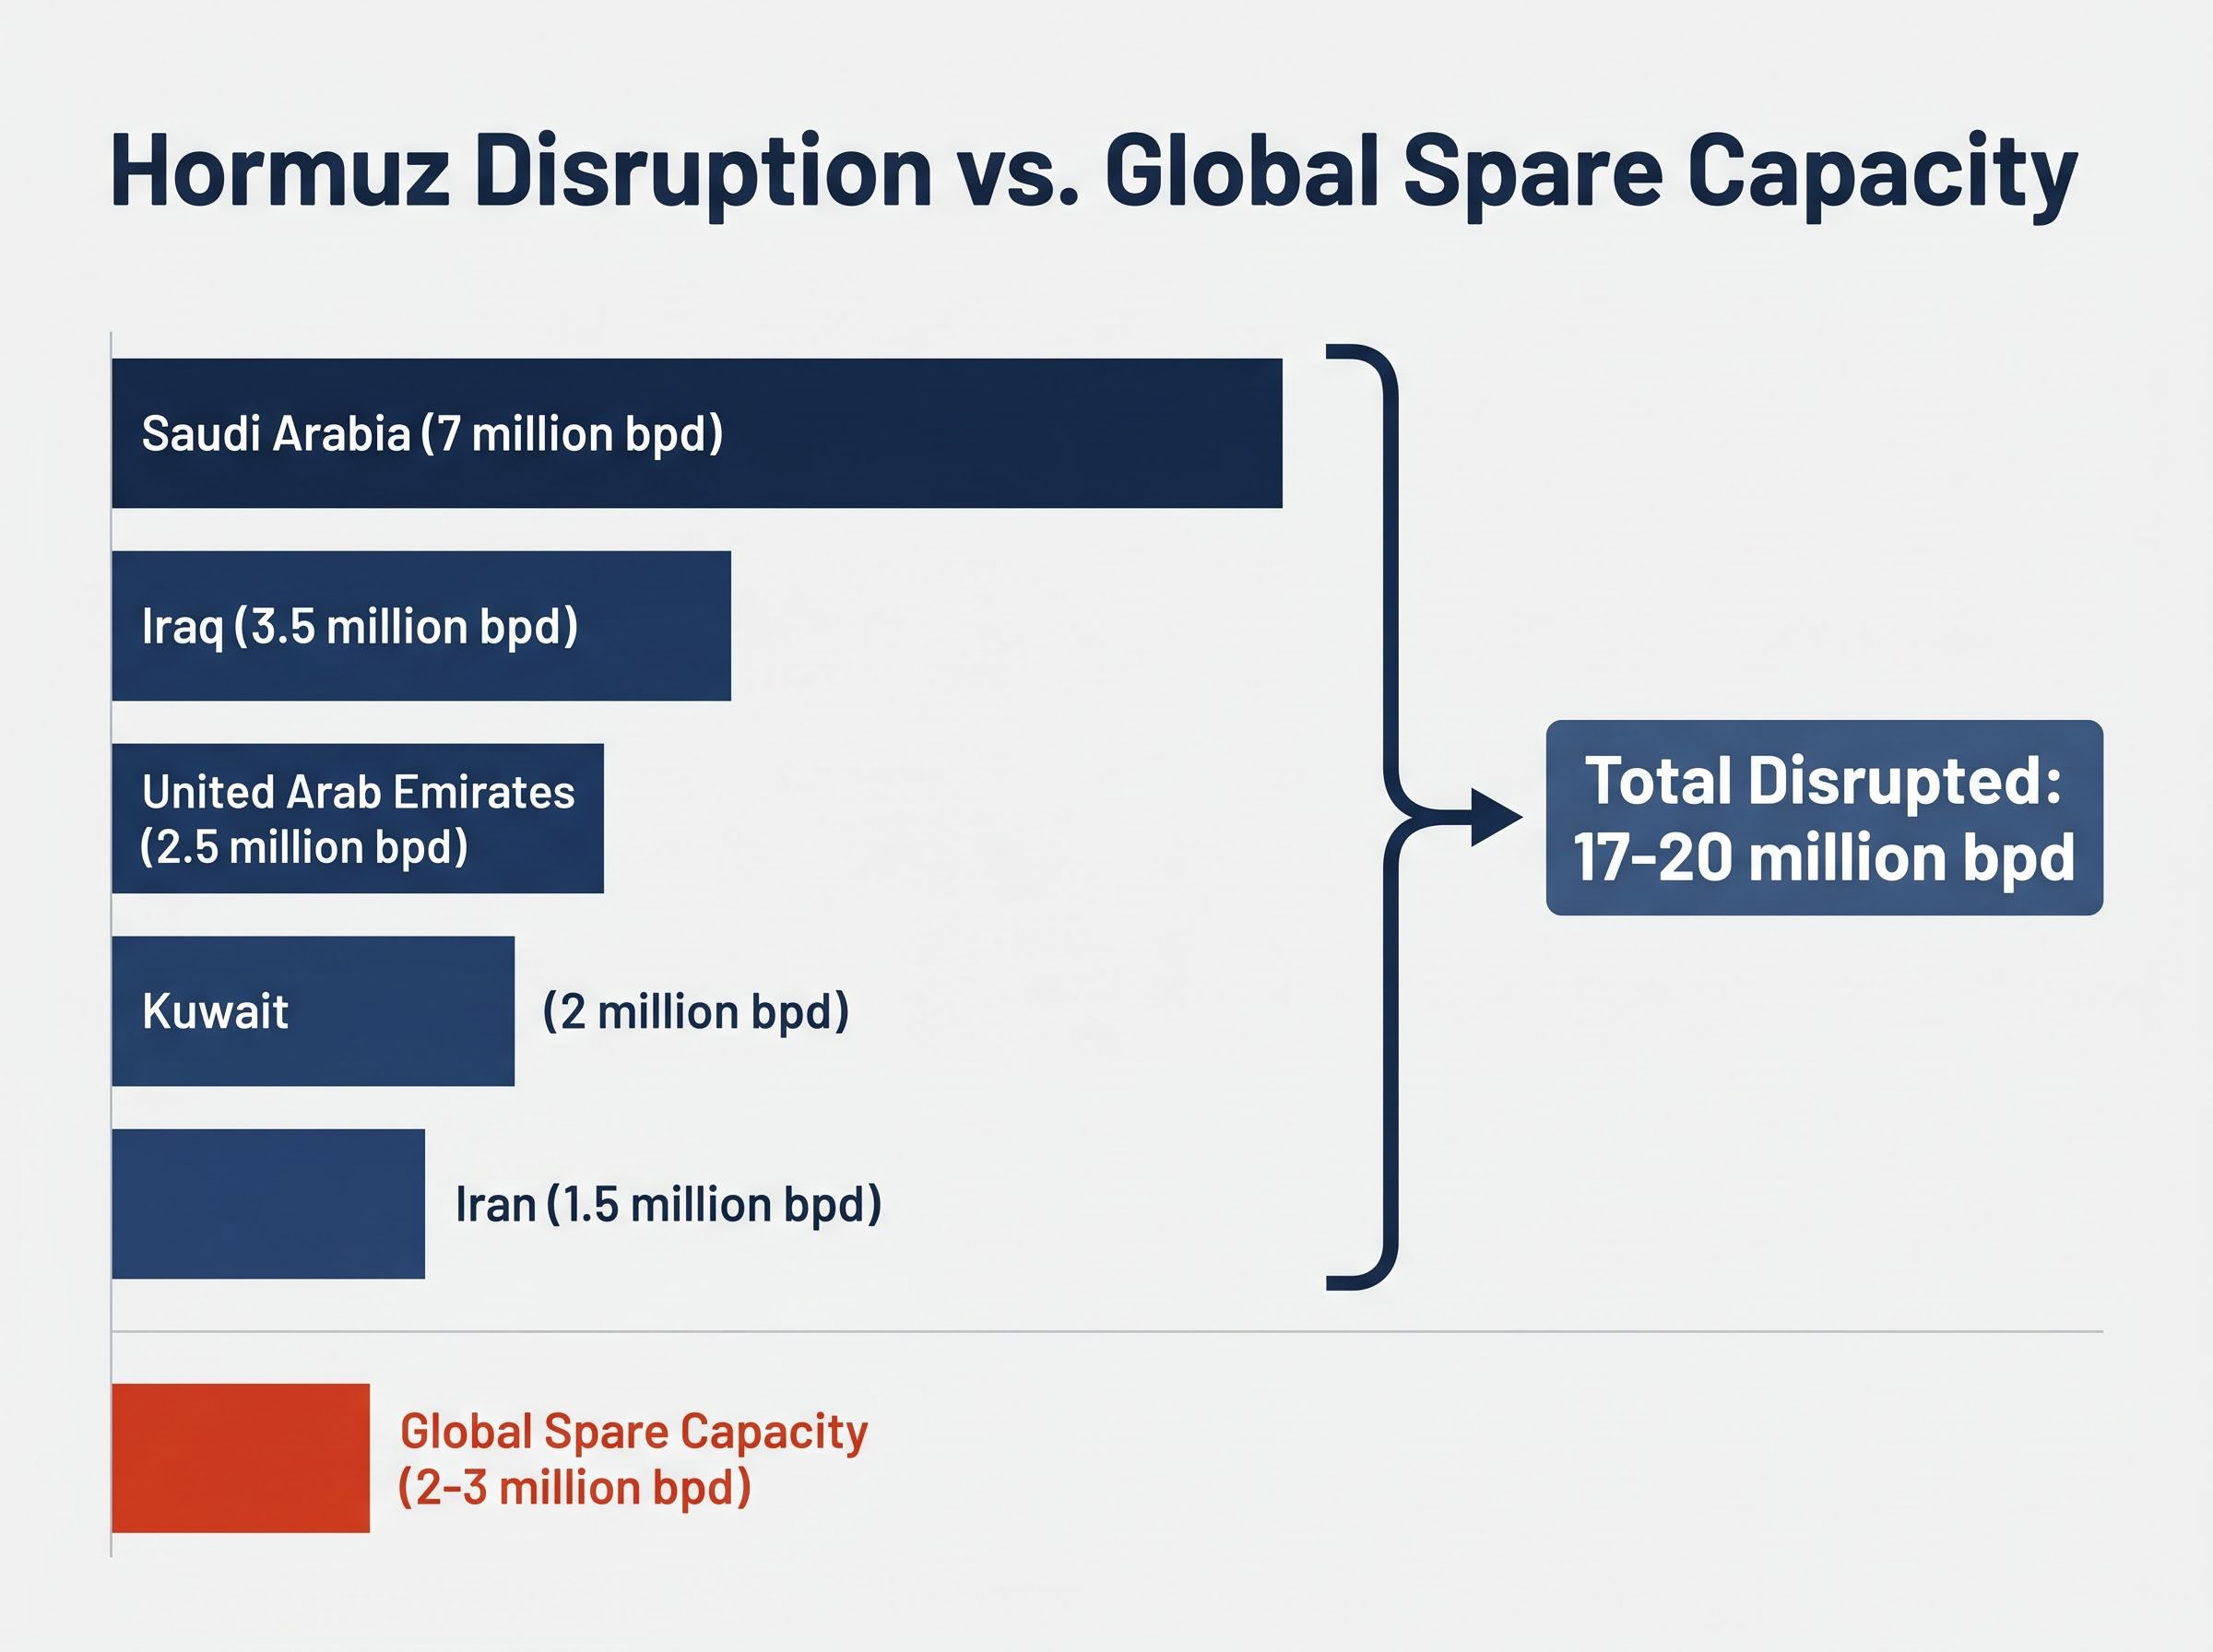
Approximately 21% of global oil supply, or roughly 17-20 million barrels per day (bpd), transited the Strait under normal pre-disruption conditions.
The producer nations whose exports depend on this single passage include:
There is no viable alternative route for the bulk of these volumes. Pipelines exist but cannot absorb anywhere near 17-20 million bpd of displaced throughput, making Hormuz genuinely irreplaceable in the short term. Before this crisis, Brent crude averaged approximately $80/bbl through 2025. Zero tanker passages were reported between 10 and 12 May 2026. The physical reality of that bottleneck is the foundation for everything that follows: the price surge, the diplomatic desperation, and the inflation mechanics that are reaching American households.
The price did not jump from $70 to $107 on speculation. It tracked a cause-and-effect chain that began with a single military decision and escalated through a series of responses, each one narrowing the path to resolution.
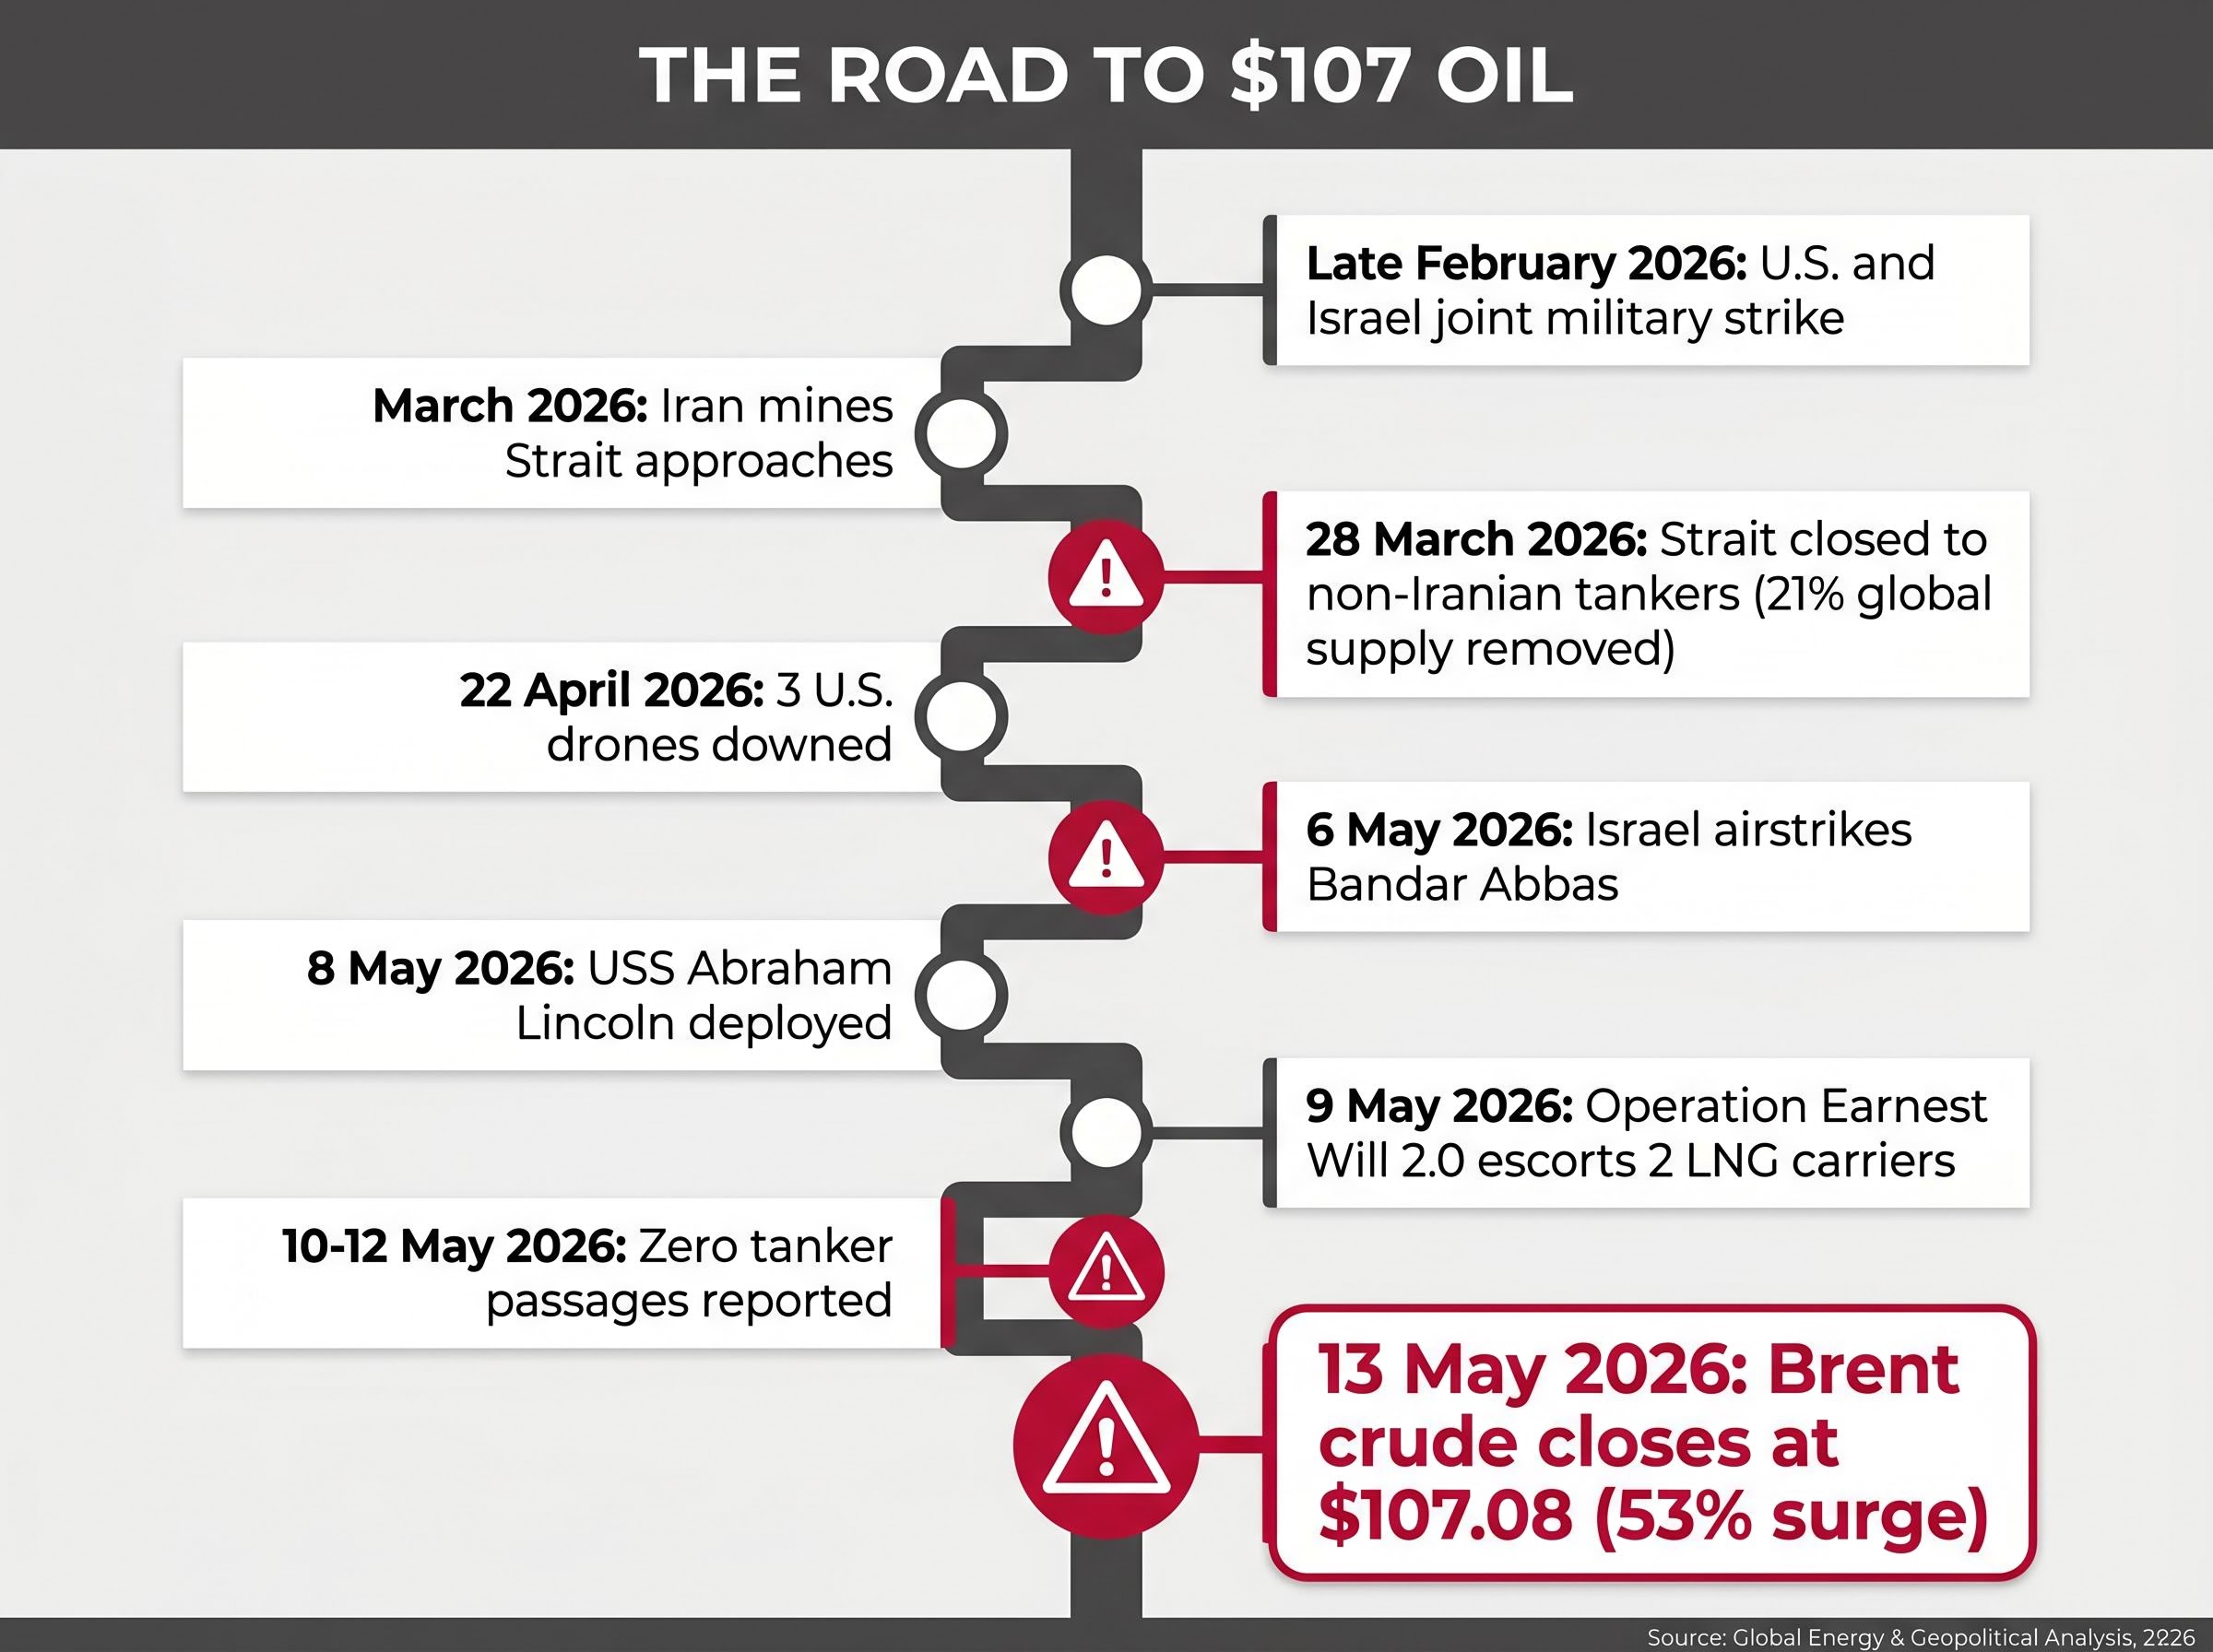
Operation Earnest Will 2.0 is itself a signal. The fact that even partial transit now requires direct military escort communicates ongoing risk to every insurer, every shipping operator, and every futures trader watching the Strait. The price premium is not speculative froth. It maps directly onto a documented military escalation sequence, and that sequence has not yet found a ceiling.
The price surge makes intuitive sense: less supply, higher price. The mechanism underneath is what determines whether this premium is temporary or structural.
Global spare production capacity, the amount of additional oil the rest of the world could bring online quickly, sits at approximately 2-3 million bpd. That figure is thin relative to the 17-20 million bpd being disrupted. Even if every producer with spare barrels opened the taps fully, the gap would remain enormous.
The current $20-30/bbl above the 2025 baseline of roughly $80/bbl represents what the market is pricing for three overlapping factors: lost supply, uncertainty about duration, and the cost of military-escorted transit.
The Hormuz risk premium is reinforced by a physical market signal that crude futures often lag: VLCC daily hire rates tracking at approximately $110,000 per day, a level that reflects the near-total withdrawal of commercial war-risk insurance coverage even when physical passage was technically available on certain days.
According to a Reuters poll on 12 May 2026, analysts assigned approximately 60% odds to a prolonged closure scenario.
Two scenarios dominate institutional forecasting:
| Scenario | Assumed Duration | Projected Brent Price | Key Sources | Key Assumption |
|---|---|---|---|---|
| Strait remains closed | 1-3 more months | $130-$160/bbl by Q3 2026 | Goldman Sachs (10 May); JPMorgan (11 May) | Spare capacity cannot offset Hormuz volumes; closure exceeds 90 days |
| Partial deal reached | Within 4 weeks | $85-$95/bbl by July | BloombergNEF (12 May); UBS via FT Alphaville (11 May) | 50% traffic resumption caps rally; Iran demands delay full access |
That spread of roughly $50-65/bbl between outcomes is not just a number for energy traders. It has direct consequences for inflation, interest rates, and the valuation multiple applied to nearly every asset in a U.S. investor’s portfolio. One mitigating factor: the EIA forecasts U.S. domestic production at 13.6 million bpd in 2026, a meaningful buffer that simply did not exist during the oil shocks of the 1970s.
Oil does not stay in the oil market. It moves through the economy along specific channels, each of which is now carrying the Hormuz premium directly into American household costs:
The Bureau of Labor Statistics reported on 12 May 2026 that April 2026 CPI rose 3.8% year-on-year (headline), with the energy index up 17.9% year-on-year. The Cleveland Fed nowcast estimates the Hormuz closure alone is adding 1.2-1.5 percentage points to CPI via transport costs.
The Bureau of Labor Statistics CPI release for April 2026 confirmed headline inflation at 3.8% year-on-year, with the energy index component rising 17.9% over the same period, providing the clearest official measure of how the Hormuz disruption has transmitted into broad consumer prices.
The May CPI print, due for release on 11 June, is forecast at approximately 4.5% year-on-year. If that figure materialises, it would represent the most significant inflationary acceleration in over a year.
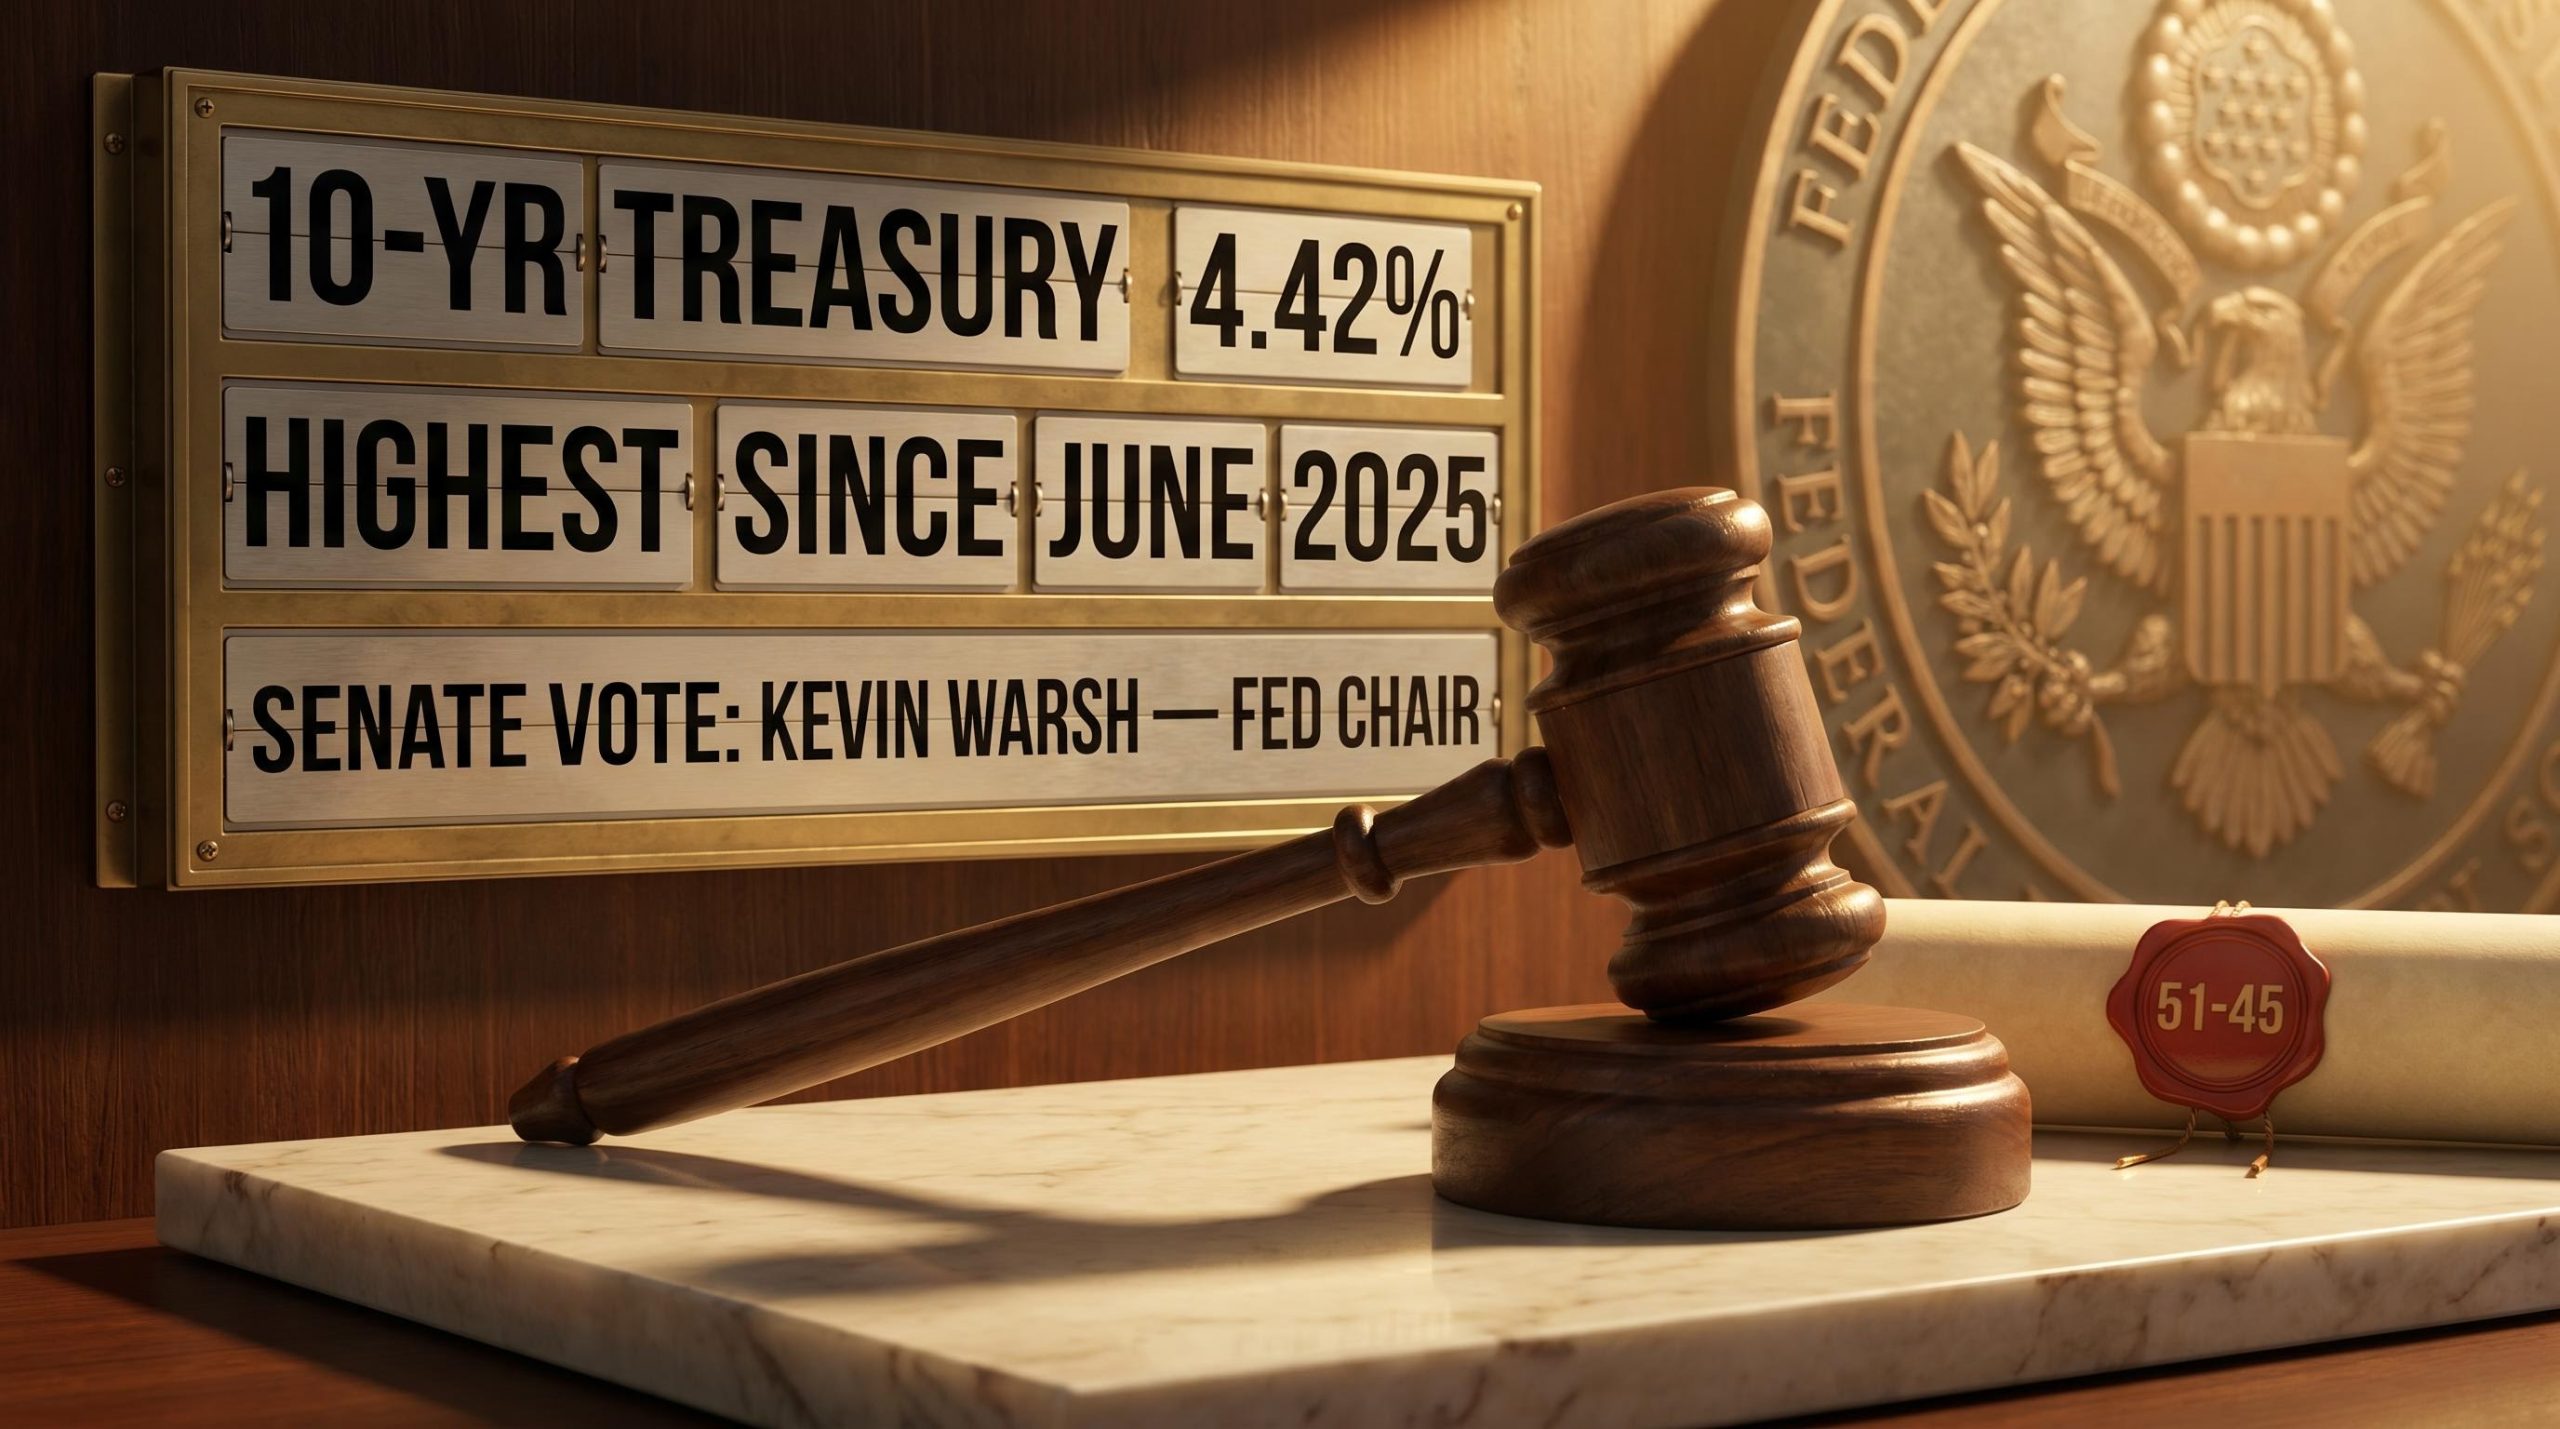
The CME FedWatch tool showed a 97.7% probability of a rate hold at the 17-18 June FOMC meeting as of 13 May, with only a 2.3% probability of a cut. The market has effectively removed rate relief from the near-term picture.
Kevin Warsh’s confirmation vote to replace Jerome Powell as Federal Reserve Chair was scheduled for 14 May, arriving at a moment when the new chair inherits a policy environment shaped by forces entirely outside the Fed’s control. President Trump has publicly pressured for rate cuts, but the inflation data points in the opposite direction. Goldman Sachs and JPMorgan both forecast that if the supply shock persists, the fed funds rate could reach 5.5-6% by year-end, with incremental 25 basis point hikes possible in July and September.
For investors wanting to understand the internal Fed dynamics that Kevin Warsh inherits, our full explainer on the FOMC dissent at the 29 April meeting breaks down the specific positions of the four dissenting members, the dual-mandate conflict between 3.5% PCE and rising unemployment, and what the committee’s public disagreement signals about the June statement language.
The 10-year Treasury yield stood at approximately 4.46% on 13 May. JPMorgan warned in an 11 May note that the yield could reach 5.5% if oil exceeds $120/bbl. The yield curve has deepened its inversion on recession fears, a pattern economists are comparing to the stagflationary episodes of 1973 and 1980: high inflation, slowing growth, and a central bank with no good options.
The diplomatic picture is genuinely unresolved. Three tracks are active, and none has produced a breakthrough:
China’s structural role as a major buyer of Iranian petroleum gives Beijing a potential economic lever. In theory, that makes China a credible deal guarantor. In practice, the Xi summit delivered language rather than mechanism.
Deutsche Bank analysts noted growing investor concern that a bilateral deal is further away than markets had previously anticipated.
Reports of possible White House consideration of resumed military operations add a further layer of uncertainty. In market terms, the gap between the two outcomes remains wide: BloombergNEF models that 50% traffic resumption would cap oil at $90/bbl, while Goldman Sachs projects $130+ if closure exceeds 60 days. The diplomatic calendar, not the price chart, is now the primary variable.
The two historical parallels analysts are using most frequently help calibrate expectations for duration and severity:
The key mitigating difference: U.S. domestic production at 13.6 million bpd provides a buffer that did not exist in the 1970s, when the U.S. was heavily import-dependent. However, global spare capacity at 2-3 million bpd limits the ability of other producers to compensate for Hormuz volumes.
The documented investor rotation reflects these conditions:
| Sector / Asset | YTD Performance | Flow Direction | Approximate Flow Size | Primary Rationale |
|---|---|---|---|---|
| Energy (XLE) | +28% | Inflows | $15 billion | Direct beneficiary of oil price surge |
| Commodities (GSG) | +22% | Inflows | CTAs long $100B notional | Broad commodity exposure to supply shock |
| TIPS (TIP ETF) | +12% | Inflows | $8 billion (Q2) | Inflation hedge as CPI accelerates |
| Defence (ITA) | +18% | Inflows | Lockheed, RTX each +25% | Geopolitical risk premium |
| Technology (QQQ) | -15% | Outflows | $20 billion | Growth repricing on higher rates/inflation |
The broader market split tells the story concisely: the S&P 500 and Dow Jones are up approximately 9% year-to-date, while the Nasdaq is down 4%, reflecting a structural shift from growth to value and energy. Oil futures are up 52% year-to-date.
The stagflation hedge positioning now visible across institutional portfolios, with Bridgewater warning of a 15-20% S&P 500 drawdown if the Hormuz blockade extends through Q3 2026 and major asset managers converging on real assets including energy equities, gold, and TIPS, reflects a collective judgment that the supply shock is structural rather than transient.
The outcome depends on diplomatic decisions that markets cannot control. The most useful posture is scenario awareness, not conviction in either direction.
Four signals will clarify which scenario is materialising:
The EIA’s baseline scenario assumes reopening by late May and projects Brent at $95/bbl for 2026 under that assumption. This provides a concrete anchor against which incoming news can be measured.
For investors who want to stress-test the two scenarios against the full range of analyst projections, our deep-dive into institutional oil price forecasts maps EIA, Goldman Sachs, and JPMorgan projections through 2027 across both reopening and prolonged closure scenarios, including the specific pipeline alternative capacity constraints that limit Saudi and UAE rerouting options.
The asymmetry in the current setup is worth noting. The downside scenario (closure past 60 days, $130+ oil) carries more severe economic consequences, including potential stagflation and a fed funds rate approaching 6%, than the upside scenario ($85-90 oil on a deal) delivers relief. The 5-year TIPS breakeven inflation rate at 1.95% as of 11 May suggests the bond market has not yet fully priced a prolonged closure, meaning the downside adjustment could be sharp if the Oman talks fail.
This article is for informational purposes only and should not be considered financial advice. Investors should conduct their own research and consult with financial professionals before making investment decisions. Financial projections referenced are subject to market conditions and various risk factors. Forward-looking statements from analysts are speculative and subject to change based on diplomatic developments and market conditions.
The market is pricing approximately a 60% probability of prolonged closure, and the $20-30/bbl crisis premium is now embedded in inflation data and bond yields. A resolution would deliver significant relief across asset classes, but the diplomatic path to that resolution remains genuinely uncertain.
The variables the reader now understands form a connected chain: the Strait’s physical irreplaceability, the thin spare capacity buffer that prevents other producers from filling the gap, the two price scenarios and their divergent portfolio implications, and the specific negotiating sticking points that still separate the parties. Each feeds the next.
The outcome depends on diplomatic decisions being made in Oman, Beijing, and Washington. Markets can price probability, but they cannot force a deal. The most useful posture for investors is not a bet on either scenario but a clear understanding of the signals that will distinguish one from the other as they arrive.
The Strait of Hormuz is a narrow waterway between Oman and Iran that approximately 21% of global oil supply, or 17-20 million barrels per day, passes through under normal conditions. Because no alternative route can absorb those volumes, any disruption to the Strait directly removes a significant share of global supply and drives oil prices sharply higher.
Brent crude rose from roughly $70 per barrel before the late February 2026 U.S.-Israel strike on Iran to $107.08 by 13 May 2026, a rise of more than 50%, with analysts at Goldman Sachs and JPMorgan projecting a further move to $130-$160 per barrel if the closure extends through Q3 2026.
The April 2026 CPI came in at 3.8% year-on-year with the energy index up 17.9%, and the Cleveland Fed estimates the Hormuz closure alone is adding 1.2-1.5 percentage points to CPI via transport costs. This has effectively removed near-term Fed rate cuts from market pricing, with Goldman Sachs and JPMorgan forecasting the fed funds rate could reach 5.5-6% by year-end if the supply shock persists.
If the Strait remains closed for one to three more months, Goldman Sachs and JPMorgan project Brent at $130-$160 per barrel by Q3 2026. If a partial deal is reached within four weeks, BloombergNEF and UBS project Brent falling back to $85-$95 per barrel by July 2026.
Investors have rotated into energy equities (XLE up 28% year-to-date with $15 billion of inflows), commodities, TIPS, and defence stocks, while selling technology (QQQ down 15% year-to-date with $20 billion of outflows) as higher rates and inflation reprice growth assets.