How the US Government Became Intel’s Investor and Deal Broker
5 mins ago

CAR Group reported 16% profit growth in the first half of FY26, reaffirmed its full-year outlook, and delivered constant currency revenue growth of 13% across its international platforms. The share price has not rewarded any of it. Down roughly 14% since the start of 2026 and approximately 33% below its August 2025 peak, CAR Group’s stock is pricing in something that the operating results, so far, do not reflect. That gap between share price and business performance is the question worth examining. What follows is a structured walk through the decline itself, the business model underpinning the valuation, how the current price-to-sales ratio compares to history and peers, and which specific risks are keeping the market from closing the discount.
The decline did not arrive in a single move. CAR Group traded at approximately $41.35 on 15 August 2025, the day William Elliott formally took over as CEO. By the start of 2026, the stock had already shed a substantial portion of that value. Through the first four and a half months of this year, a further 14.27% has come off, bringing the price to approximately $27.57 as of 13 May 2026.
Three reference points frame the full picture:
That is nearly $5.7 billion in market value erased since the August peak, a number that carries weight beyond the percentage decline.
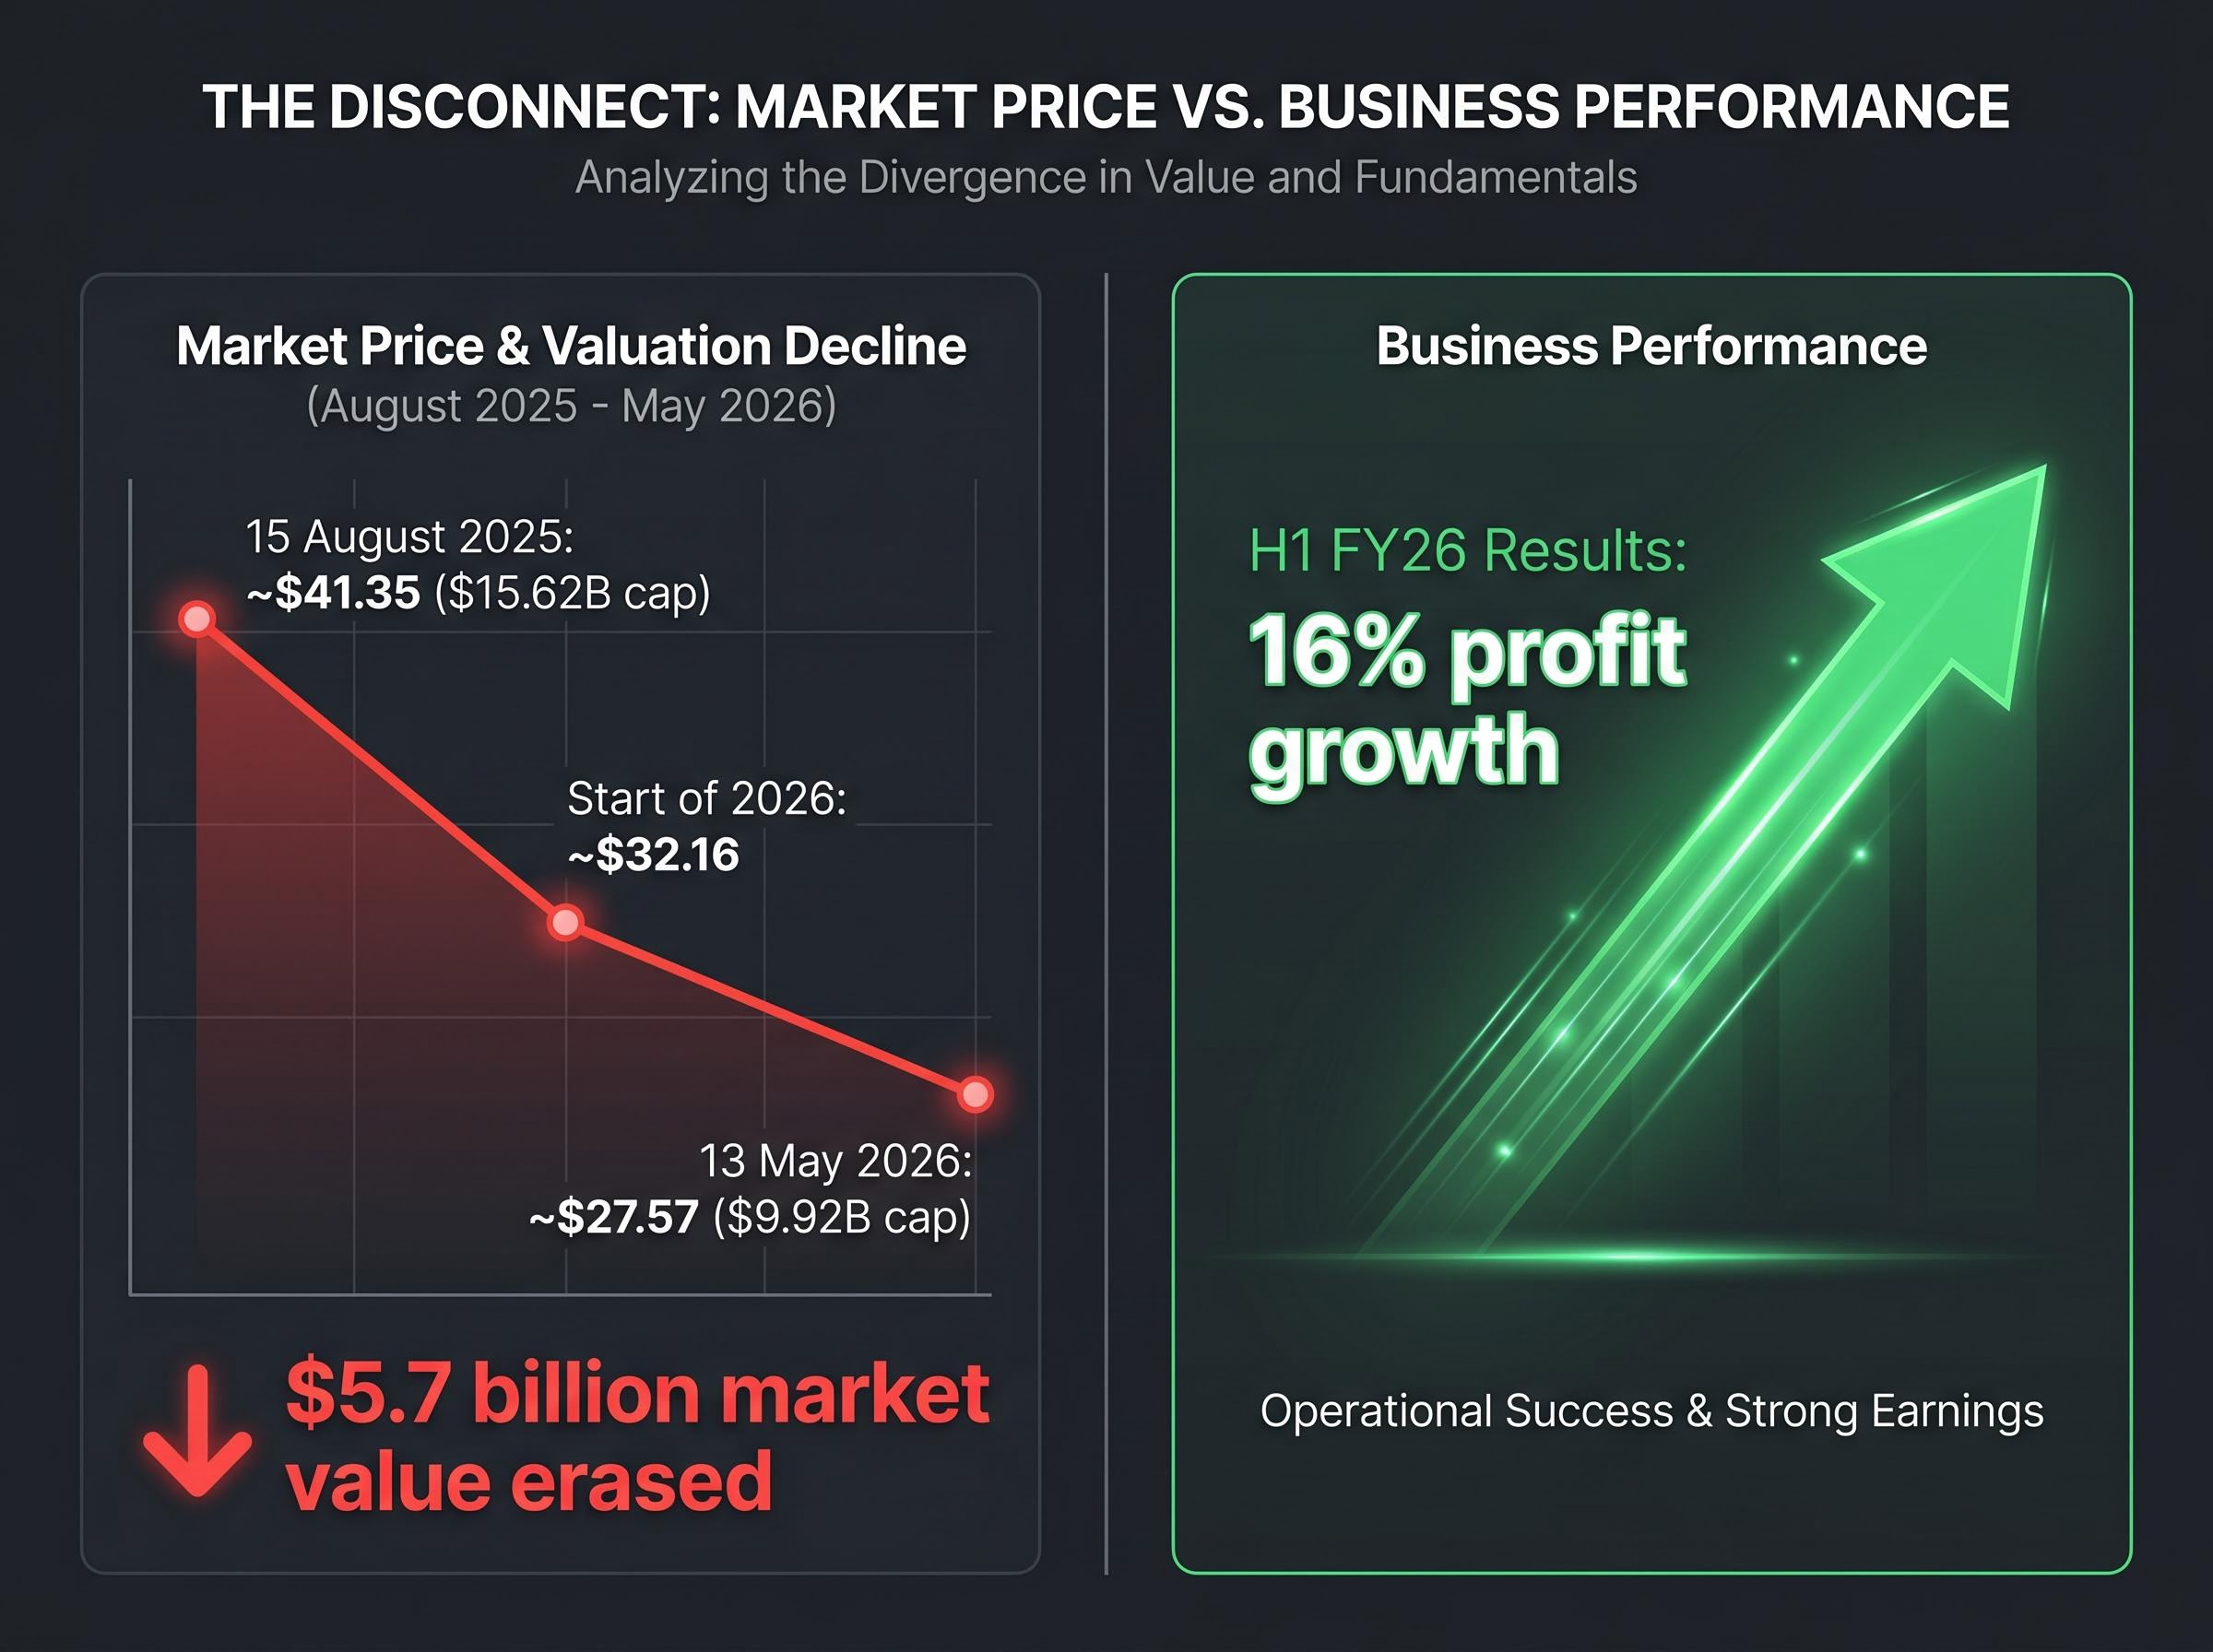
The disconnect: CAR Group’s H1 FY26 results showed 16% profit growth year on year, yet the share price sits 33% below its August 2025 high. This is a price-led compression, not an earnings-led decline.
Management reaffirmed full-year guidance when it released those half-year numbers on 9 February 2026. The market has continued selling regardless.
CAR Group operates digital automotive marketplaces, platforms where buyers search for vehicles and dealers pay to list them. The model generates revenue primarily through dealer subscription fees, premium listing products, and advertising. It is, at its core, a toll-booth business: the company does not hold inventory or take on vehicle risk, but captures a fee every time a transaction flows through its platforms.
The company rebranded from carsales.com.au on 3 November 2023, reflecting a geographic footprint that had outgrown its original name. Today, it operates across five markets:
Marketplace businesses typically command higher revenue multiples than traditional media or automotive companies. The reason is structural: each new buyer on the platform makes it more valuable to sellers, and vice versa, creating a self-reinforcing network effect. Revenue tends to be recurring, margins tend to expand with scale, and switching costs for dealers are high once they are embedded in a platform’s ecosystem.
FY25 revenue reached $1.18 billion, up 7.75% year on year. The H1 FY26 numbers accelerated that trajectory, with reported revenue growing 8% and constant currency revenue growing 13%, evidence that international platforms are contributing meaningfully rather than simply adding geographic labels.
CAR Group’s H1 FY26 ASX results release, published on 9 February 2026, confirmed reported revenue growth of 8%, NPAT growth of 16%, and a reaffirmation of full-year guidance, providing the primary source data behind the financial figures discussed throughout this analysis.
Management has signalled that organic growth within existing platforms, rather than new acquisitions, is the current strategic priority. No confirmed M&A activity has surfaced since mid-2024.
A price-to-sales (P/S) ratio measures how much investors are paying for each dollar of a company’s revenue. It is calculated by dividing a company’s market capitalisation by its annual revenue and is expressed as a multiple. A P/S of 9.30x means the market is valuing the business at $9.30 for every $1 of sales it generates.
The metric is particularly relevant for high-growth marketplace and technology businesses. Earnings in these companies can fluctuate as management invests in new markets or product development, temporarily suppressing profitability. Revenue trajectory, by contrast, reveals the underlying scale and demand for the platform without that noise.
| Metric | Current Value | Five-Year Historical Average |
|---|---|---|
| P/S Ratio | ~9.30x | 14.28x |
| Trailing P/E | ~32.72x | 54-57x (mid-2025 levels) |
CAR Group’s current P/S ratio of approximately 9.30x represents a 35% discount to its five-year historical average of 14.28x.
Three explanations, not mutually exclusive, account for that gap. First, the share price has compressed faster than revenue has grown, mechanically dragging the ratio down. Second, the market may be applying a lower growth premium, reflecting scepticism about whether double-digit revenue growth can persist under current macro conditions. Third, a structural re-rating could be underway, where investors permanently assign a lower multiple to the business.
A P/S ratio is a screening tool, not a verdict. It identifies a stock that warrants closer examination but cannot, on its own, tell an investor whether the discount represents opportunity or a market that has correctly repriced risk. Growth rate, profitability, capital allocation, and macroeconomic context all feed into that determination.
A P/S ratio is a screening tool, not a verdict, and the same limitation applies across most single-figure stock valuation metrics; the PEG ratio, P/FCF, and EV/EBITDA each correct specific failure modes that a standalone P/E or P/S reading cannot account for, particularly for companies cycling between heavy investment and profitability.
Examining CAR Group’s multiples in isolation tells only half the story. The peer comparison reveals whether the compression is specific to this company or part of a broader repricing across digital automotive marketplaces.
| Company | Market | P/S (TTM) | P/E (Trailing) | Key Note |
|---|---|---|---|---|
| CAR Group | Australia | ~9.30x | ~32.72x | 35% P/S discount to own history |
| Auto Trader UK | UK | ~10-12x | ~15x | Mature UK market, lower growth expectations |
| Cars.com | US | ~0.97x | ~34-38x | Low P/S reflects US cyclicality |
| Scout24 | Germany | ~7.14x | ~19-21x | Strong classifieds model, international growth |
One comparison stands out. At a trailing P/E of approximately 32.72x, CAR Group now trades below Cars.com (approximately 34-38x), reversing the earlier narrative from mid-2025 that positioned CAR as the premium-multiple stock in the sector.
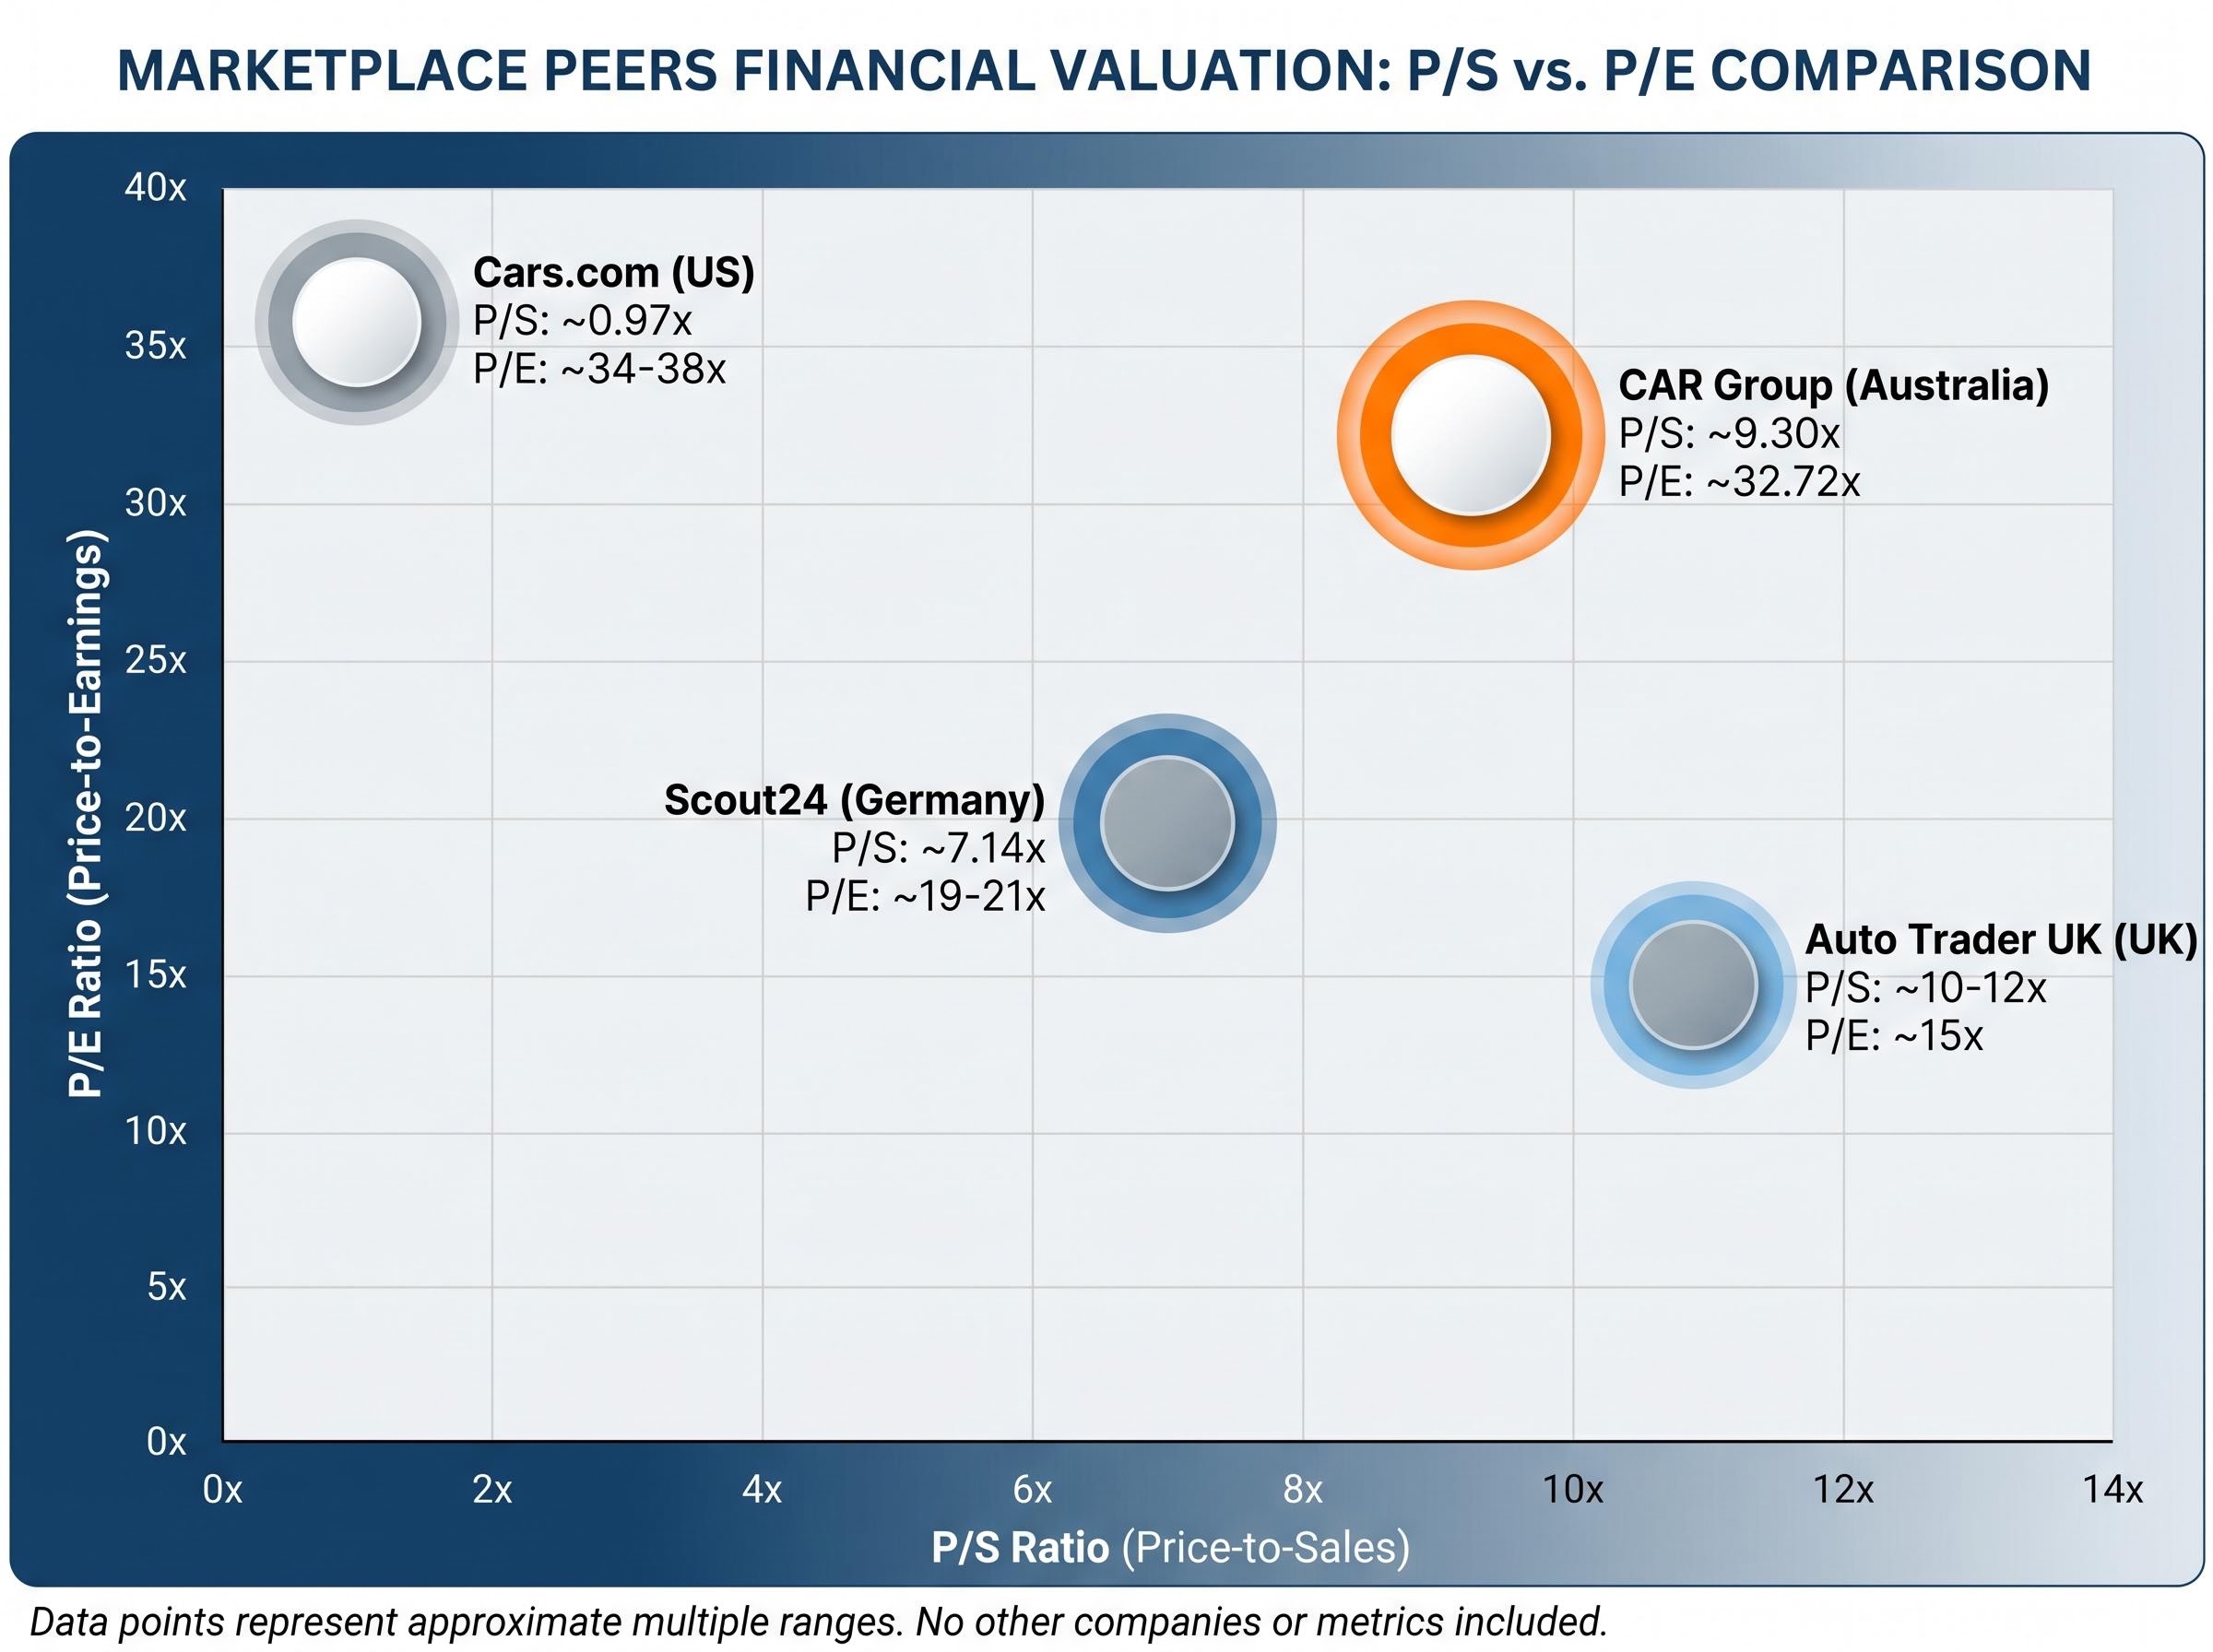
Auto Trader UK’s significantly lower P/E of approximately 15x reflects the maturity and lower growth expectations of the UK used-car market rather than a direct valuation benchmark for CAR Group’s higher-growth profile. Scout24 trades at a lower P/S (~7.14x) and a lower P/E (~19-21x), suggesting the European market applies a tighter multiple band to comparable marketplace models.
CAR Group’s 88% payout ratio also distinguishes it from peers on capital allocation. That level of earnings distribution leaves less room for reinvestment relative to Scout24 and Auto Trader UK, a trade-off that income-focused investors may welcome but growth-focused investors could view as a constraint.
The CAR Group valuation gap has been the subject of considerable analyst attention in recent weeks, with a separate assessment placing the P/S ratio at 7.90x against the same 14.28x five-year average, reflecting how rapidly the compression has moved across successive reporting periods.
A 35% discount to historical P/S averages is not an invitation to buy without scrutiny. Each of the headwinds pressuring the share price operates through a specific mechanism.
The most immediate is the interest rate environment. The Reserve Bank of Australia raised the cash rate to 4.35% on 5 May 2026, and sustained elevated rates are compressing vehicle affordability. Australian used-car listing conversion rates have declined approximately 5-10% year on year. Fewer conversions mean less transactional activity flowing through the platform, even if listing volumes hold.
The RBA’s decision on 5 May 2026 represented its third consecutive tightening move, with eight of nine board members voting for the hike and forward guidance language preserving full policy optionality rather than signalling a pause, leaving the path of rates beyond July 2026 genuinely open.
AADA’s used car market analysis covering the close of 2025 recorded falling national used car sales volumes and rising days-to-sell metrics, patterns consistent with the rate-driven affordability squeeze that is suppressing listing conversion rates on platforms like carsales.com.au.
Digital advertising competition represents a structural rather than cyclical pressure. Facebook Marketplace and Google advertising continue to erode demand for paid dealer listings. This challenge does not resolve when rates normalise; it persists and intensifies as those platforms invest further in automotive verticals.
The 88% payout ratio leaves limited earnings buffer. If FY26 full-year results, expected in August 2026, fall short of the trajectory set by H1, the dividend (currently yielding approximately 3% on a trailing basis) could come under pressure. A payout ratio at that level works when earnings are growing; it becomes a constraint when they are not.
CEO William Elliott, appointed on 15 August 2025 after a decade as CFO, has delivered operationally through H1 FY26. The share price has not responded to that execution, however, and the full-year result in August will be the more consequential test of investor confidence under new leadership. No confirmed M&A activity since mid-2024 also leaves capital deployment optionality uncertain; any future acquisition announcement would alter the current valuation framework.
The numbers are clear. CAR Group’s P/S ratio of approximately 9.30x sits 35% below its five-year average of 14.28x. Revenue grew 8% in H1 FY26, profits grew 16%, and management reaffirmed full-year guidance. The business is performing. The share price is not following.
The market’s hesitation has a rational basis. Elevated interest rates, structural competition from big-tech advertising platforms, and a high payout ratio that limits strategic flexibility all provide reasons to apply a lower multiple than history would suggest. The question for investors is whether those headwinds are permanent repricing factors or temporary conditions that will ease.
Three catalysts would confirm the discount thesis:
Broker consensus places a price target of approximately $33.39 on CAR Group, implying roughly 21% upside from the current $27.57. Bell Potter’s target of $42.20 represents the bull case, with 13 analysts carrying a Buy rating.
Those targets provide an independent reference frame, not a recommendation. The P/S discount flags CAR Group as a stock worth examining more closely. Whether it is worth buying depends on further due diligence into earnings quality, payout sustainability, and the investor’s own view on the timing of macro relief.
This article is for informational purposes only and should not be considered financial advice. Investors should conduct their own research and consult with financial professionals before making investment decisions. Past performance does not guarantee future results. Financial projections are subject to market conditions and various risk factors.
A price-to-sales (P/S) ratio measures how much investors pay for each dollar of a company's revenue, calculated by dividing market capitalisation by annual revenue. CAR Group's current P/S of approximately 9.30x sits 35% below its five-year historical average of 14.28x, signalling the stock is trading at a significant discount relative to its own history.
CAR Group's share price has declined approximately 14% since the start of 2026 and sits roughly 33% below its August 2025 peak, driven by elevated RBA interest rates compressing vehicle affordability, structural competition from Facebook Marketplace and Google, and broader market scepticism despite strong underlying earnings growth.
CAR Group operates digital automotive marketplaces, earning revenue through dealer subscription fees, premium listings, and advertising without holding vehicle inventory. It operates across five markets: Australia (carsales.com.au), the United States (Trader Interactive), South Korea (Encar), Chile (chileautos), and Brazil (webmotors).
Three key catalysts identified in analyst commentary include RBA interest rate easing relieving vehicle affordability pressure, FY26 full-year results in August 2026 sustaining or exceeding the H1 momentum of 16% profit growth, and continued constant currency international revenue growth above 10% validating the geographic diversification strategy.
At a trailing P/E of approximately 32.72x and P/S of 9.30x, CAR Group now trades below Cars.com on a P/E basis (34-38x) and above Scout24 on a P/S basis (7.14x), with broker consensus placing a price target of approximately $33.39, implying roughly 21% upside from the May 2026 price of $27.57.