How the Hormuz Closure Drives Oil Prices and Inflation
9 mins ago

ANZ just posted a 70% surge in cash profit for H1 FY2026, yet its share price has fallen roughly 3.5% in the past week. That disconnect, between a strong earnings beat and a sliding price, is exactly the kind of signal that rewards investors who look past short-term noise to assess underlying business performance.
The result, announced 1 May 2026, marks CEO Nuno Matos’s first full half at the helm and reflects a deliberate operational reset across the bank. With Australian bank earnings season well underway and the RBA having just lifted the cash rate to 4.35%, investors searching for clarity on ANZ’s trajectory are doing so in a genuinely complex macro environment. What follows breaks down the earnings drivers, assesses whether the cost improvements are structural, examines the dividend income case, benchmarks ANZ against CBA and NAB, and frames the risks that could test the thesis in the second half.
Cash profit came in at $3,780 million, up 17% year-on-year against H1 FY2025 and approximately 51% higher than H2 FY2025. The 70% figure cited in some coverage reflects a different base period comparison. Statutory profit reached $3,650 million, up 62% on a comparable basis versus the prior corresponding period. Operating income rose 3% year-on-year, a modest top-line gain that makes the profit surge all the more notable for where it came from.
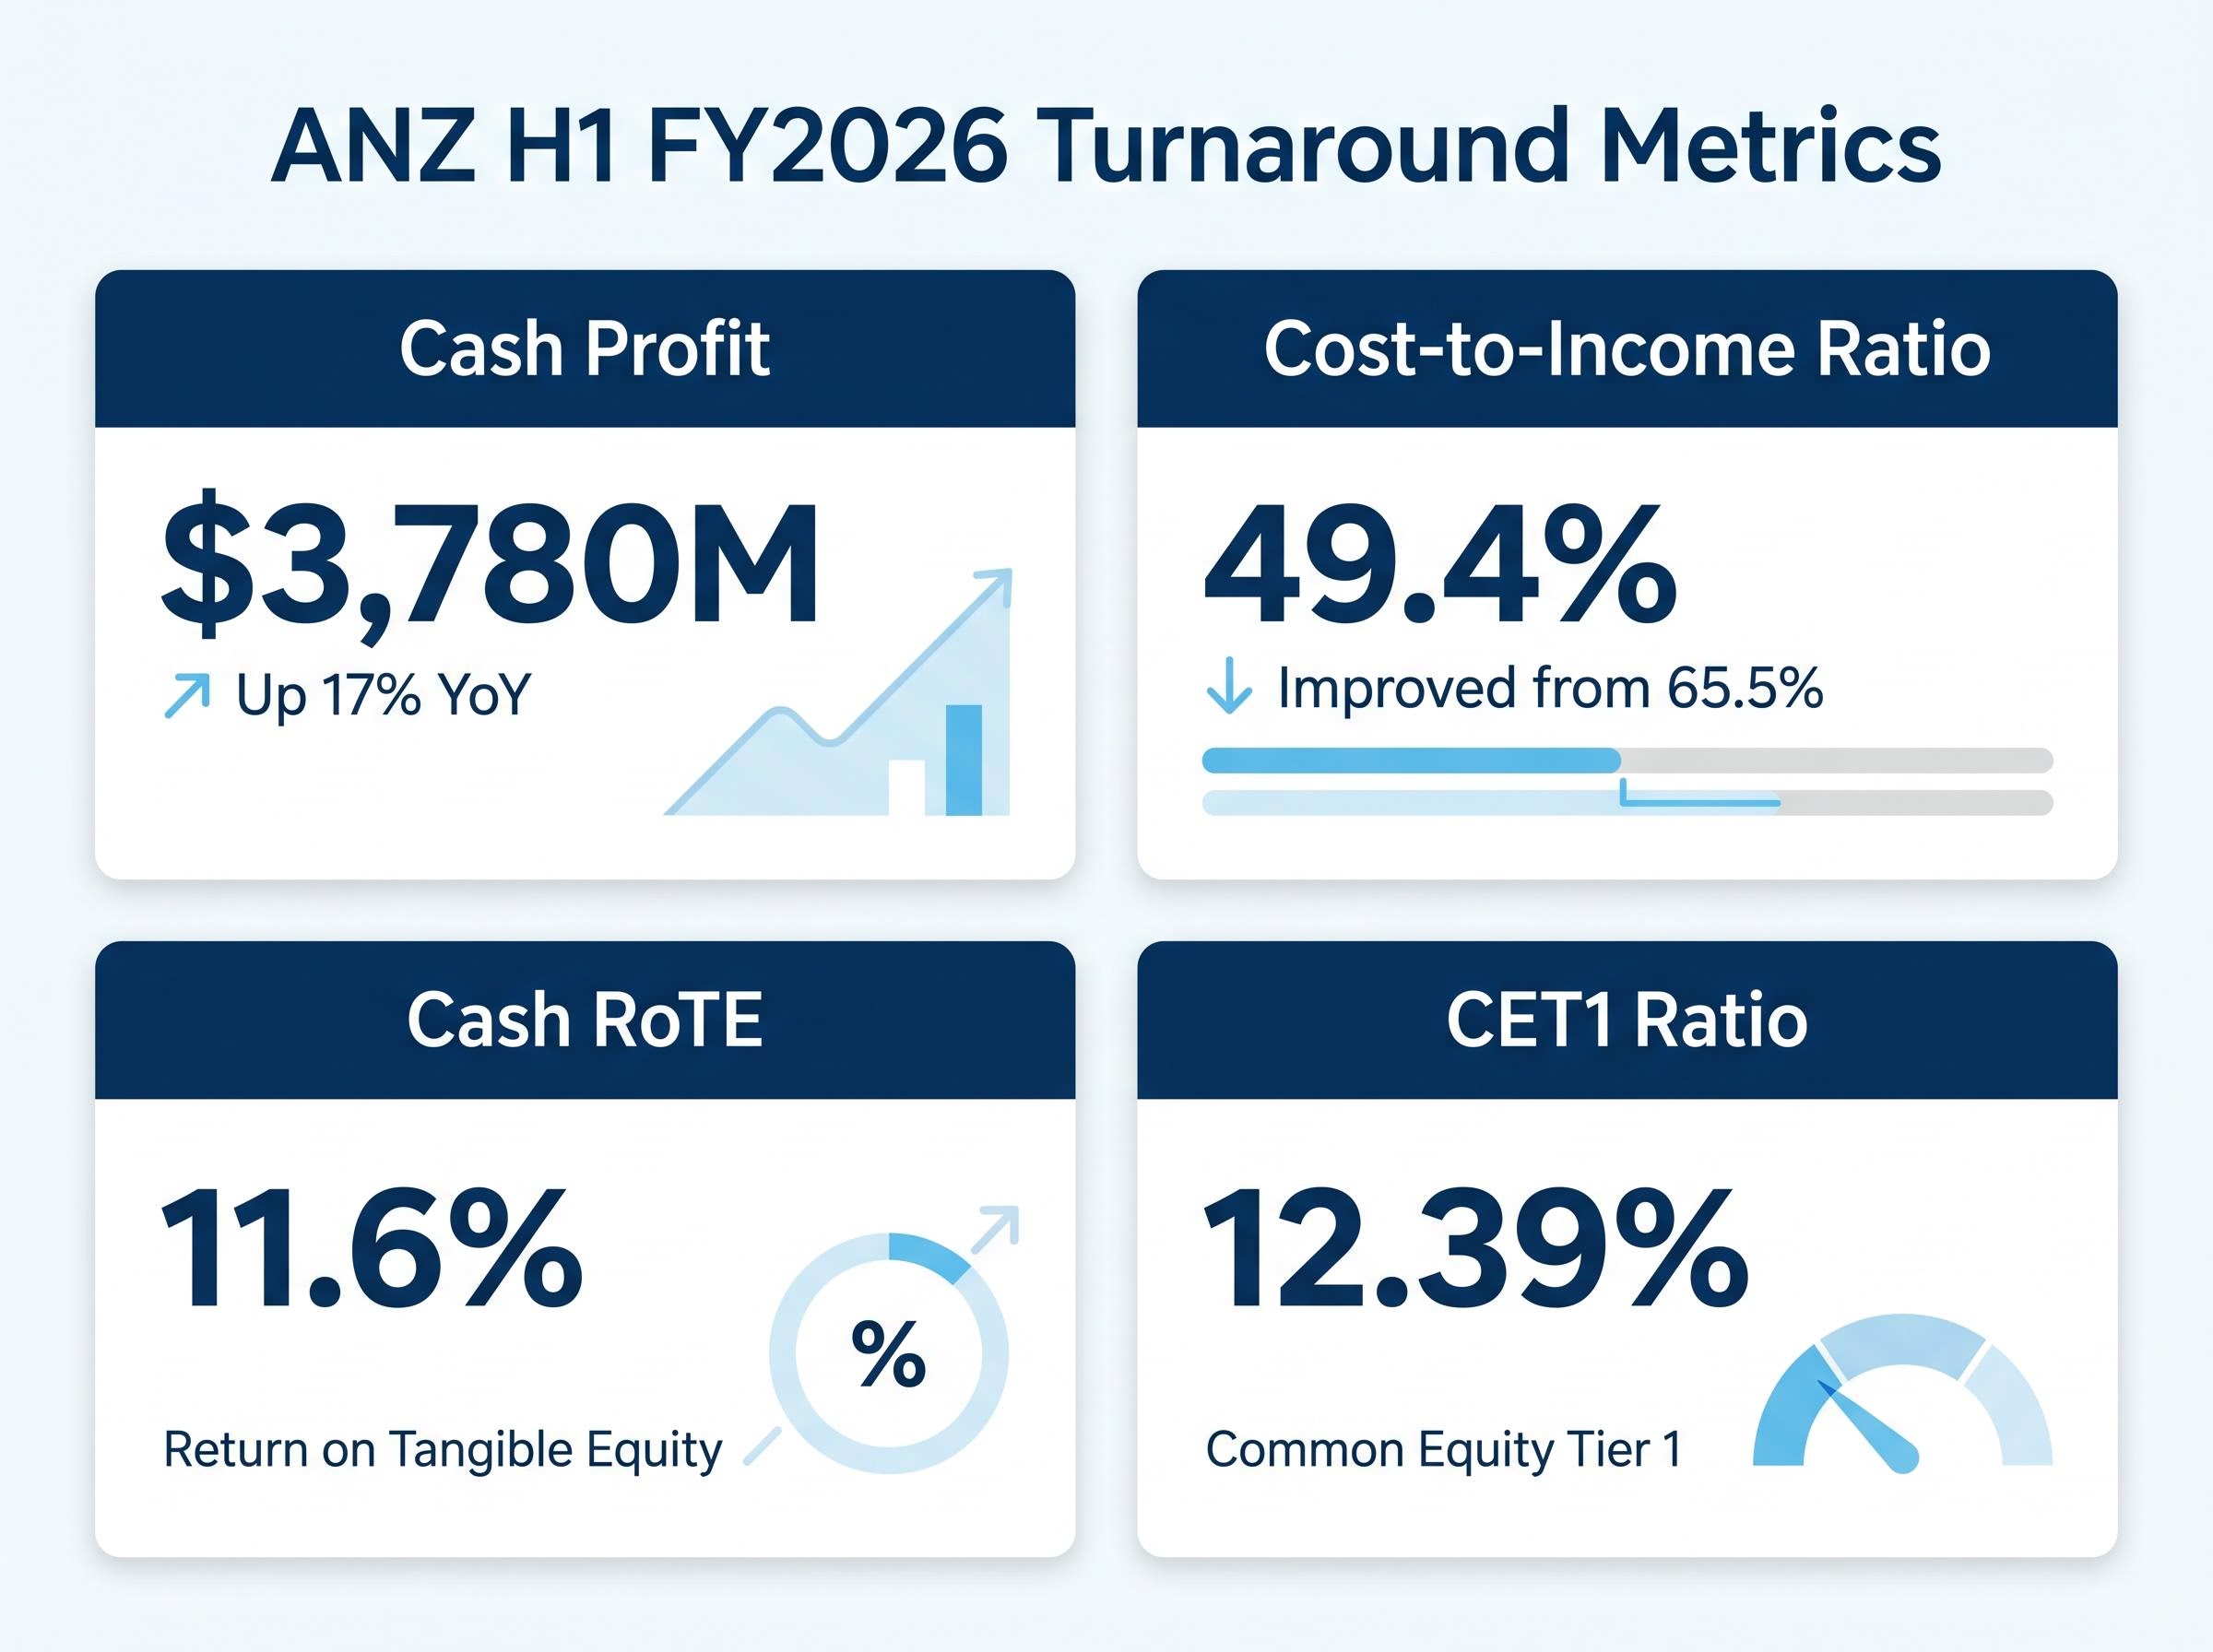
The cost-to-income ratio tells that story most clearly.
ANZ’s cost-to-income ratio improved from 65.5% to 49.4%, a 1,610 basis point swing in a single half. That is the single most operationally significant metric in the release.
Cash return on tangible equity (RoTE) rose to 11.6%, an improvement of approximately 210 basis points. The CET1 capital ratio strengthened to 12.39%, up 36 basis points, reinforcing the bank’s capital buffer.
| Metric | H1 FY2026 | H2 FY2025 | H1 FY2025 |
|---|---|---|---|
| Cash Profit | $3,780M | ~$2,500M | ~$3,230M |
| Cost-to-Income Ratio | 49.4% | 65.5% | — |
| Cash RoTE | 11.6% | ~9.5% | — |
| CET1 Ratio | 12.39% | ~12.03% | — |
For shareholders assessing whether to hold or add, the cost-to-income ratio in particular signals that profit growth was driven primarily by cost discipline rather than revenue tailwinds, a distinction that matters for durability.
Operating expenses fell 22% to $5,534 million versus H2 FY2025 on a headline basis. That is the number that generated the strongest reaction. It is also the number that requires the most careful interpretation.
On an adjusted, comparable basis, stripping out Suncorp integration costs and restructuring charges, the reduction was 9%. The gap between those two figures is where the sustainability question lives.
CEO Nuno Matos, who commenced in the role on 12 May 2025, attributed the savings to three operational levers:
By the reporting date, ANZ had achieved 49% of its $800 million gross cost-savings target for FY2026. That provides a measurable progress anchor, but it also means the second half needs to deliver the remaining 51% to hit the full-year goal.
The three cost categories break down differently in terms of permanence. Suncorp integration costs are finite; once the migration is complete, those expenses do not recur. Operational simplification savings, such as removing duplicated functions, tend to be ongoing. Regulatory settlement costs are by nature non-recurring.
The honest assessment: a meaningful portion of the headline 22% reduction reflects one-off items that will not repeat. The 9% adjusted figure is the better proxy for the bank’s underlying cost trajectory. Divisional cost breakdowns and specific management guidance on 2H FY2026 cost sustainability have not yet been publicly detailed, leaving a gap that analysts will need to fill as the earnings call transcript and ASX filings become available.
ANZ’s results referenced several metrics that recur in every major bank earnings release. Understanding four of them provides enough of a framework to assess any Big Four result independently.
APRA’s minimum CET1 requirements set a floor of 4.5% plus a 2.5% capital conservation buffer for authorised deposit-taking institutions, making ANZ’s reported 12.39% ratio a substantial margin above the baseline that regulators mandate for major banks.
| Metric | What It Measures | ANZ H1 FY2026 |
|---|---|---|
| Cash Profit | Underlying earnings power | $3,780M |
| Cost-to-Income Ratio | Operational efficiency | 49.4% |
| Cash RoTE | Return on shareholder capital | 11.6% |
| CET1 Ratio | Capital adequacy buffer | 12.39% |
Statutory profit, by contrast, includes one-off items such as acquisition-related charges and fair value adjustments. It matters for regulatory and accounting purposes but is a less reliable signal for ongoing earnings power.
The interim dividend came in at 83 cents per share, franked at 75%, payable in July 2026. The franking level rose 5 percentage points from the prior payment’s 70%, a detail income-focused investors will note.
At the current share price near $35.14, that implies an annualised forward yield of approximately 4.7%-4.8%, assuming a similar final dividend. ANZ has maintained the 83 cents per share payout consistently since July 2024, providing a defensible income floor even through a period of operational transition.
CommSec’s FY2027 dividend forecast of $1.72 per share implies a forward yield above 4.8% at current prices, signalling modest income growth ahead.
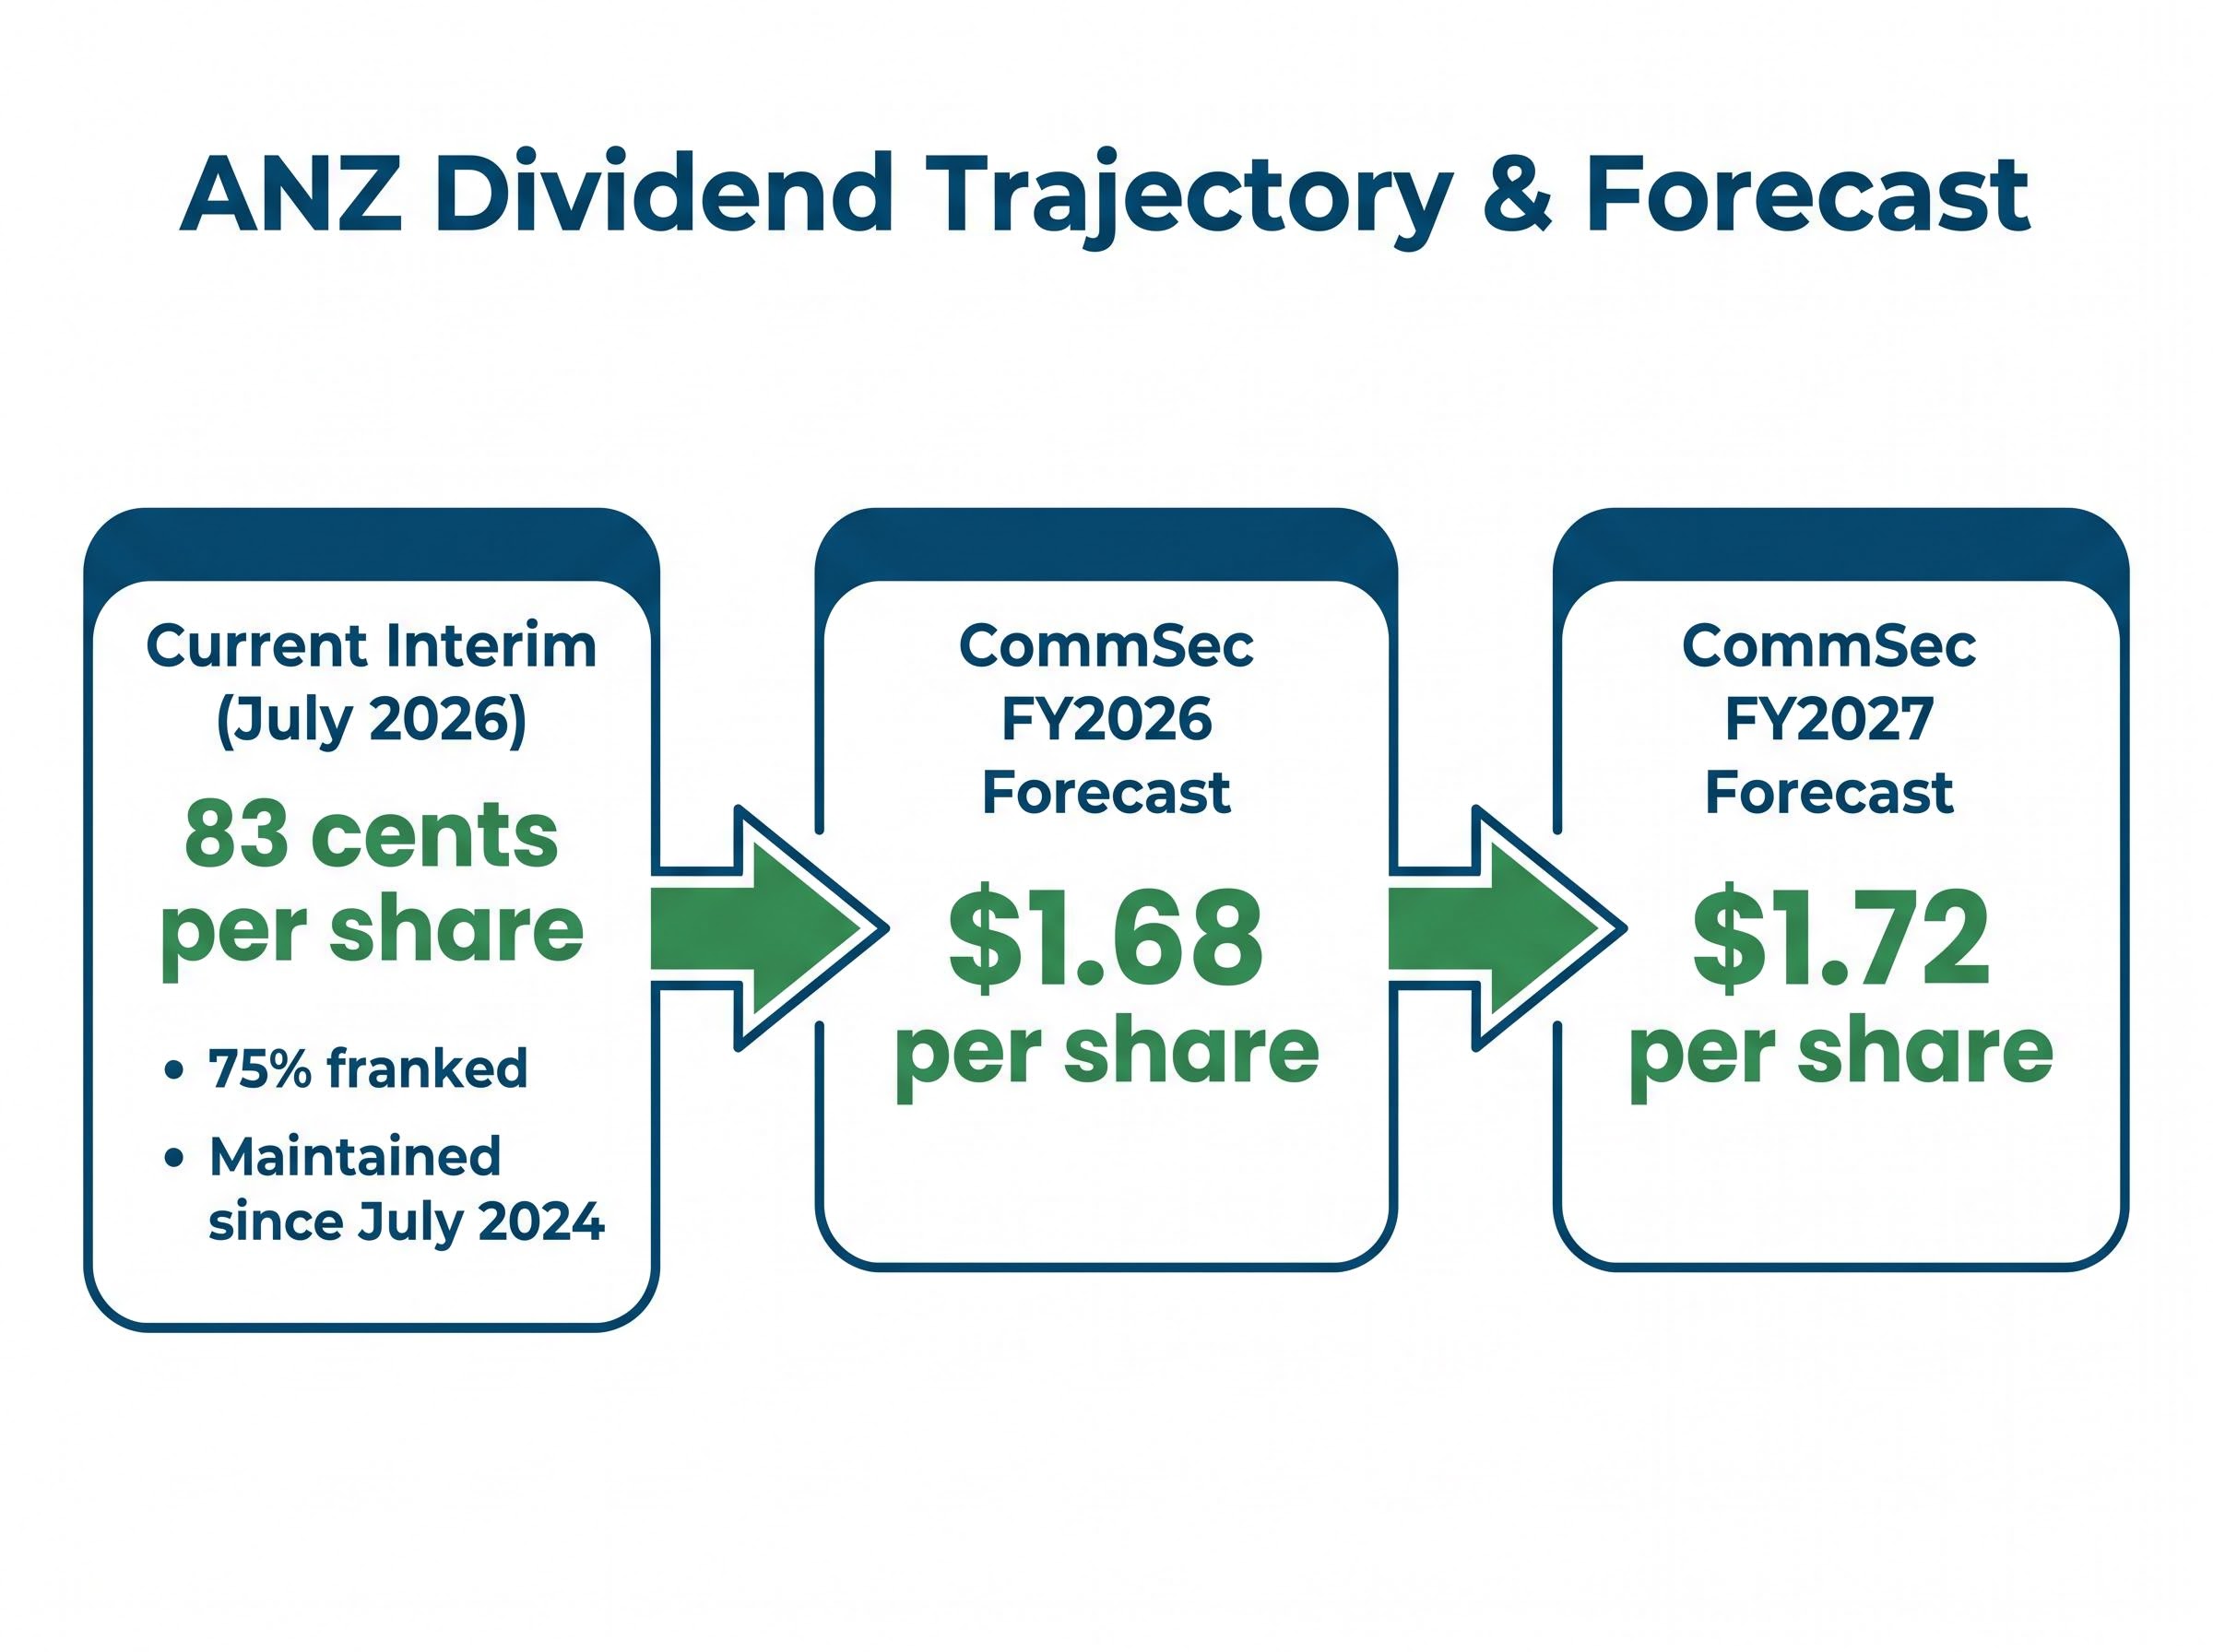
CommSec’s FY2026 full-year forecast sits at $1.68 per share (approximately 4.87% yield), with the FY2027 estimate stepping up to $1.72 per share. Among the Big Four, ANZ currently offers the highest yield. NAB’s interim dividend of 85 cents per share is slightly larger in absolute terms, but ANZ’s lower share price pushes its yield higher on a percentage basis.
Shareholders have three options for receiving the distribution:
ANZ’s 17% cash profit growth year-on-year outpaced CBA’s 5% and NAB’s 6.4% by a considerable margin. On a relative growth basis, the result is the strongest among the three banks that have reported so far this season. Westpac had not yet reported as of mid-May 2026.
The growth rate, however, does not change the absolute scale difference. CBA reported statutory net profit after tax of $5,410 million, with a net interest margin (NIM) of 2.04%. ANZ’s $3,780 million cash profit remains well below that level, which matters for dividend coverage capacity and capital generation over time.
| Bank | Cash Profit Growth (YoY) | Interim Dividend | Key Metric |
|---|---|---|---|
| ANZ | 17% | 83 cps (75% franked) | Cost-to-income: 49.4% |
| CBA | 5% | — | NIM: 2.04% |
| NAB | 6.4% | 85 cps | Cash earnings growth |
The analyst consensus price target for ANZ sits at $36.20 (average from 14 analysts), implying approximately 1%-3% upside from the current price near $34.48-$35.14. The target range spans $24.96 to $41.50, with Macquarie at $37.50 and UBS at $36.00.
That wide dispersion, from eight hold ratings to six buy or strong buy and two sell or strong sell, signals genuine valuation uncertainty rather than a settled consensus. ANZ’s H1 shareholder return of 10.7% and year-on-year share price gain of approximately 18%-21% versus May 2025 provide additional context: the stock has already repriced meaningfully over the past twelve months.
ANZ increased collective provisions by $175 million in H1, attributing the charge to geopolitical risks and what management described as an increasingly complex global environment. The provision is not tied exclusively to any single region; it reflects a broad-based uplift in the bank’s risk buffer.
The $175 million increase sits on the balance sheet as a quantified acknowledgement of elevated uncertainty. Alongside it, credit quality indicators remained reassuring: loan losses stayed low and no material increase in hardship cases was reported across households or businesses in H1. That combination, higher provisions alongside benign credit metrics, suggests management is building buffers ahead of potential deterioration rather than responding to losses already materialising.
Whether that buffer proves sufficient depends on the second-half trajectory. The RBA’s 25 basis point hike on 5 May 2026, lifting the cash rate to 4.35%, creates a dual-edged dynamic: higher rates can support net interest margins but simultaneously intensify deposit competition, increase funding costs, and place pressure on borrowers.
The RBA tightening cycle now stands at three consecutive 25 basis point hikes from a starting point of 3.85% in January 2026, with futures markets pricing one further move by December, a trajectory that creates compounding pressure on borrower repayment capacity across ANZ’s mortgage and business lending books.
The inflation trajectory heading into the May RBA decision was already unusually sharp: headline CPI reached 4.6% in March 2026 against the RBA’s 2-3% target band, with trimmed mean at 3.3% suggesting the acceleration was not entirely attributable to volatile energy components.
Four risk areas remain unquantified and require monitoring through 2H FY2026:
A 70% profit jump and strong cost discipline do not eliminate these downside scenarios. Understanding where specific pressure points sit allows shareholders to monitor the right indicators rather than react to headline volatility.
The share price decline of approximately 3.5% over the past week, from around $36.40 to the $34.48-$35.14 range, looks different when placed against the 18%-21% year-on-year gain versus May 2025. Short-term weakness following a strong result is not uncommon among Australian bank stocks, particularly when the broader sector faces rate uncertainty.
Three structural positives from the H1 result support a patient holding thesis:
Two forward indicators will determine whether the H1 result marks a genuine inflection or a one-off reset:
The analyst consensus target of $36.20 implies limited near-term upside but no material overvaluation either. CommSec’s FY2027 dividend forecast of $1.72 per share provides the income growth anchor. The evidence does not point to a clear directional trade; it points to a stock where the next six months of operational execution will either confirm the turnaround or reveal its limits.
Investors who want to stress-test the FY2028-2029 growth assumptions behind ANZ’s current valuation will find our deep-dive into ANZ’s 2030 transformation framework useful; it examines the September 2026 cost-savings deadline, the Suncorp synergy timeline, and the unconfirmed ANZ Plus adoption figures that represent the largest data gaps in the long-term investment case.
This article is for informational purposes only and should not be considered financial advice. Investors should conduct their own research and consult with financial professionals before making investment decisions. Past performance does not guarantee future results. Financial projections are subject to market conditions and various risk factors.
The cost-to-income ratio measures how many cents a bank spends to earn each dollar of revenue. ANZ improved this metric from 65.5% to 49.4% in H1 FY2026, signalling that profit growth was driven by cost discipline rather than revenue tailwinds, which matters for the durability of earnings.
ANZ declared an interim dividend of 83 cents per share, franked at 75%, payable in July 2026. At a share price near $35.14, this implies an annualised forward yield of approximately 4.7%-4.8%, with CommSec forecasting a full-year FY2026 dividend of $1.68 per share.
The ANZ share price declined approximately 3.5% in the week following results, a pattern not uncommon among Australian bank stocks when the broader sector faces rate uncertainty. Despite the short-term dip, ANZ's share price remains roughly 18%-21% higher than it was in May 2025.
ANZ's 17% year-on-year cash profit growth outpaced CBA's 5% and NAB's 6.4%, making it the strongest relative growth result among the Big Four banks that had reported as of mid-May 2026. In absolute terms, however, CBA's statutory net profit of $5,410 million remains well above ANZ's $3,780 million cash profit.
Key risks include net interest margin compression from rising deposit competition and funding costs, potential credit quality deterioration if unemployment rises, housing market stress in rate-sensitive segments, and possible regulatory capital requirement changes, all set against a backdrop of the RBA cash rate rising to 4.35%.