How to Value WHSP Using Dividend Yield and Franking Credits
2 hrs ago

Bendigo and Adelaide Bank (ASX: BEN) shares trade at roughly $10.45 today, yet two foundational valuation models place their fair value somewhere between $13.32 and $15.40 or higher. That gap is not a rounding error. It is precisely the kind of discrepancy these models are designed to surface.
Australian retail investors have long gravitated toward ASX bank stocks for dividends and franking credits, but “it pays a good dividend” is not a valuation thesis. With the Australian banking sector currently trading at a Price-to-Earnings (PE) multiple of around 22x, and BEN sitting at roughly 12.1x, understanding why that discount exists and whether it is justified requires a structured analytical approach rather than intuition.
This guide walks through the two most accessible bank stock valuation methods, the PE ratio and the Dividend Discount Model (DDM), using BEN as a live, number-populated case study. By the end, readers will know how to apply each model step by step, how to interpret the outputs, and what qualitative factors must sit alongside any quantitative estimate before drawing a conclusion.
Most investors start with the same mental model for valuing any listed company: find the earnings, assess the cash flow, calculate an enterprise value. That approach breaks down with banks. The reason is structural, not technical, and it matters before a single number enters the picture.
Banks borrow money to lend money. Debt is not a financing decision layered on top of the business; it is the business itself. This makes metrics designed for industrial companies, such as EV/EBITDA or free cash flow yield, poorly suited to bank analysis because they require adjustments to enterprise value and operating cash flow that do not translate cleanly to a balance sheet where liabilities are raw materials.
Damodaran’s framework for valuing financial firms identifies debt as a raw material of the banking business rather than a financing overlay, which is precisely why enterprise value calculations require adjustments that do not translate cleanly to bank balance sheets and why equity-based methods such as the PE ratio and DDM are the preferred tools for the sector.
Three features of banks make specialist valuation tools necessary:
The PE ratio and DDM work for banks because they sit on top of earnings and dividends rather than requiring enterprise value adjustments. For Australian investors specifically, the DDM carries additional relevance because of the franking credit system.
Fully franked dividends allow eligible Australian shareholders to gross up the dividend value using franking credits, effectively increasing the total return from bank stocks beyond the cash payment alone. This feature makes DDM outputs for Australian bank stocks materially different from those in markets without imputation systems.
BEN’s FY25 dividend of 63 cents, 100% franked, and a TTM PE of approximately 12.1x at current prices provide the raw inputs for both methods. The next two sections apply them.
The PE ratio is the most direct comparison tool available. It divides the current share price by annual earnings per share, producing a multiple that tells an investor how many dollars the market is paying for each dollar of earnings. A lower PE relative to peers can signal undervaluation, but it can also signal structural reasons the market applies a discount.
The PE ratio method for bank shares requires one additional step that general PE analysis does not: deciding whether to benchmark against the current sector multiple or the multi-year average, because the two can diverge significantly during periods of sector re-rating, as the current 22x versus 17.6x three-year average gap for Australian banks illustrates.
Applying the method to BEN involves three steps:
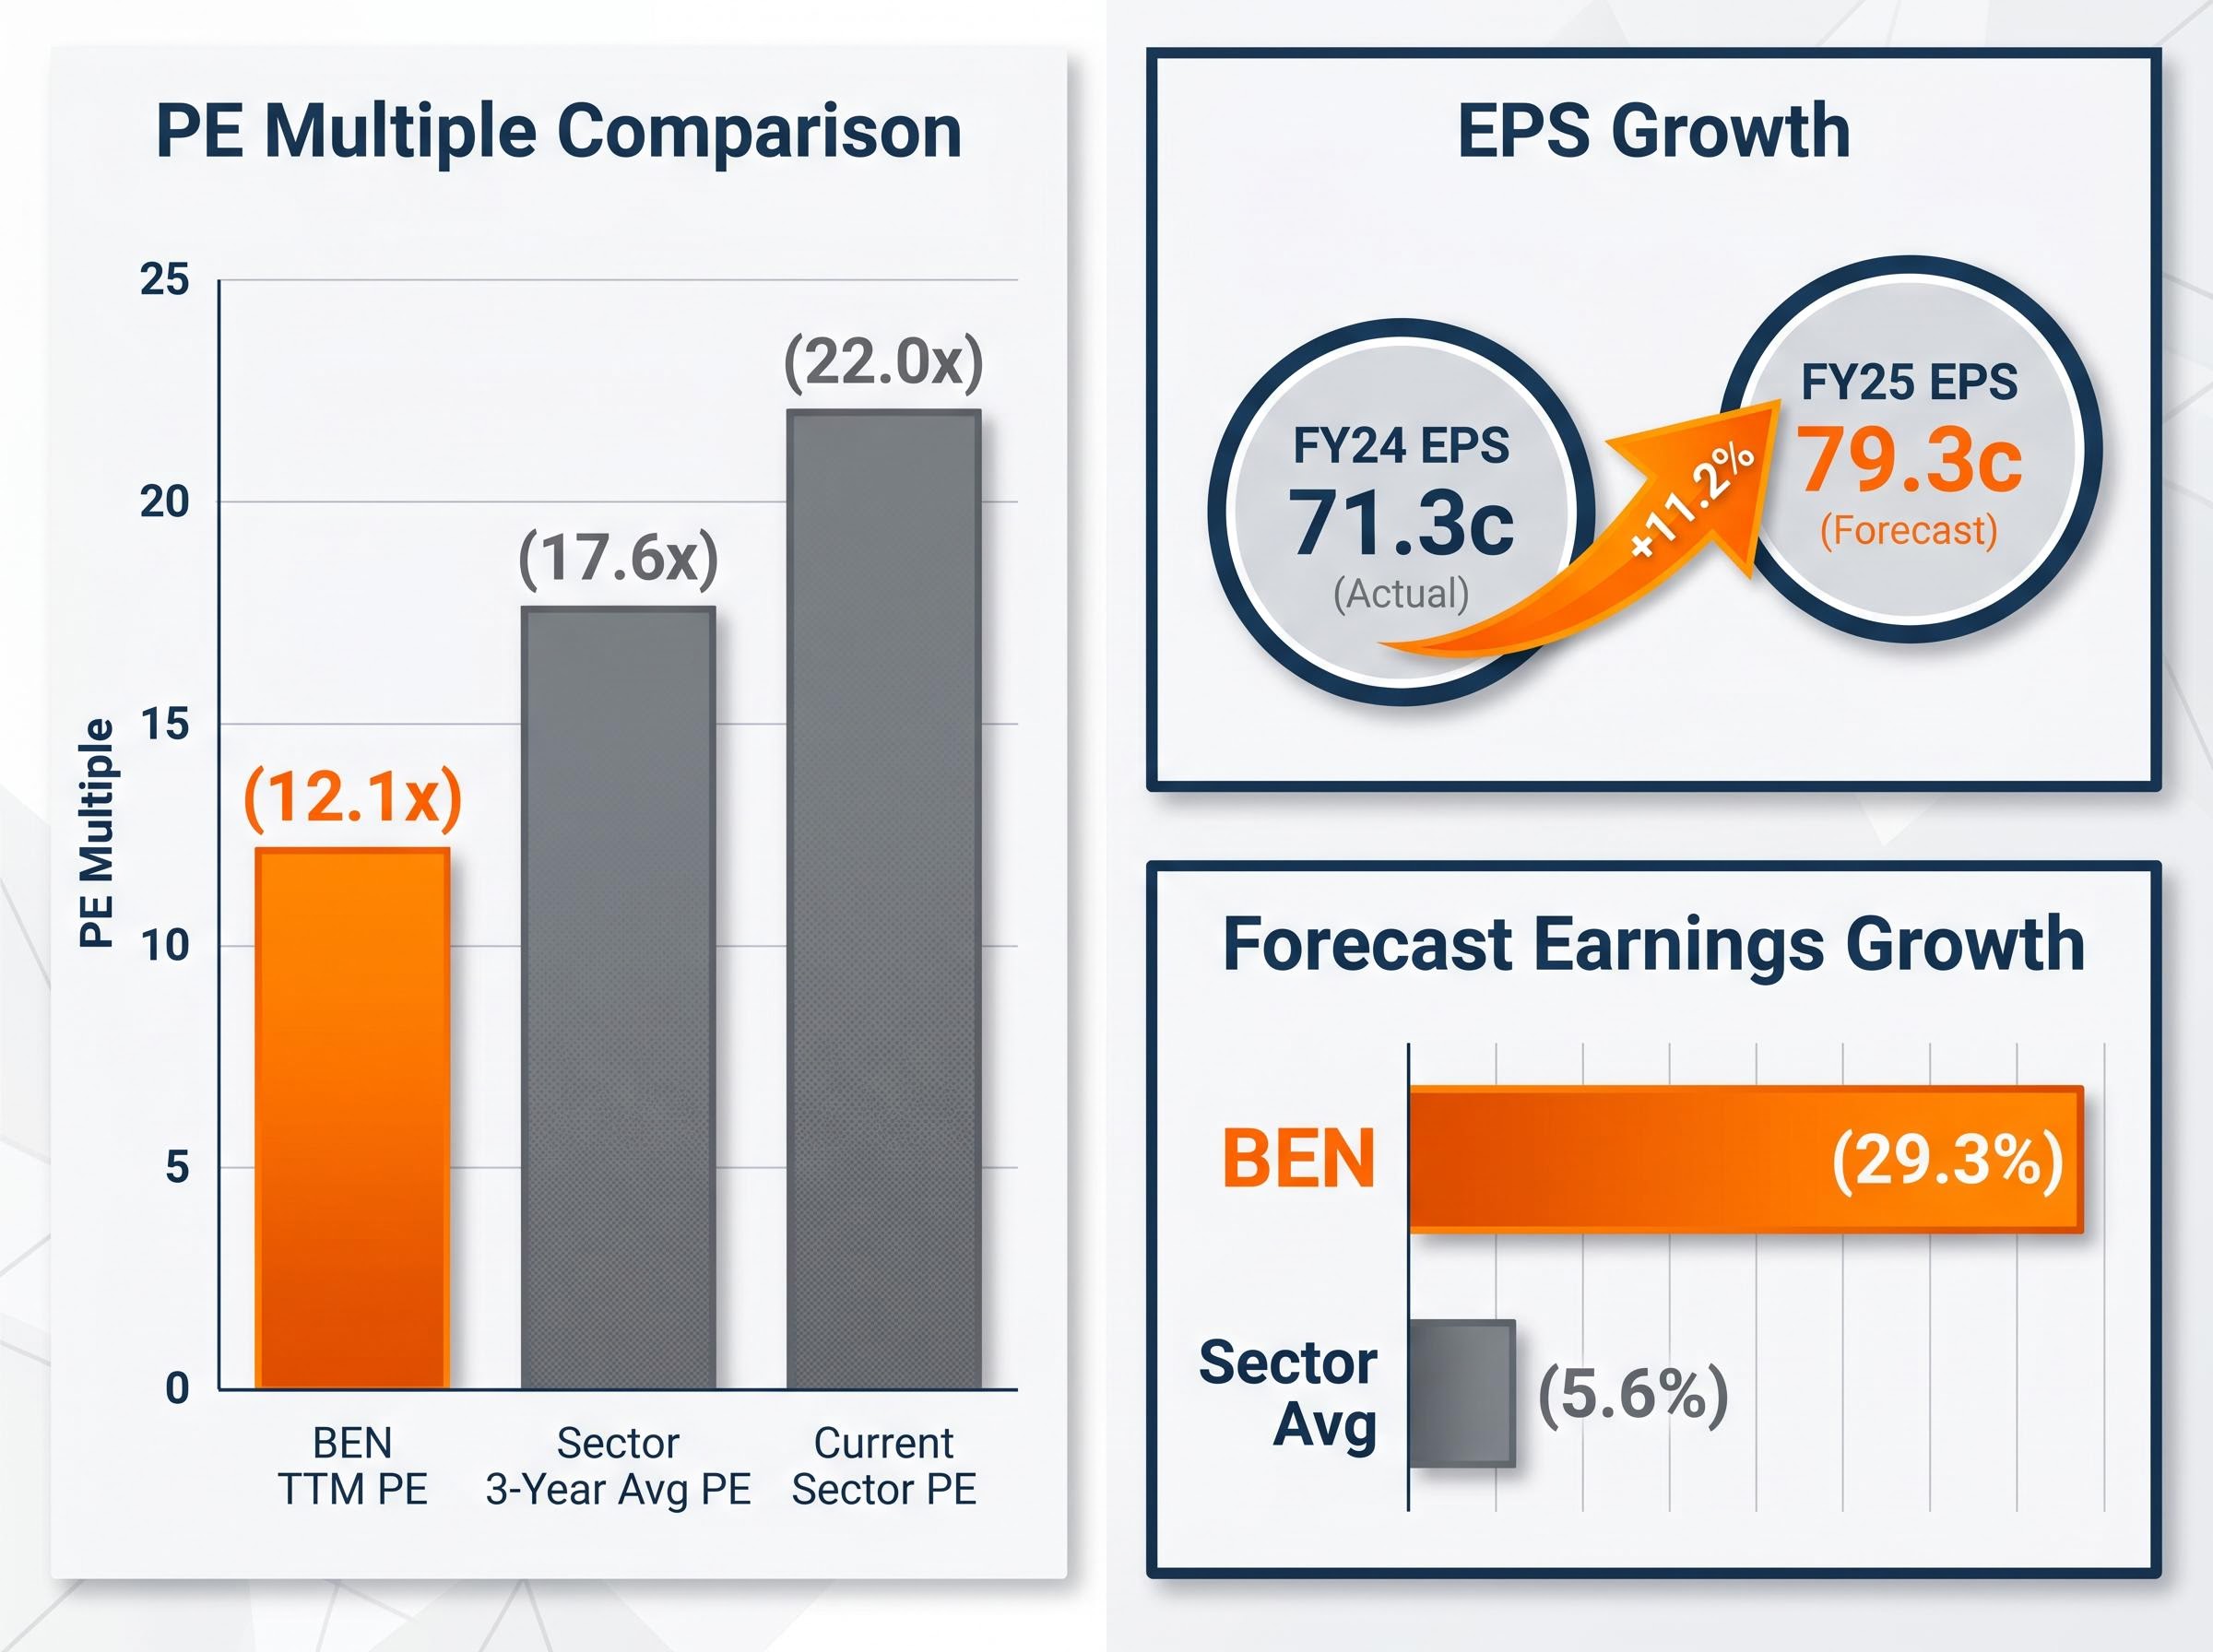
The arithmetic tells a clear story. At a current share price of approximately $10.45-$10.73, BEN trades on a TTM PE of roughly 12.1x. That is a discount of approximately 31% to the three-year sector average and approximately 45% to the current sector PE.
| Benchmark | PE Multiple | Implied Fair Value (FY25 EPS: 79.3c) |
|---|---|---|
| BEN TTM PE | ~12.1x | $10.45-$10.73 (current price) |
| Sector 3-Year Average PE | ~17.6x | ~$13.96 |
| Current Sector PE | ~22.0x | ~$17.45 |
The 3-year sector average produces an implied fair value in the range of approximately $13.50-$14.00. The current sector PE suggests a theoretical value materially higher, though that would assume BEN deserves full sector parity.
It does not, and the reasons are specific. BEN’s FY25 Return on Equity (ROE) sits at 6.7%, compared with 13-15% or higher for major banks such as Commonwealth Bank and peers. Lower ROE means the market is paying less per dollar of earnings because each dollar generates less return on the capital deployed to produce it. BEN’s regional market positioning, smaller scale, and lower institutional coverage compound the discount.
The PE gap is real, but it is not automatically a buy signal. It is a question: how much of the discount is structural, and how much reflects temporary mispricing?
The DDM begins with a single intuition: a share is worth the sum of its future income, discounted to today’s dollars. For a bank with a stable dividend history, this framework converts income expectations directly into a price estimate.
DDM Formula: Value = D / (r – g), where D is the annual dividend, r is the required return (discount rate), and g is the expected long-term dividend growth rate.
BEN paid a FY25 dividend of 63 cents per share, 100% franked, with a payout ratio of 79%. Using this dividend as the input, the DDM produces a range of outputs depending on the assumptions fed into the discount rate and growth rate.
The scenario table below illustrates why the range of outputs is the real insight, not any single estimate.
| Discount Rate (r) | Dividend Growth Rate (g) | Implied Value |
|---|---|---|
| 6% | 2% | $16.25 |
| 7% | 3% | $16.25 |
| 8% | 4% | $16.25 |
| 11% | 2% | $7.22 |
A conservative DDM analysis, blending multiple scenarios, produces a valuation of approximately $13.32, according to Rask Media’s April 2026 methodology. The pessimistic end of the range sits at $7.22, while the optimistic end, using grossed-up dividend inputs, reaches $19.64.
The DDM is particularly well-suited to banks because dividend streams tend to be more predictable than for companies with lumpy or cyclical earnings. However, that predictability assumption itself carries risk. A sharp deterioration in credit quality or a regulatory intervention in capital requirements can force dividend cuts that the model does not anticipate.
The DDM for income stocks works because dividends from banks, REITs, and utilities tend to be structurally more predictable than earnings from cyclical industrials, making the present-value arithmetic more defensible than it would be for a company with lumpy or growth-reinvestment-driven cash flows.
For eligible Australian shareholders, the cash dividend of 63 cents does not represent the total return. Fully franked dividends attach a tax credit equal to the corporate tax already paid on the earnings used to fund the distribution.
The gross-up calculation is straightforward. At the 30% corporate tax rate, 63 cents in cash translates to a gross dividend of approximately 93 cents (63 cents divided by 0.70). This grossed-up figure, when used as the DDM input, produces materially higher implied values.
The ATO franking credit imputation rules establish the gross-up calculation framework that determines how corporate tax paid on dividends flows through to shareholders as a refundable credit, with superannuation funds in accumulation phase taxed at 15% receiving the largest effective benefit relative to the cash dividend received.
A more optimistic DDM using the 93 cent gross dividend as the input generates a valuation of approximately $19.64. The relevance of this adjustment varies by investor tax position. Superannuation funds taxed at 15% benefit most from franking credits. Zero-tax-rate entities, such as pension-phase super funds, can receive the full credit as a cash refund.
For income-focused Australian investors, the franking credit adjustment captures the full after-tax return available, and ignoring it produces a systematically lower valuation than the investment actually offers to eligible holders.
Both methods converge on a similar conclusion. The PE-based implied fair value of approximately $13.50-$14.00 and the conservative DDM estimate of $13.32 sit materially above BEN’s current trading range of $10.45-$10.73. That is a potential 25-35% premium to the market price.
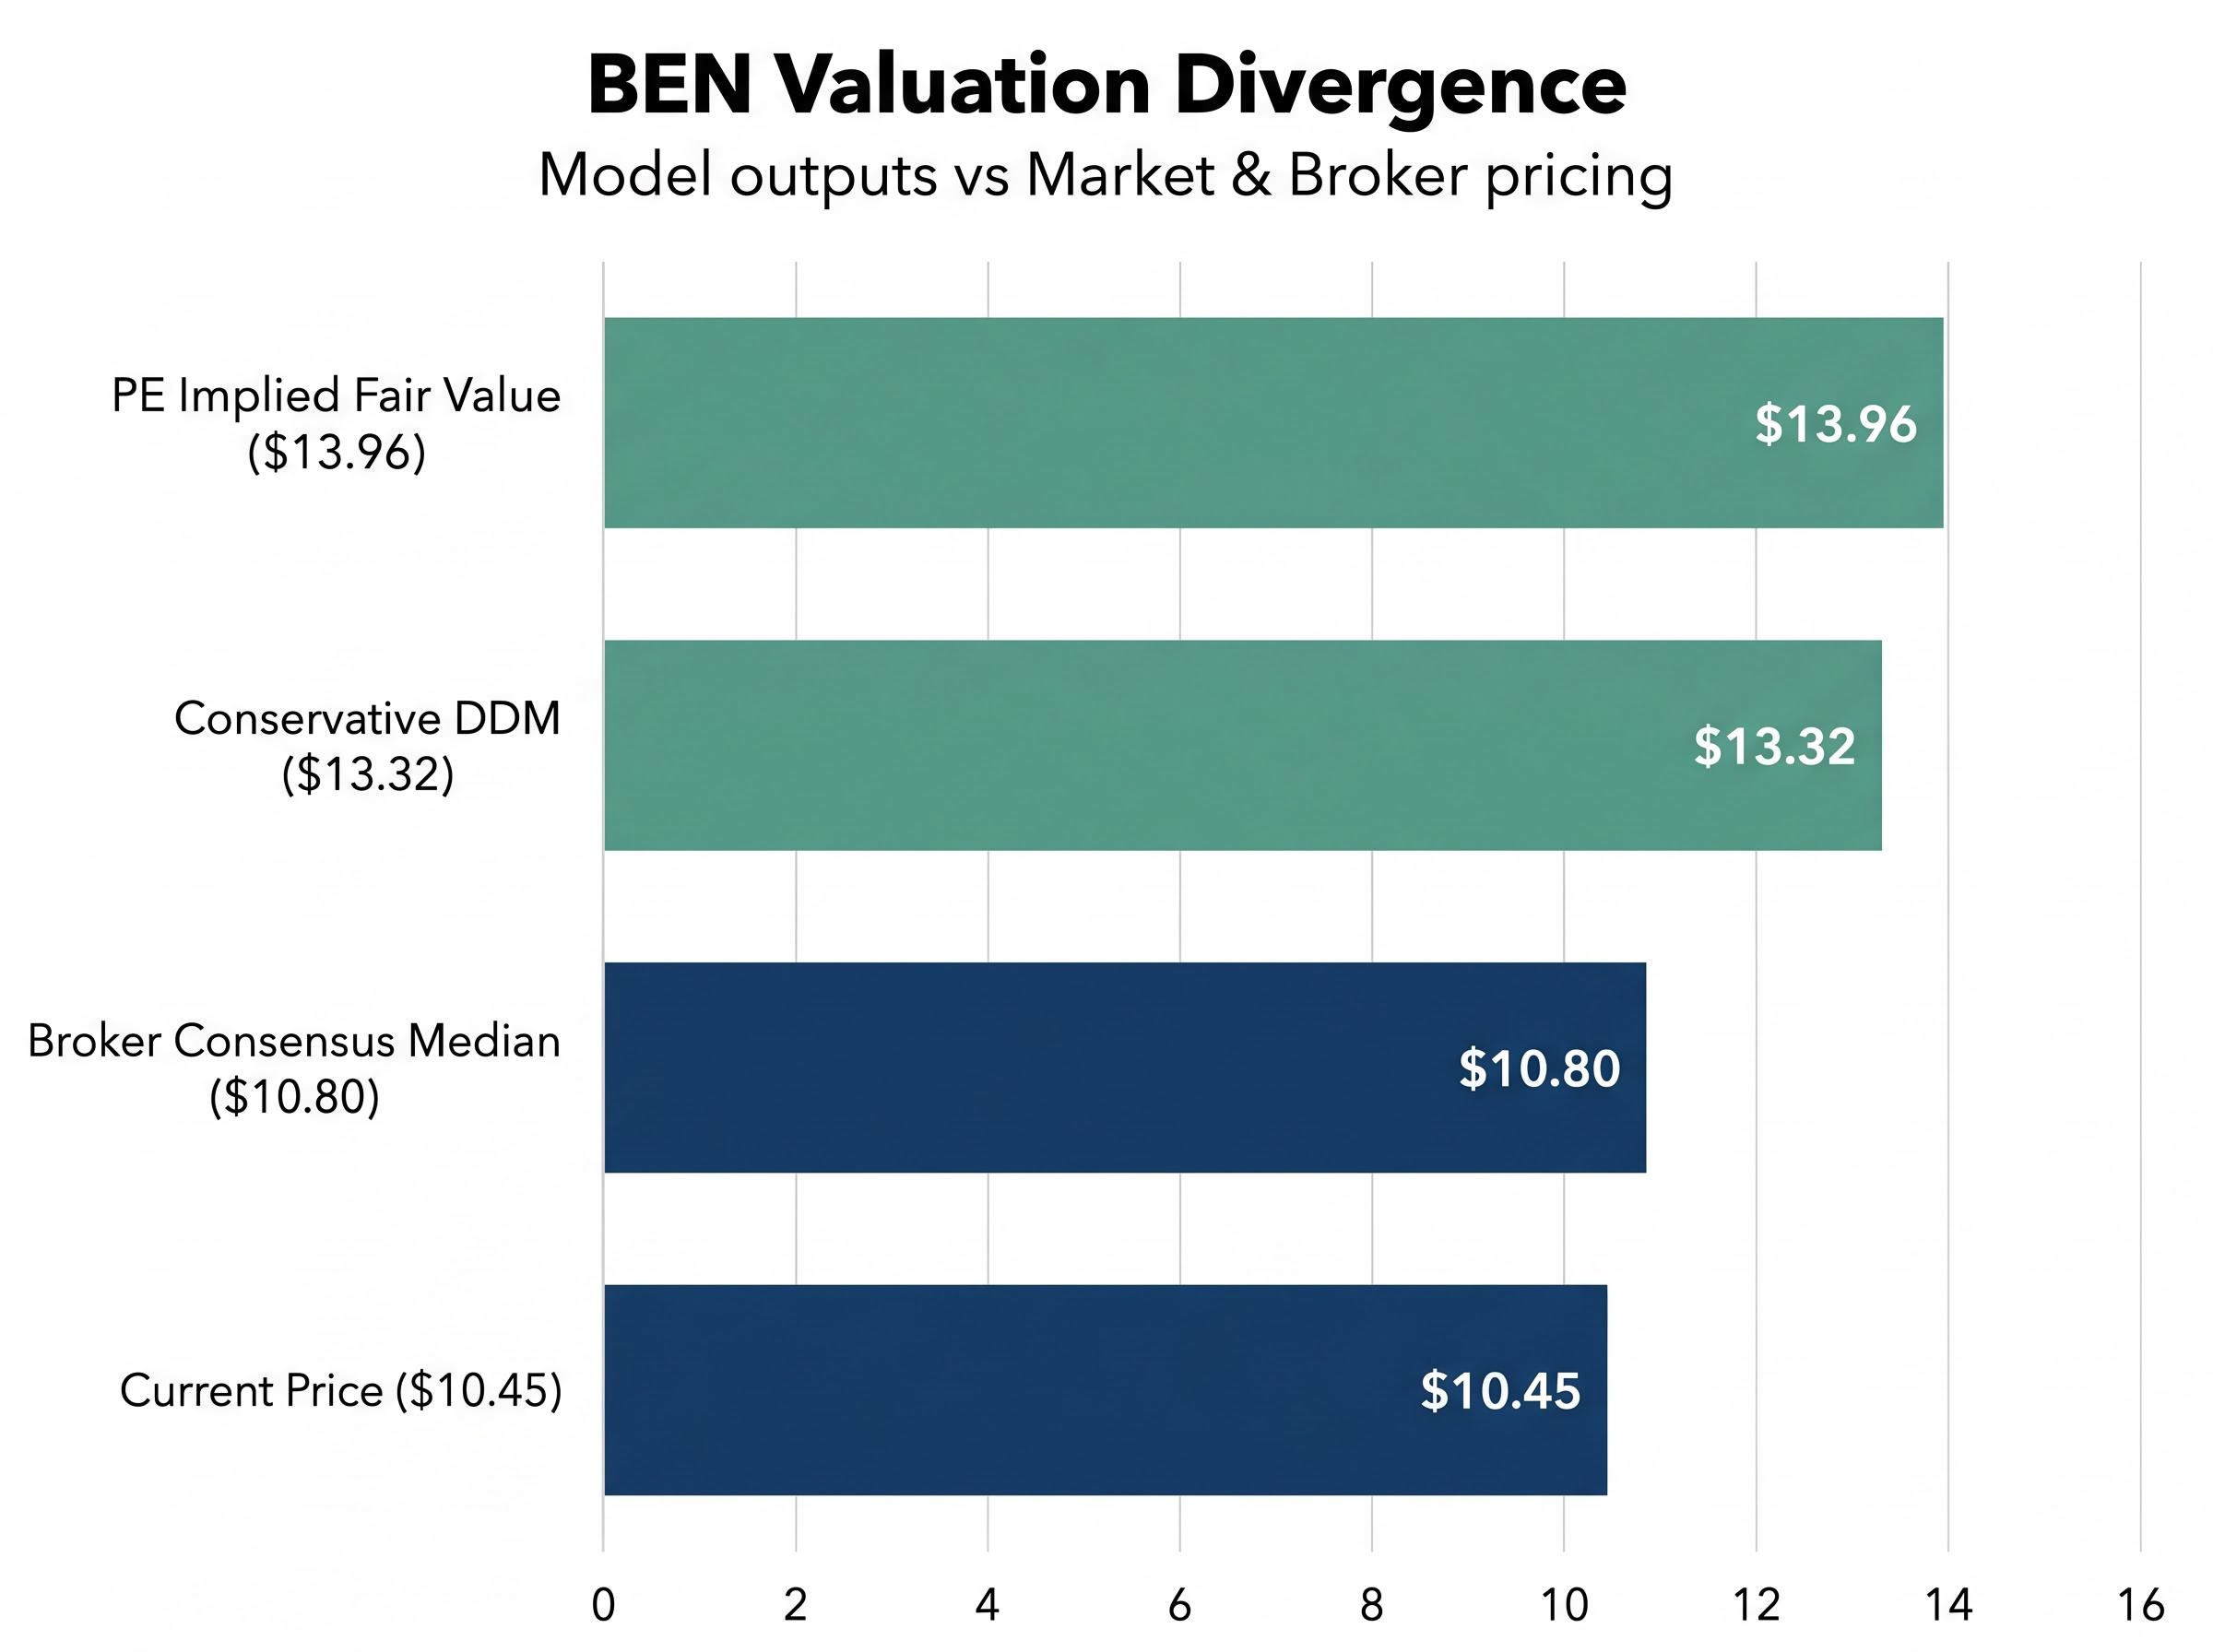
The broker community sees it differently. The consensus analyst price target range, as of February 2026, sits at $9.50-$12.00, with a median of approximately $10.80, according to Koala Gains aggregated data. Koala Gains’ own fair value assessment placed BEN’s range at $9.75-$11.00 when the stock traded at $11.65 in February 2026.
The divergence is instructive.
| Method / Source | Implied Fair Value | Key Assumption |
|---|---|---|
| PE (3-Year Sector Average) | ~$13.50-$14.00 | BEN deserves sector-average PE multiple |
| Conservative DDM | ~$13.32 | Blended discount/growth scenarios |
| Optimistic DDM (Gross Dividend) | ~$19.64 | Uses franking-grossed-up dividend |
| Broker Consensus (Feb 2026) | $9.50-$12.00 | Company-specific structural discount priced in |
| Koala Gains Fair Value | $9.75-$11.00 | Independent assessment at $11.65 share price |
Models using sector-average multiples or smoothed DDM assumptions do not automatically price in company-specific structural discounts. BEN’s lower ROE of 6.7%, its regional market positioning, and lower institutional coverage are real factors that brokers incorporate and simplified models do not. BEN also trades at a Price-to-Tangible Book Value (P/TBV) of approximately 0.89x-0.91x, below its book value of $11.80 per share, which reinforces that the market is applying a specific discount to BEN’s asset base.
One variable could close the gap. Simply Wall St forecasts 29.3% earnings growth for BEN, compared with 5.6% for the sector average. If that materialises, BEN’s PE would compress further and support re-rating toward model-implied values. If it does not, broker targets may prove the more accurate guide.
Quantitative models assume their inputs remain stable or grow predictably. Banks are exposed to credit cycle risk that can disrupt both earnings and dividends sharply and quickly, and that risk does not appear in a PE ratio or DDM formula until it has already affected the numbers.
Big Four impaired loans climbed 15.4% to $9.6 billion in the first half of FY26, a figure that illustrates precisely what valuation models miss: credit cycle deterioration moves faster than the earnings figures embedded in PE ratios and DDM inputs, and by the time rising provisions appear in reported EPS, the balance sheet stress has typically been accumulating for several reporting periods.
Four qualitative areas deserve examination before acting on any model output:
BEN’s Return on Assets (ROA) has remained stable at 0.4% across FY24 and FY25, providing an indirect signal of broadly stable credit quality. This stability does not substitute for examining net interest margin trends and NPL ratios directly from BEN’s annual report or investor presentations.
Several material data gaps exist in this analysis. NIM trend data, NPL ratios, CET1 capital ratios, and post-FY25 ASX announcements are not captured in the current research and should be sourced before drawing investment conclusions.
Recommended sources for resolving these gaps: ASX announcements platform (BEN filings), BEN FY25 Annual Report and investor presentations, APRA website for regulatory capital data, and peer comparison tools such as Intelligent Investor or Simply Wall St.
The PE and DDM methods both produce fair value estimates for BEN in the $13-$14 range under conservative assumptions, representing a potential 25-35% premium to current trading prices of approximately $10.45-$10.73. Broker consensus and qualitative structural discounts suggest this gap may be at least partially justified.
The DDM scenario table showed outputs ranging from $7.22 to $19.64. That spread is not a weakness of the model. It is the honest range of uncertainty embedded in any forward-looking dividend or earnings estimate. BEN’s FY25 shareholder total return of 16.3% demonstrates that capital appreciation and dividend income can compound meaningfully, and the forward earnings growth forecast of 29.3% is the variable most likely to close the gap between model and market valuations if it materialises.
The recommended process for valuing any ASX bank stock follows four sequential steps:
No single number from any model constitutes a price target. The value of these tools lies in forcing explicit assumptions, generating a range of scenarios, and identifying where the market’s pricing diverges from the investor’s own analysis.
Investors wanting to stress-test the discount rate and growth rate inputs used in the DDM scenarios above will find our deep-dive into macro assumptions for ASX bank valuations walks through how different RBA rate trajectories, employment assumptions, and property price scenarios produce valuation ranges from $19.00 to $85.50 for a single bank stock, using NAB as a live worked example.
This article is for informational purposes only and should not be considered financial advice. Investors should conduct their own research and consult with financial professionals before making investment decisions. Past performance does not guarantee future results. Financial projections are subject to market conditions and various risk factors.
The Dividend Discount Model (DDM) values a share by calculating the present value of all expected future dividends using the formula: Value = D / (r - g), where D is the annual dividend, r is the required return, and g is the long-term dividend growth rate. It is particularly suited to bank stocks because their dividend streams tend to be more predictable than earnings from cyclical industries.
Banks borrow money to lend money, meaning debt is a raw material of the business rather than a financing decision, which makes enterprise value metrics like EV/EBITDA and free cash flow yield unreliable for bank analysis. Equity-based methods such as the PE ratio and DDM sit directly on top of earnings and dividends, avoiding the need for adjustments that do not translate cleanly to bank balance sheets.
Fully franked dividends attach a tax credit equal to corporate tax already paid, which eligible Australian shareholders can use to offset their own tax liability. For Bendigo and Adelaide Bank, grossing up the 63 cent cash dividend at the 30% corporate tax rate produces a gross dividend of approximately 93 cents, and using this figure as the DDM input increases the implied valuation from around $13.32 to approximately $19.64.
Investors should assess loan book growth trajectory, non-performing loan provisions, funding composition (retail deposits versus wholesale debt), and capital adequacy ratios relative to APRA requirements. These factors capture credit cycle risk that does not appear in a PE ratio or DDM formula until it has already affected reported earnings.
BEN's FY25 Return on Equity of 6.7% is materially lower than the 13-15% or higher achieved by major banks such as Commonwealth Bank, which leads the market to apply a lower earnings multiple. BEN's regional market positioning, smaller scale, and lower institutional coverage further compound the discount relative to the current sector PE of approximately 22x.