S&P 500 at 8,000: the Narrow Path HSBC Has Mapped Out
6 mins ago

The S&P 500 sits at approximately 7,137.90. Brent crude is above $104 a barrel. The Strait of Hormuz has been effectively closed for more than two months, choking roughly one-fifth of global oil supply. By most historical precedent, those three facts should not coexist with a sixth consecutive week of equity gains and fresh all-time highs on both the S&P 500 and Nasdaq. Yet here they are. The U.S.-Iran conflict entered its third month in May 2026 after the Trump administration rejected Tehran’s ceasefire counterproposal within hours of its submission. Oil is at levels not seen in years. And Wall Street’s response has been to raise targets, not lower them. Goldman Sachs, Morgan Stanley, and JPMorgan all point to earnings fundamentals as the dominant variable. This analysis unpacks the specific forces holding the bull market together, the risks that could unravel it, and what the next 48 hours of catalysts, from the April CPI print to the Trump-Xi summit to Nvidia’s earnings, could mean for the weeks ahead. The goal is a concrete framework for evaluating this rally rather than a vague sense of optimism or anxiety.
The paradox is real but overstated. Six consecutive weeks of gains, both the S&P 500 and the Nasdaq at all-time highs, running alongside a two-month Middle East conflict and Brent crude at $104.69 (up approximately 3.4% on 11 May following the collapse of peace talks) looks like cognitive dissonance. It is not.
The market is making a specific analytical bet: the Hormuz closure is a temporary supply shock, not a structural economic threat. That distinction explains why dip-buying behaviour has dominated every pullback since mid-March. Approximately one-fifth of global oil supply transits the strait under normal conditions, and the disruption is severe, but equities are pricing it as contained rather than contagious.
The Hormuz risk premium is not expected to snap back to pre-crisis levels even under a best-case diplomatic resolution; the IEA projects a two-year supply chain recovery timeline, commercial war-risk insurance has effectively withdrawn from the strait, and VLCC daily hire rates tracking around $110,000 per day represent a physical market signal that crude futures have not yet fully absorbed.
“The bullish case for equities remained too strong to resist.” , Pepperstone analyst commentary
Pepperstone’s analysts noted that near-term pullbacks are expected to attract buyers rather than signal broader deterioration, positioning this dynamic as a structural market feature of the current cycle. The implicit thesis is not that the war does not matter. It is that the war matters less than the earnings engine on the other side of the ledger.
Whether that thesis holds depends on what happens this week.
The fundamental case for the rally is built on numbers, not narrative. Morgan Stanley reported an 84% earnings beat rate for the current season, a figure that has provided a mechanical buffer against geopolitical noise each time oil headlines have spiked.
The hyperscaler results tell the more specific story. Microsoft reported Q3 FY2026 total revenue of $82.9 billion, with Azure AI growth of 60% year-on-year. Full-year guidance was raised 5%. Alphabet posted Q1 2026 revenue of $109.9 billion (up 22% year-on-year), with Google Cloud surging 63% year-on-year to $20 billion. AMD beat estimates and raised full-year AI chip guidance.
Hyperscaler capex sustainability is the load-bearing assumption in the current earnings narrative: the four largest hyperscalers are projected to spend a combined $700-805 billion on AI infrastructure in 2026, and the structural demand that figure implies is what makes AMD’s 38% revenue growth and SMCI’s 123% surge analytically coherent rather than anomalous.
“AI infrastructure spend accelerating amid energy constraints.” , Satya Nadella, Chief Executive Officer, Microsoft
Nadella’s comment captures the counterintuitive dynamic at work: AI capital expenditure is not just surviving the energy cost environment, it is accelerating through it. That acceleration functions as an economic counter-shock to the oil disruption, absorbing investor attention and capital simultaneously.
The next data point arrives on 20 May, when Nvidia reports Q1 FY2027 earnings. Analyst consensus estimates revenue at approximately $44.1 billion, and the bullish hyperscaler capex commentary from Microsoft and Alphabet has reinforced expectations heading into the print.
| Company | Reported Quarter | Revenue | Key AI Metric | Guidance Action |
|---|---|---|---|---|
| Microsoft | Q3 FY2026 | $82.9B | Azure AI +60% YoY | Full-year raised 5% |
| Alphabet | Q1 2026 | $109.9B | Google Cloud +63% YoY to $20B | Continued AI monetisation |
| AMD | Q1 2026 | Beat estimates | AI chip guidance raised | Full-year raised |
| Nvidia (est.) | Q1 FY2027 | ~$44.1B | Data-centre AI GPU demand | Reports 20 May |
The phrase “priced in” appears in nearly every analyst note this cycle. What it means in practice is worth understanding precisely, because the market’s current valuation leaves little room for the assumptions behind it to be wrong.
The forward price-to-earnings ratio (forward P/E) measures what investors are paying today for each dollar of expected future earnings. It is calculated by dividing the current index price by analysts’ consensus earnings estimates for the next twelve months. A higher ratio means investors are paying more per dollar of expected profit, which implies greater confidence in future growth but also a thinner margin for disappointment.
JPMorgan noted that the S&P 500 is trading at 22x forward earnings, above the 10-year historical average. That premium implies specific assumptions: that the Hormuz disruption is temporary, that the Fed will eventually cut rates, and that AI earnings will sustain their trajectory. Any one of those assumptions breaking warrants re-evaluation.
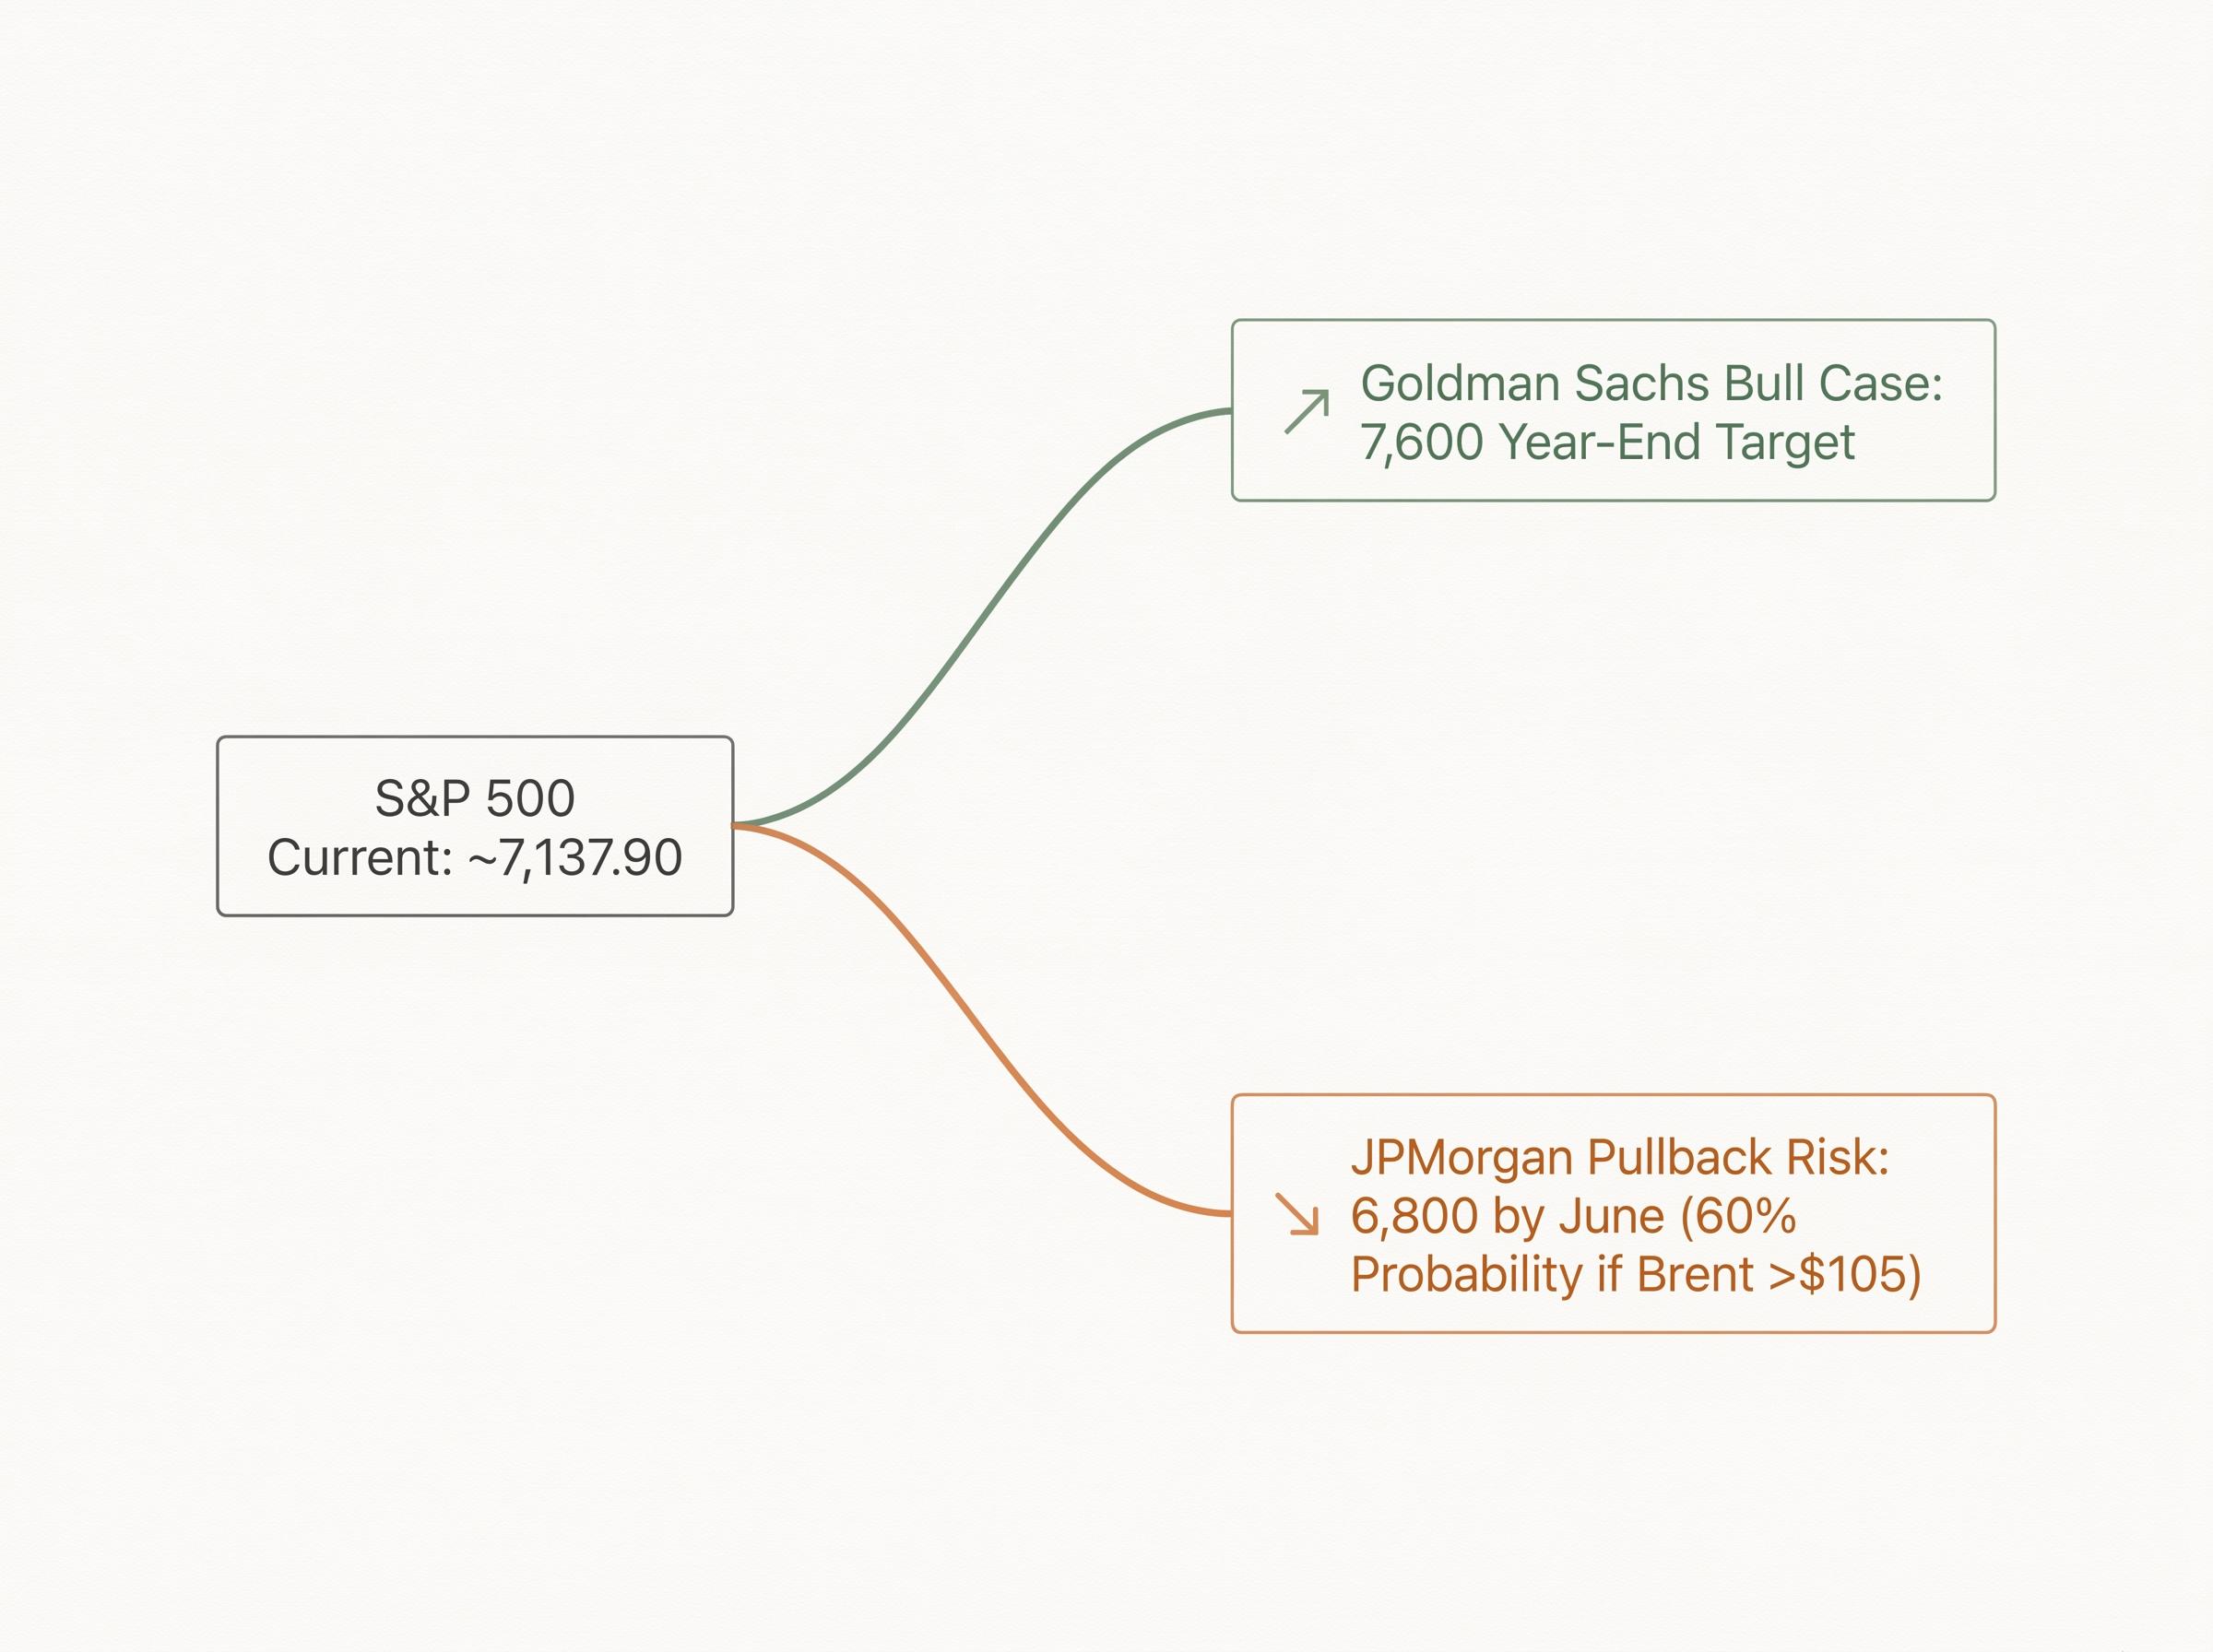
Two analyst scenarios illustrate the range:
Both can be correct simultaneously. Goldman is pricing a twelve-month horizon with de-escalation as the base case. JPMorgan is pricing a six-week horizon with oil persistence as the trigger. No bearish consensus has formed across May 2026 analyst desks, and that absence is itself a data point for how the professional community reads the current setup.
For investors wanting to stress-test the 22x forward earnings multiple against a broader set of frameworks, our deep-dive into current US equity valuation signals examines the Buffett Indicator at 223.6% (above dot-com bubble peaks), the equity earnings yield versus Treasury spread, and the specific positioning steps that follow from each signal.
Three events in the next nine days function as binary forks. Each one has a specific market implication, and understanding the if-then logic matters more than predicting the outcome.
Each catalyst carries the potential to shift the market’s calculus. None of them is priced as a certainty.
A common assumption is that retail euphoria is driving the rally. The data tells a more measured story.
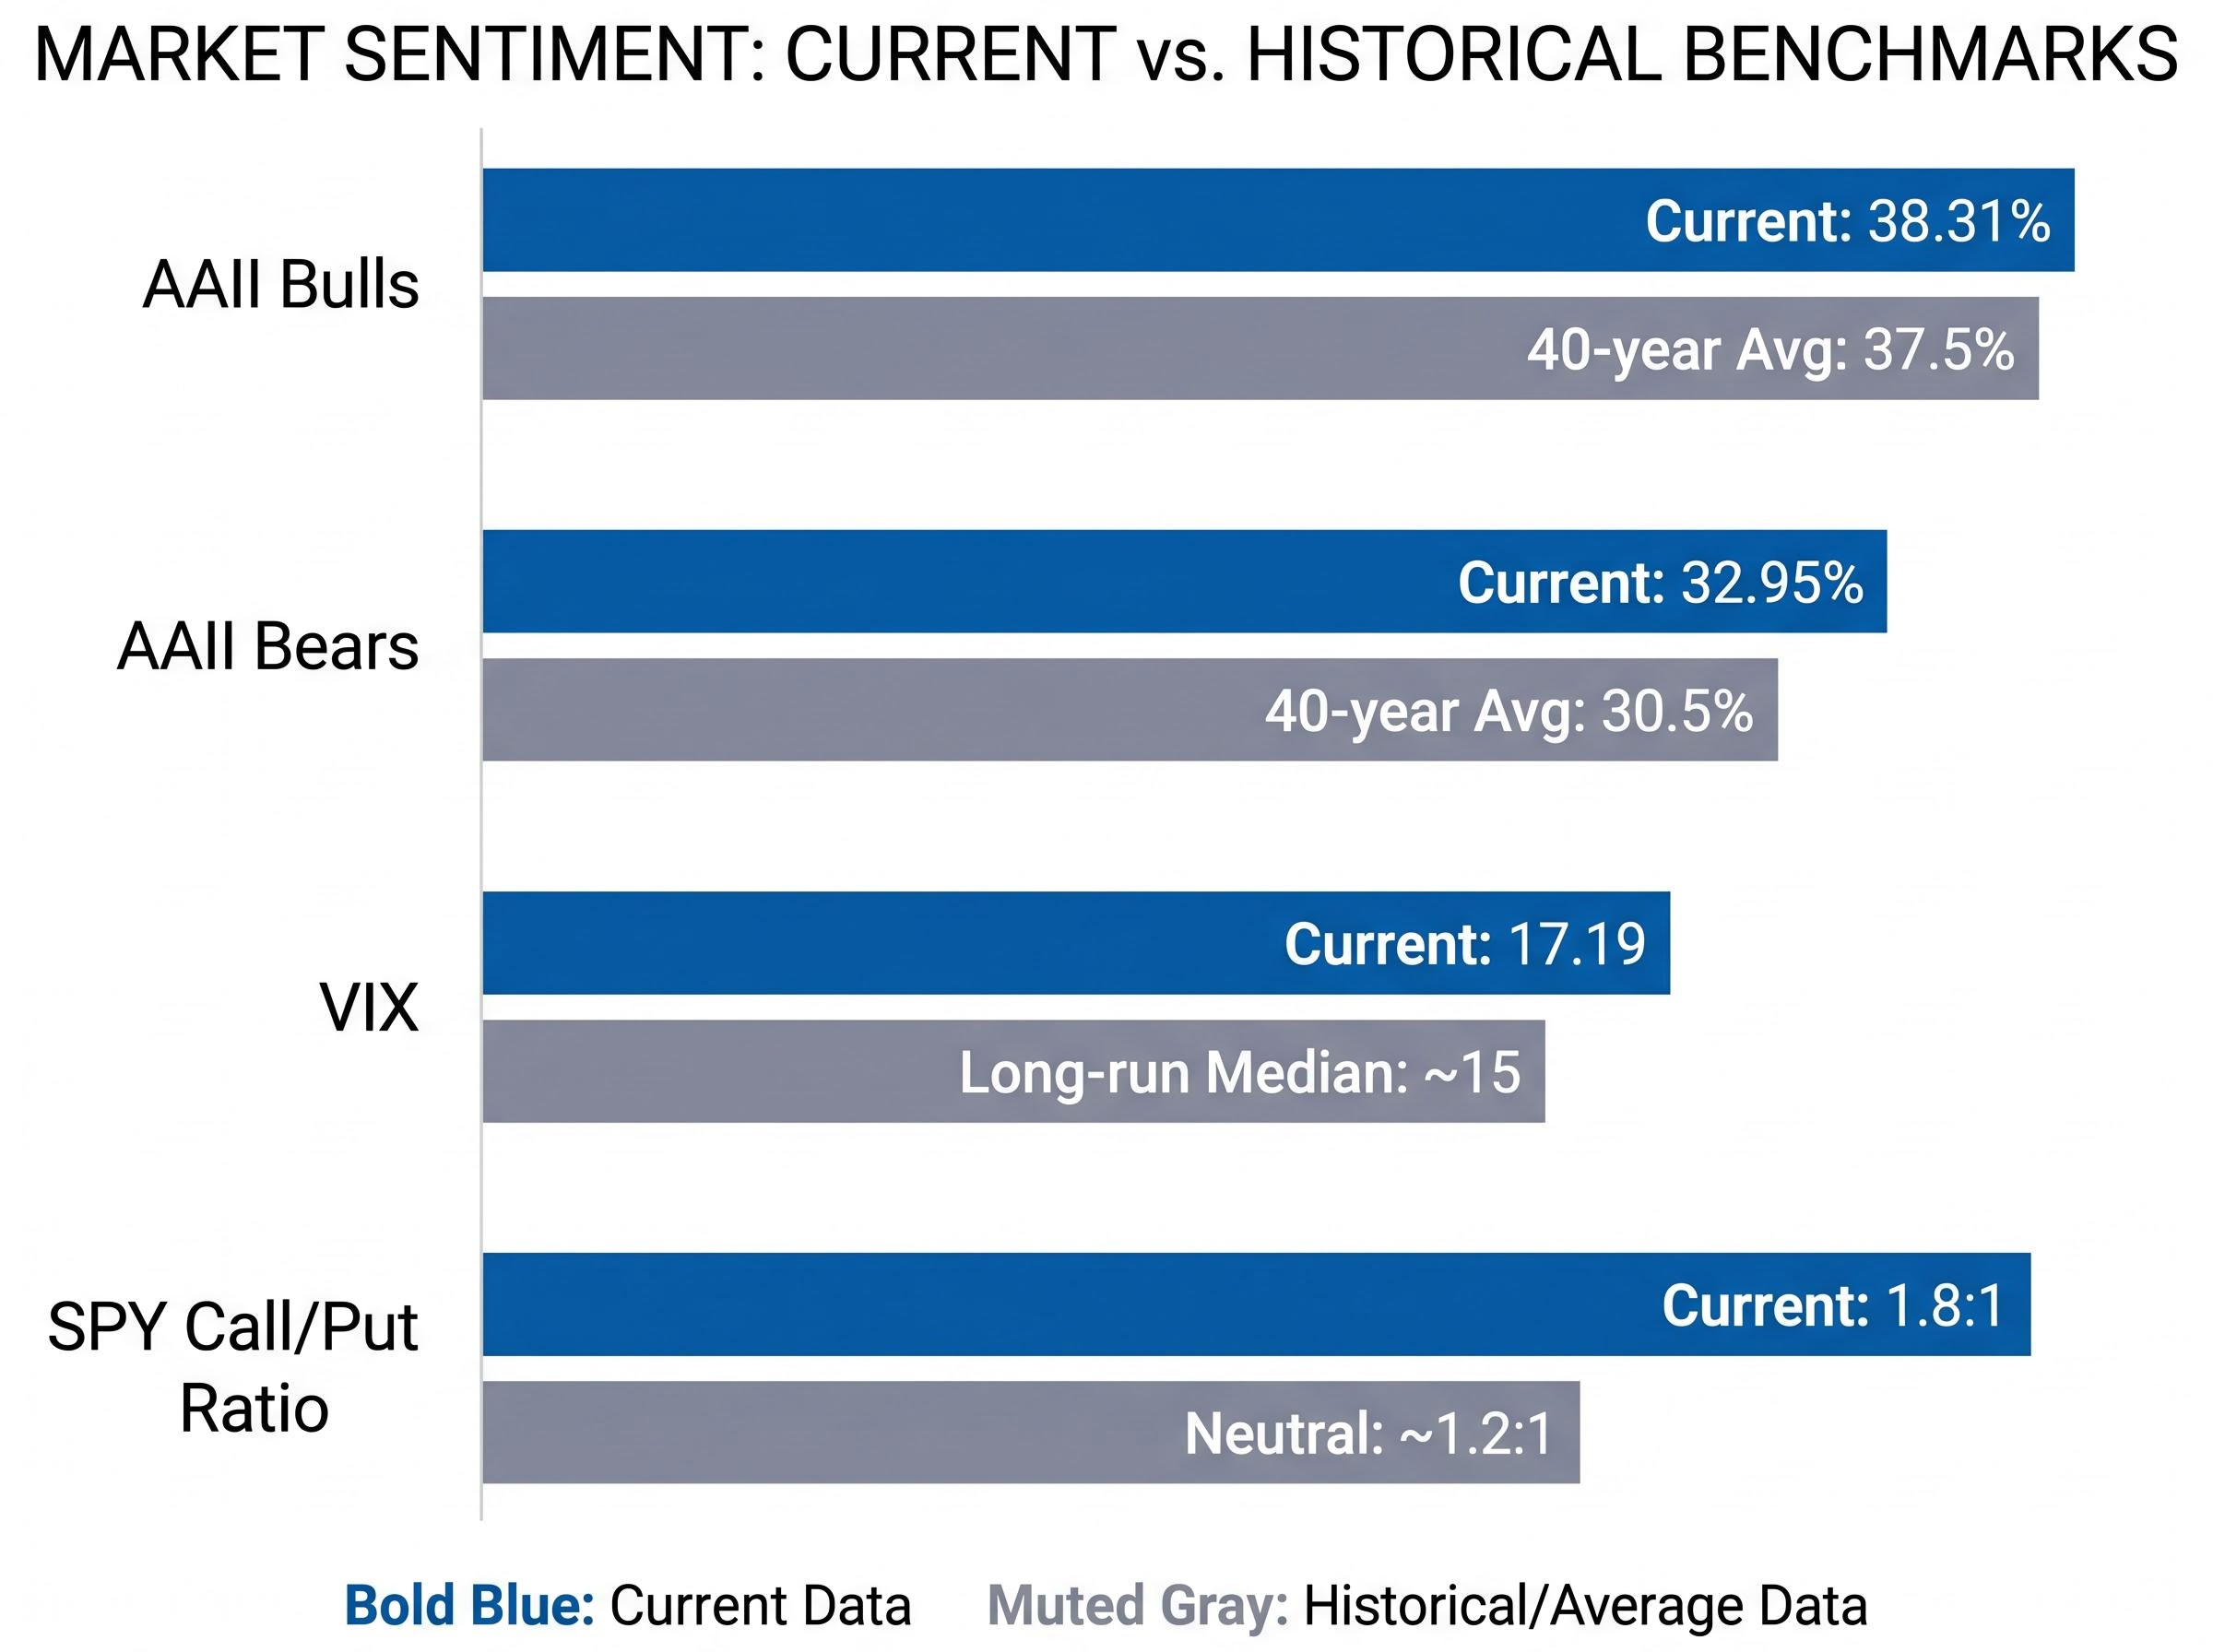
The AAII Sentiment Survey for the week ending 8 May 2026 showed bulls at 38.31% and bears at 32.95%, with neutral readings at 28.74%. The 40-year historical average for bullish sentiment is 37.5%. Current readings are roughly in line with that average, not at the extreme levels historically associated with market tops.
The AAII Sentiment Survey methodology defines bullish, neutral, and bearish readings against long-run historical averages of 37.5%, 31.5%, and 31.0% respectively, meaning the current 38.31% bullish reading sits almost precisely at the historical mean rather than at the elevated levels that have preceded prior cycle peaks.
The options market tells a somewhat different story. The SPY call/put ratio stood at 1.8:1 as of 10 May (CBOE data), reflecting a risk-on tilt with heavy call buying concentrated in Nvidia and Microsoft. Positioning is tilted bullish, but it is not at levels that signal capitulation into euphoria.
The VIX closed at 17.19 on 8 May, a reading consistent with elevated uncertainty rather than the low-volatility complacency that historically precedes sharp corrections. Geopolitical and inflation concerns are reflected in the number; panic is not.
“Resilient but vulnerable.” , Morgan Stanley characterisation of the current market
Global equity funds drew approximately $4.35 billion in inflows for the week of 2-8 May (EPFR Global data), while bond funds saw outflows. Morgan Stanley’s positioning reflects the institutional consensus: overweight tech and AI, underweight energy and consumer staples. Hedge funds have been noted shorting through VIX calls, a bet on volatility expanding from current levels.
| Indicator | Reading | Historical Average / Benchmark | What It Signals |
|---|---|---|---|
| AAII Bulls | 38.31% | 37.5% (40-year avg) | Near average; no euphoria |
| AAII Bears | 32.95% | 30.5% (40-year avg) | Slightly elevated caution |
| VIX | 17.19 | ~15 (long-run median) | Elevated uncertainty, not panic |
| SPY Call/Put Ratio | 1.8:1 | ~1.2:1 (neutral) | Risk-on tilt, not extreme |
The bull case is not faith. It is an 84% earnings beat rate, AI capital expenditure accelerating through an energy shock, institutional buying on every dip, and sentiment that is constructive without being euphoric. The fundamental support is real.
It is also conditional. Goldman Sachs’ 7,600 year-end target requires de-escalation or oil normalisation alongside continued AI earnings strength. JPMorgan’s 6,800 pullback scenario, assigned a 60% probability, requires Brent sustained above $105 through June. Oil at $104+ adds an estimated 0.5-1% to CPI per Morgan Stanley, which could delay Fed cuts further and tighten the margin for error at 22x forward earnings.
FOMC committee fractures are not a background variable in the current rate-cut calculus; the 8-4 dissenting vote, the largest bloc since 1992, reflects genuine disagreement about whether to cut or signal hikes, and Kevin Warsh’s imminent confirmation as Fed chair adds a leadership continuity risk that could further delay the rate path the current equity premium assumes.
The conditions for the rally to sustain:
The conditions that trigger the pullback scenario:
No bearish consensus has formed across May 2026 analyst desks. That matters. But the absence of a bearish consensus is not the same as the absence of risk.
What to watch: the CPI print tomorrow, the summit this week, Nvidia next week. What to tune out: the headline that oil is “at record highs” (it is not) and the claim that “everyone is bullish” (the AAII data says otherwise). The rally has a logic. The limit of that logic is knowable, and the next nine days will test it.
This article is for informational purposes only and should not be considered financial advice. Investors should conduct their own research and consult with financial professionals before making investment decisions. Past performance does not guarantee future results. Financial projections are subject to market conditions and various risk factors.
The forward price-to-earnings (P/E) ratio measures what investors pay today for each dollar of expected future earnings, calculated by dividing the current index price by consensus earnings estimates for the next twelve months. The S&P 500 is currently trading at 22x forward earnings, above its 10-year historical average, meaning there is limited room for the assumptions underpinning the rally to disappoint.
Markets are treating the Hormuz closure as a temporary supply shock rather than a structural economic threat, while an 84% earnings beat rate and surging AI capital expenditure from hyperscalers like Microsoft and Alphabet are providing a mechanical buffer against geopolitical headlines. The market's analytical bet is that the AI earnings engine outweighs the oil disruption on the fundamental ledger.
Three events function as binary forks for the market: the April CPI release on 12 May (consensus 3.7% year-on-year), the Trump-Xi summit in Beijing from 13-15 May which could produce a tariff truce or constructive Hormuz signalling, and Nvidia's Q1 FY2027 earnings report on 20 May where analyst consensus estimates revenue at approximately $44.1 billion.
The AAII Sentiment Survey for the week ending 8 May 2026 showed bulls at 38.31%, almost exactly in line with the 40-year historical average of 37.5%, indicating the market is near average sentiment levels rather than the extreme euphoria historically associated with cycle peaks. The VIX at 17.19 similarly reflects elevated uncertainty rather than complacency.
JPMorgan assigned a 60% probability to a pullback to 6,800 by June if Brent crude holds above $105 through June, with the risk that sustained oil prices erode consumer spending, a hot CPI print reinforces a delayed-to-December Fed rate-cut timeline, and the Trump-Xi summit disappoints on tariffs. Oil above $104 is estimated to add 0.5-1% to CPI per Morgan Stanley, tightening the margin for error at current valuations.