Why 30% Recession Odds Are Harder to Trade Than 60%
1 hr ago

Bank of Queensland shares closed at $6.34 on 8 May 2026, sitting roughly 27% below a dividend discount model (DDM) fair value range of $7.19 to $7.40. At the same time, the stock’s trailing price-to-earnings ratio of 43.81x sits nearly 20 points above the sector average. Both figures are accurate simultaneously, and reconciling them requires looking past headline earnings into the metrics that determine whether a bank’s profitability is durable or deteriorating.
As of May 2026, BOQ’s core profitability measures, specifically net interest margin (NIM), return on equity (ROE), and Common Equity Tier 1 capital ratio (CET1), fall below Big Four averages across every dimension. For investors comparing regional bank stocks on the ASX, this creates a specific analytical problem: the stock appears cheap on price-to-book (0.7x) and potentially undervalued on a normalised earnings basis, but operationally it is running below sector benchmarks on the metrics that most directly drive sustainable returns.
What follows is a metric-by-metric assessment of where BOQ sits relative to major peers, what each gap tells investors about structural versus cyclical risk, and how to use these three numbers as a repeatable framework for evaluating any ASX bank stock.
Bank profitability is an interlocking system, not a collection of standalone figures. Three metrics capture the full picture:
BOQ derives approximately 93% of its total revenue from lending income. That concentration makes NIM disproportionately important for this bank compared to more diversified peers with meaningful fee income from wealth management, institutional banking, or foreign exchange products.
The regulatory dimension matters too. The Australian Prudential Regulation Authority (APRA) sets an effective minimum CET1 for non-Domestically Systemically Important Banks (non-D-SIBs) at approximately 10.25%. BOQ’s non-D-SIB classification means it carries less implicit government support than the Big Four in a stress scenario, making capital headroom a sharper constraint.
Investors who rely on headline earnings or dividend yield alone miss the structural dynamics that determine whether those earnings can persist. These three metrics expose the engine room.
Investors applying fundamental analysis metrics across sectors will find that the NIM, ROE, and CET1 framework used here is a bank-specific adaptation of a broader set of principles, where sector-adjusted benchmarks replace generic market averages and the capital constraint replaces a standard debt-to-equity check.
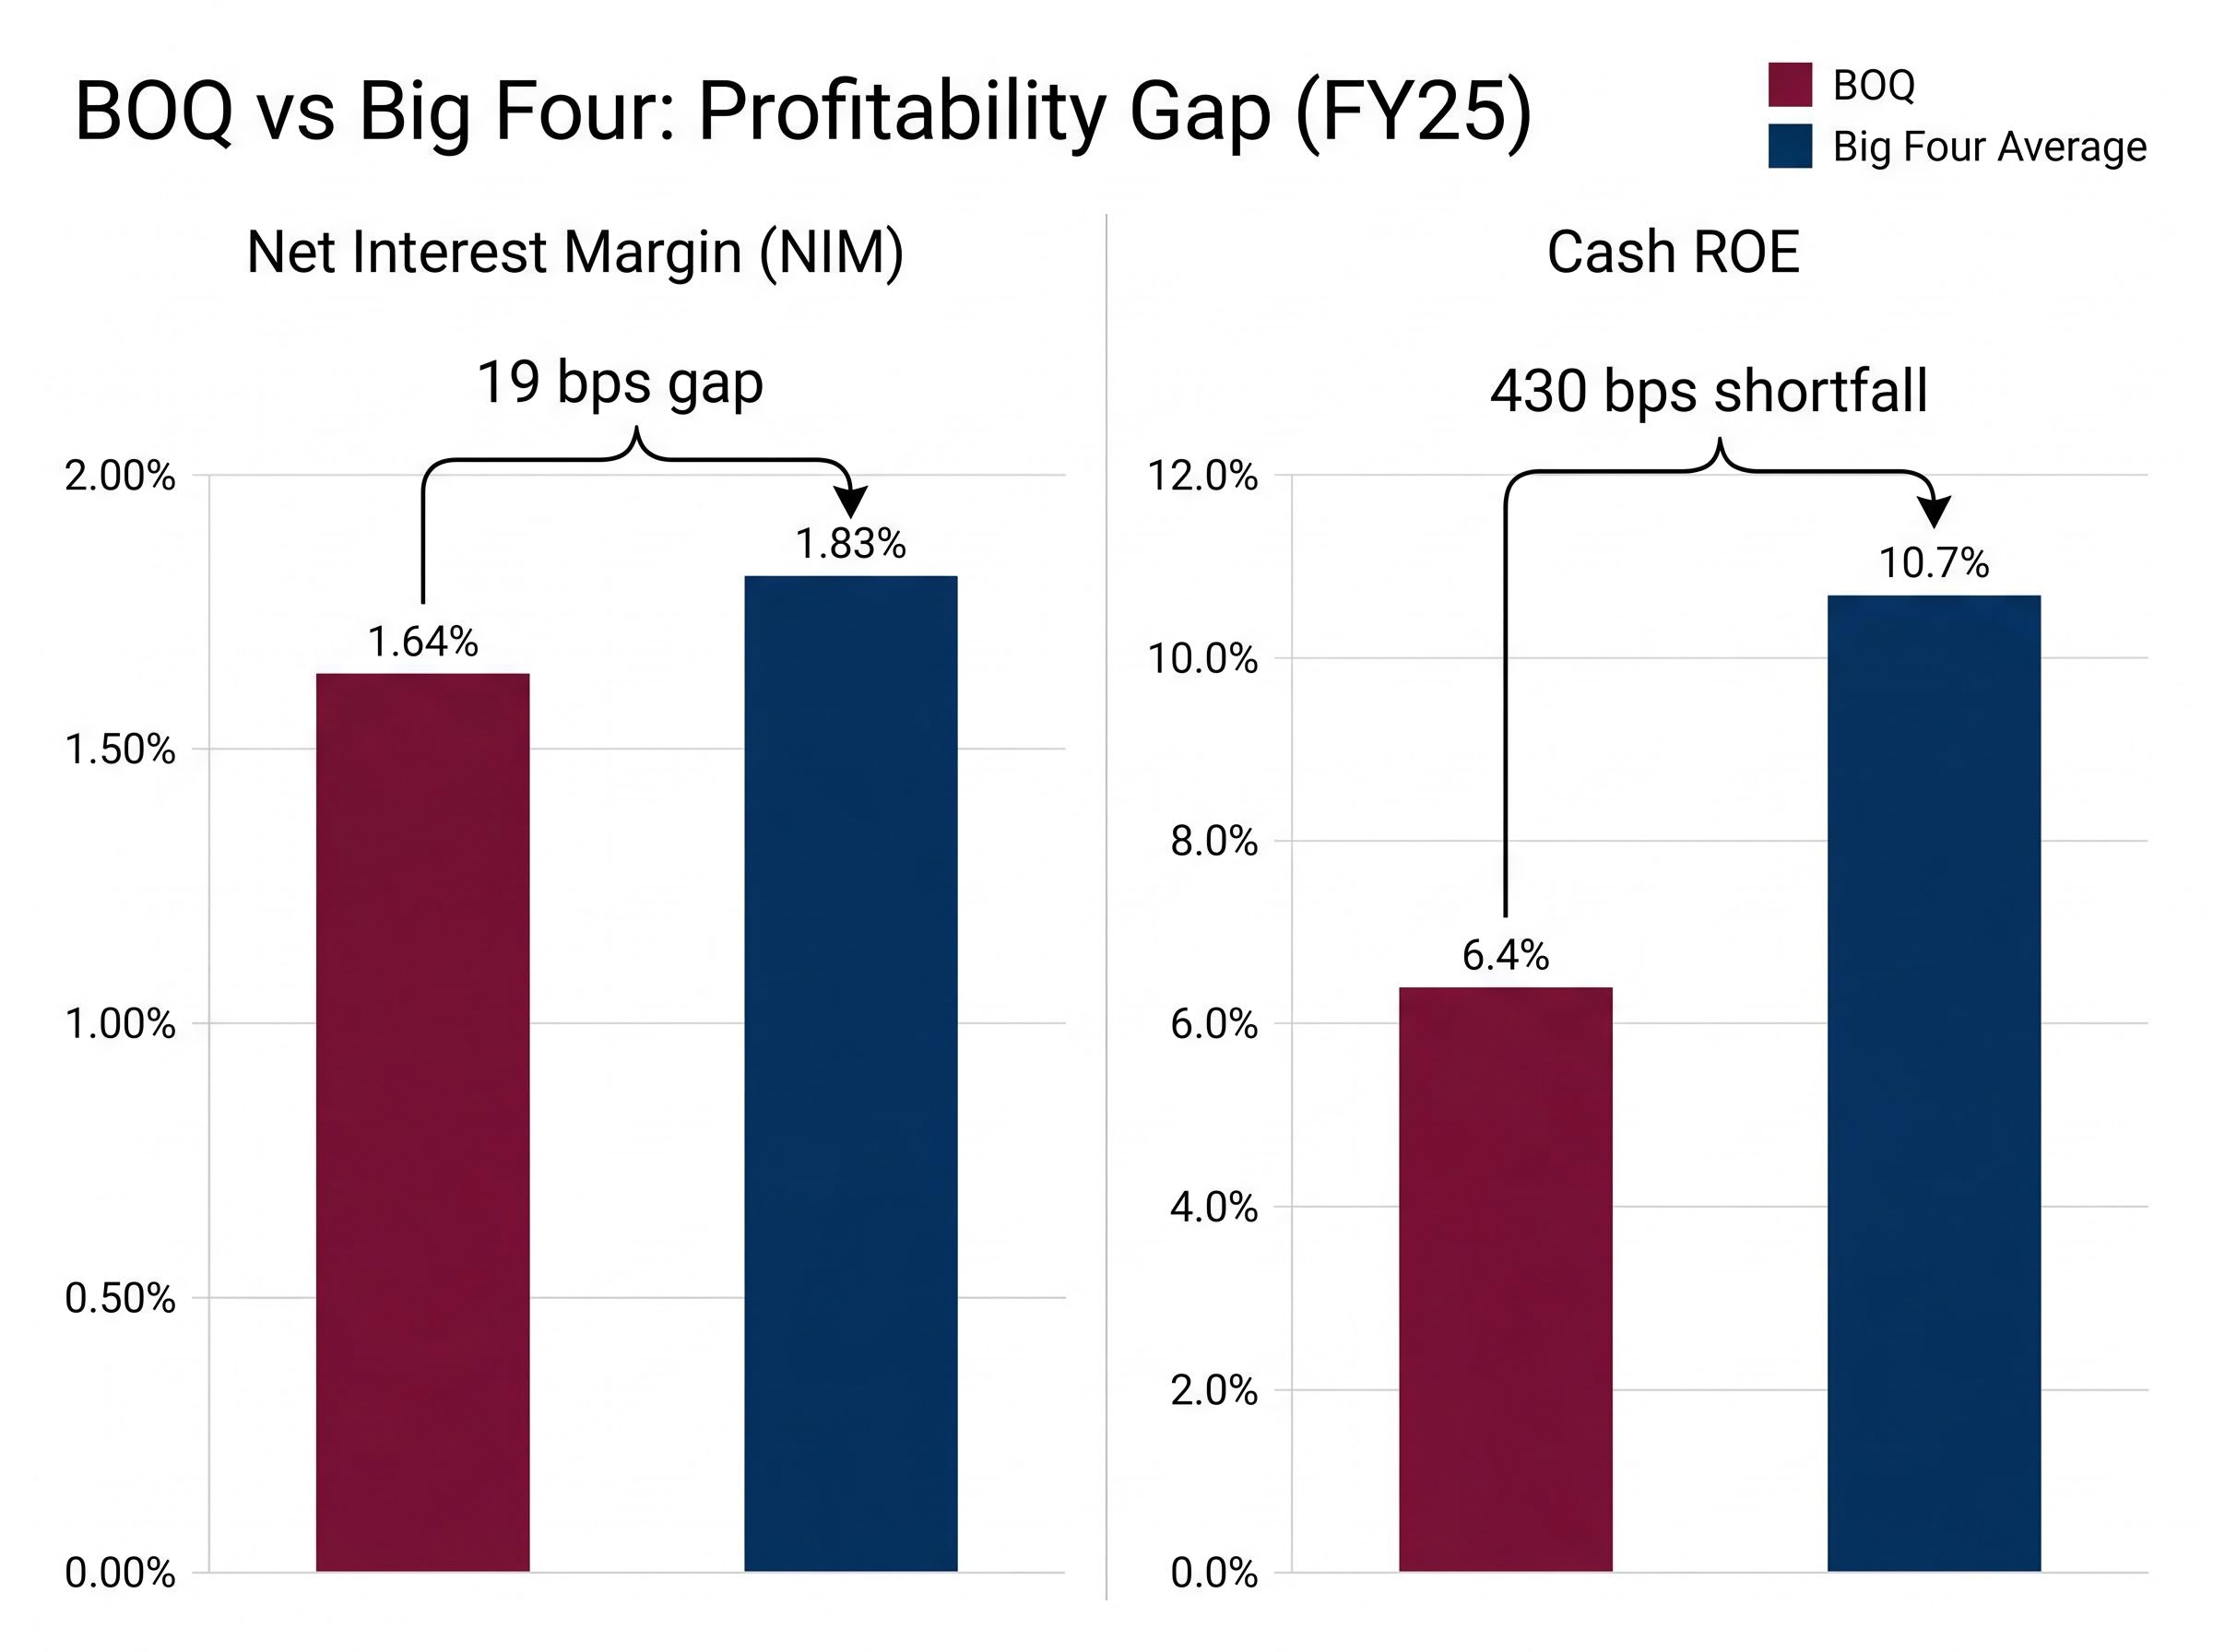
BOQ reported a NIM of 1.64% for FY25. The Big Four average, according to the KPMG Major Australian Banks Full Year Results 2025, came in at 1.83%. That 19-basis-point gap may appear modest in isolation. For a bank where 93 cents of every revenue dollar comes from lending, it is not.
BOQ’s 1H26 results provide the detailed operating context behind these metrics: cash earnings of $176 million came alongside a 5% rise in total income, an 11% increase in the interim dividend, and a CET1 ratio of 11.18%, figures that set the baseline from which the FY25 full-year comparisons in this article are drawn.
| Bank / Group | NIM (FY25) | Gap to BOQ |
|---|---|---|
| BOQ | 1.64% | Baseline |
| Big Four Average | 1.83% | +19 bps |
A separate analysis by Rask Invest calculated BOQ’s NIM at 1.56% against a peer estimate of 1.78%, reflecting a slightly different methodology but reaching the same directional conclusion: BOQ trails its major peers on margin quality.
The Big Four generate substantial fee revenue from wealth management, institutional banking, and foreign exchange products. That income acts as a buffer. When mortgage pricing competition compresses lending margins, the majors absorb the hit across a diversified revenue base.
BOQ lacks that buffer. It must price competitively on mortgages to win volume in a market dominated by larger players. Without offsetting fee income, margin compression flows directly to the bottom line. The NIM gap is not a temporary condition; it reflects a structural revenue ceiling that regional banks face in the current competitive environment.
The NIM gap compounds. BOQ reported a cash ROE of 6.4% for FY25, against a Big Four average of 10.7%, according to KPMG data. That 430-basis-point shortfall means BOQ generates roughly 60 cents of return for every dollar the sector average returns per unit of equity.
The statutory ROE figure is weaker still, at 2.2% for FY25, reflecting one-off charges and non-cash items. Cash ROE is the more meaningful ongoing measure, but both figures sit well below the cost of equity that investors typically require from bank stocks.
Three factors drive the gap:
A price-to-book of 0.7x is the market’s verdict on a bank earning less than its cost of equity.
That verdict is not arbitrary. A bank generating ROE below its cost of equity will rationally trade below book value. Until BOQ closes this gap, the share price carries a structural weight against it regardless of dividend yield. Rask Invest’s alternate ROE calculation of 4.7%, based on a different full-year methodology, reinforces the same conclusion from a slightly different angle.
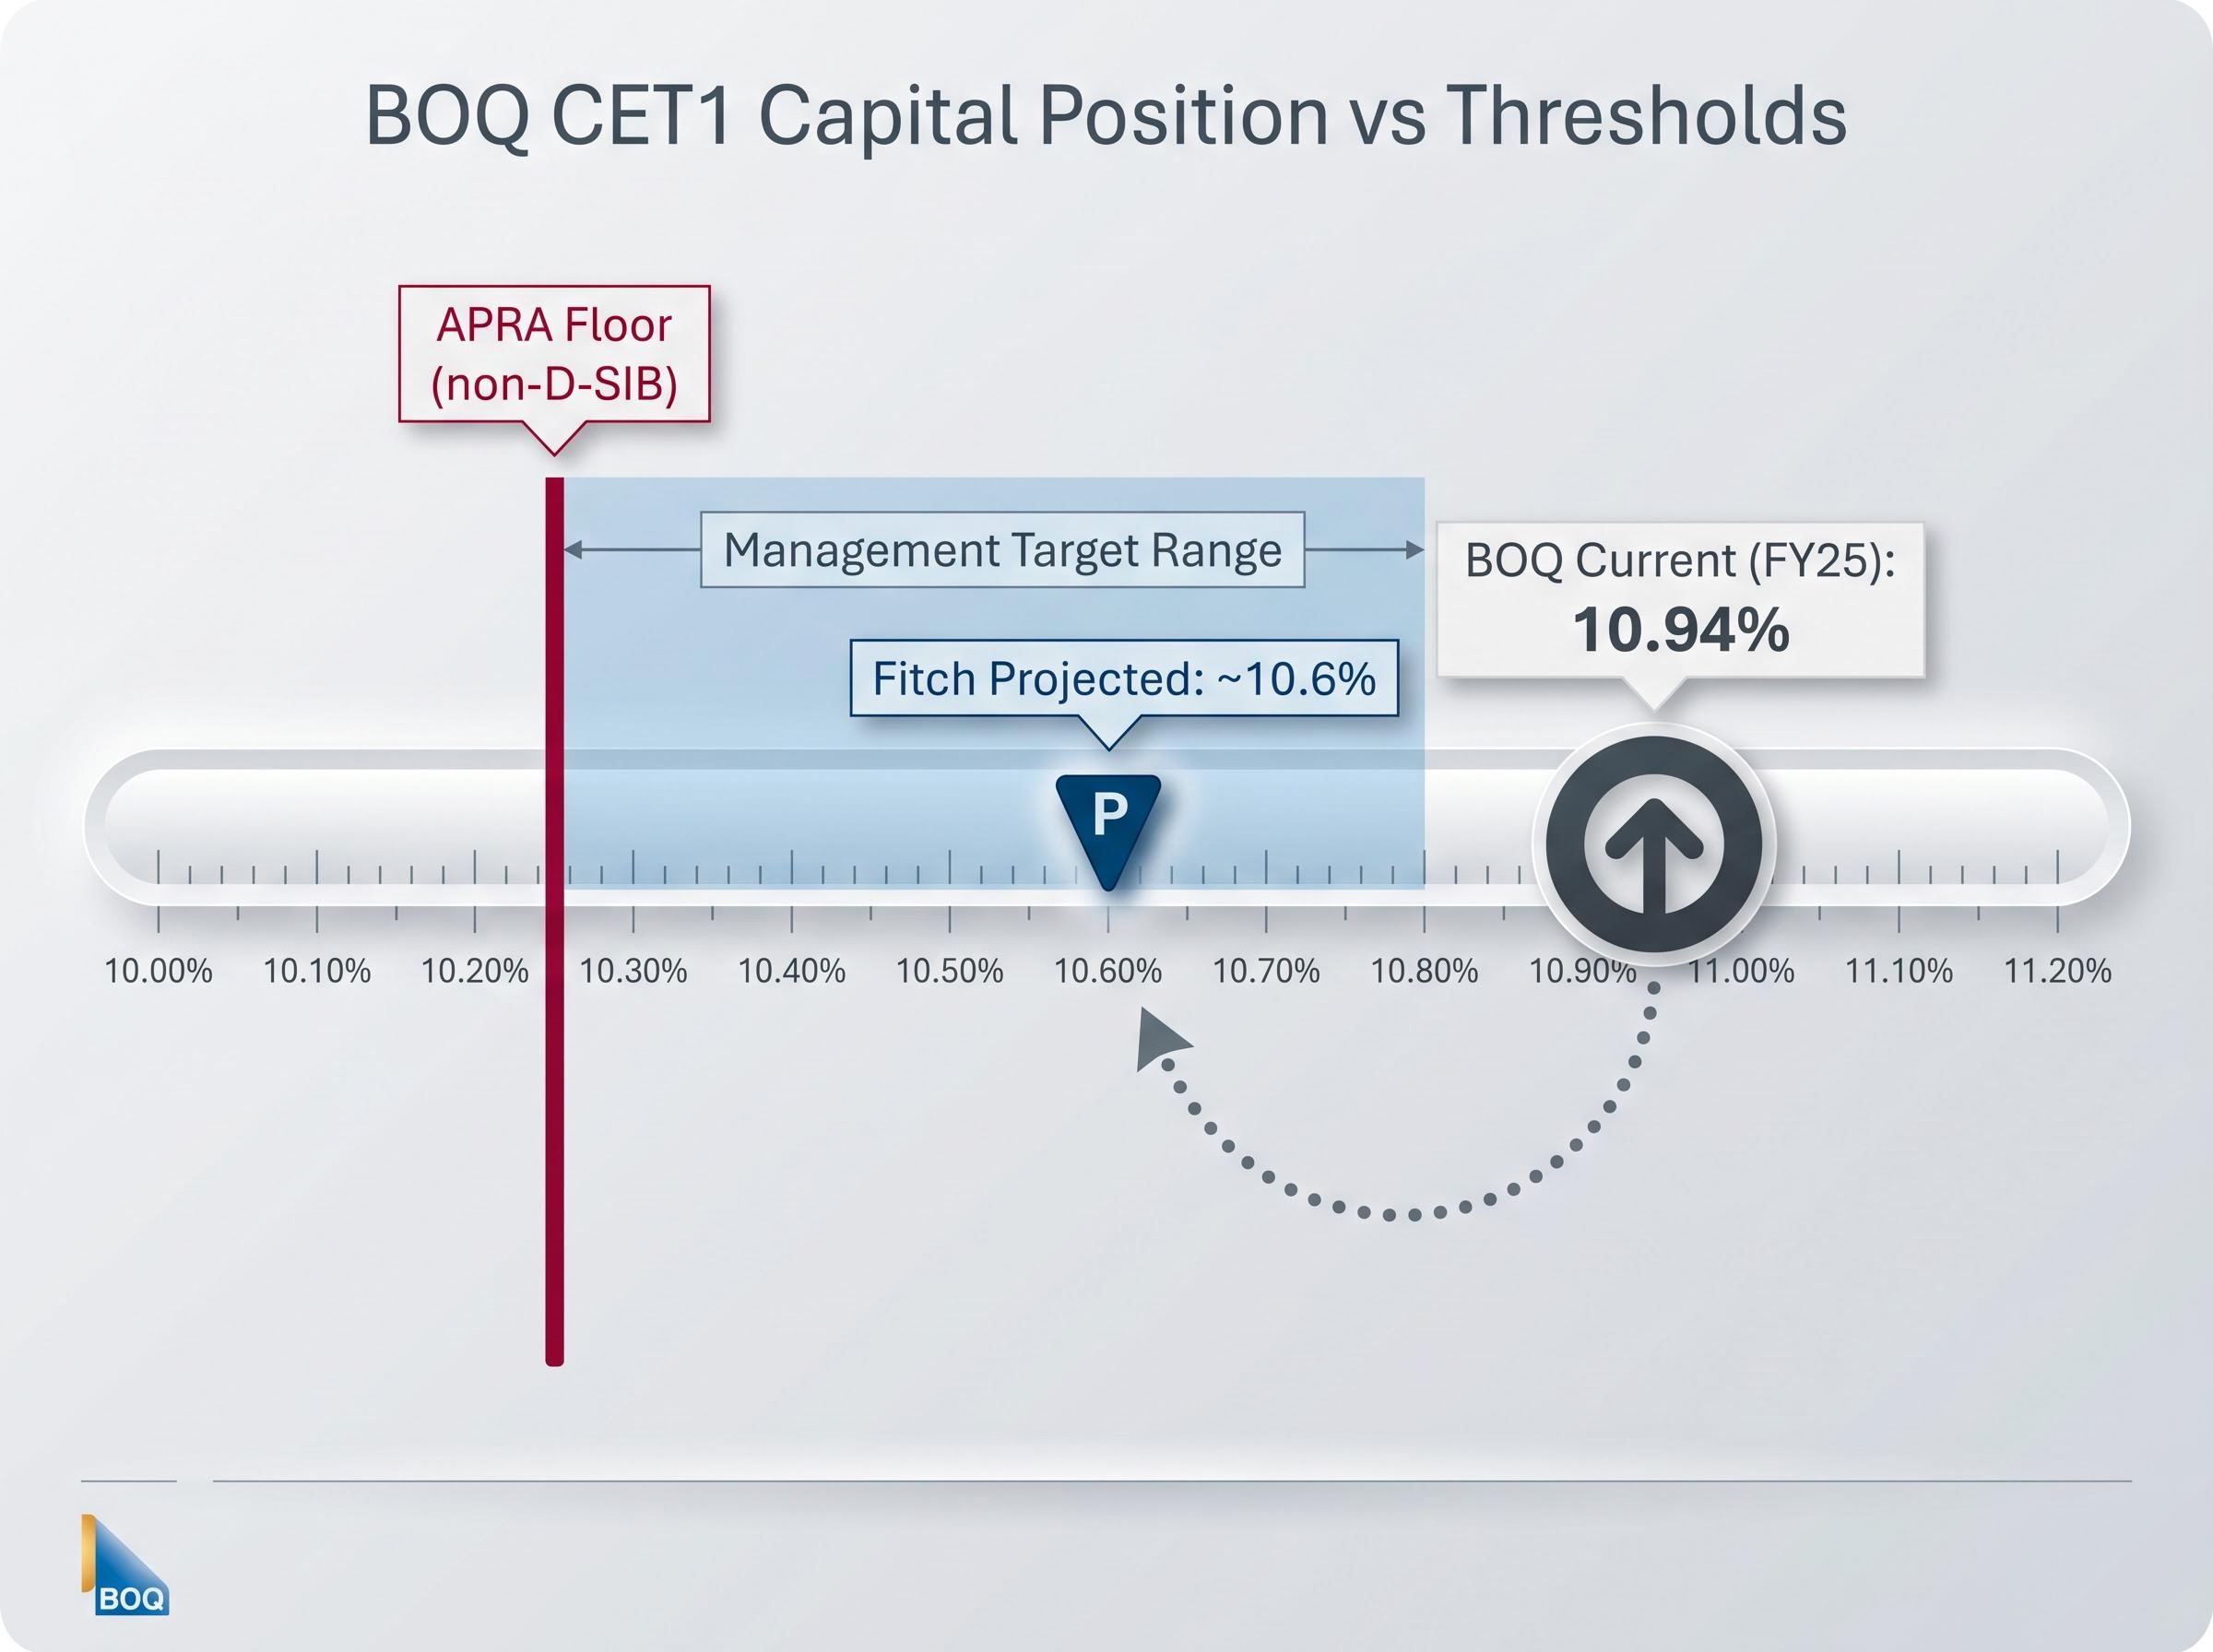
BOQ’s CET1 ratio stood at 10.94% as of FY25 (August 2025), up slightly from 10.87% at the half-year. That places it above both the APRA effective floor of approximately 10.25% for non-D-SIB banks and the upper end of BOQ’s own management target range of 10.25-10.75%.
APRA’s capital adequacy framework establishes the prudential standards that determine minimum CET1 thresholds for all Australian authorised deposit-taking institutions, including the non-D-SIB classification that sets BOQ’s effective regulatory floor at approximately 10.25%.
On the surface, that looks comfortable. The complication arrives in the trajectory.
Fitch Ratings, in its 30 March 2026 assessment, projected BOQ’s CET1 ratio to decline to approximately 10.6%. That figure would still clear the regulatory floor but would compress the buffer above the management target range to a narrow margin.
| CET1 Measure | Ratio |
|---|---|
| BOQ Current (FY25) | 10.94% |
| Fitch Projected | ~10.6% |
| Management Target Range | 10.25-10.75% |
| APRA Floor (non-D-SIB) | ~10.25% |
In practical terms, a declining CET1 trajectory constrains three things that investors care about:
One genuine positive sits alongside these constraints. BOQ’s liquidity coverage ratio (LCR) of 142.9% is well above the 100% regulatory minimum, indicating strong short-term liquidity. Capital adequacy and liquidity are different problems, and BOQ’s liquidity position is not the concern here. The capital trajectory is.
A dividend discount model, using BOQ’s historical dividend and a range of growth rates (2-4%) and discount rates (6-11%), produces a base case fair value of approximately $7.19. Using a forecast dividend of $0.35, the implied fair value rises to approximately $7.40. Against the current share price of $6.34 (as of 8 May 2026), that translates to implied upside of roughly 17-27%.
| DDM Scenario | Dividend Input | Implied Fair Value | vs. Current ($6.34) |
|---|---|---|---|
| Base Case (Historical) | Historical dividend | ~$7.19 | +13.4% |
| Forward Case | $0.35 forecast | ~$7.40 | +16.7% |
| Franking-Adjusted | Full franking value | ~$10.57 | +66.7% |
The franking-adjusted figure of $10.57 represents a ceiling case for SMSF or high-tax-bracket investors who capture the full value of franking credits. It is an upper-bound scenario, not a base case.
The trailing P/E of 43.81x against the sector average of 25.28x appears to signal overvaluation, but the multiple reflects depressed current earnings rather than a premium the market is paying for growth. Cash earnings per share for the full year came in at 58.3 cents. If earnings normalised, the implied P/E would sit closer to 20-22x, which would be a discount to the current sector average.
The share price has already declined approximately 12.8% from $7.27 in August 2025 to the current $6.34. The discount to DDM fair value is real. What matters is whether the conditions for earnings recovery are in place.
Three conditions must hold for the upside case to materialise:
Until those conditions are confirmed in reported results, the DDM range represents potential value, not a buy signal.
For investors wanting to build and stress-test their own dividend discount model, our full explainer on ASX bank DDM valuation uses NAB as a live worked example and walks through how franking credit inclusion shifts the blended fair value average from approximately $35.74 to $51.66, a methodology directly applicable to BOQ’s franking-adjusted scenario above.
This article is for informational purposes only and should not be considered financial advice. Investors should conduct their own research and consult with financial professionals before making investment decisions. Past performance does not guarantee future results. Financial projections are subject to market conditions and various risk factors.
The three metrics assessed above are not BOQ-specific. They form an interlocking analytical framework applicable to any ASX-listed bank.
NIM tells investors the revenue quality of the lending book. ROE tells them how efficiently management converts that book into shareholder returns. CET1 tells them how much structural capacity exists to sustain or grow those returns. Read together, the three metrics distinguish structural underperformers from cyclically depressed recovery opportunities.
A fourth, qualitative data point adds context. BOQ’s Seek culture score sits at 2.6 out of 5, against a financial sector benchmark of 3.1 out of 5. That gap signals potential operational drag through staff retention pressure, a factor that can compound quantitative underperformance over multi-year horizons. BOQ’s owner-manager branch model, a structural feature that differentiates it from major peers, influences both the cost base and these culture dynamics.
| Metric | BOQ Result | Sector Benchmark | Signal |
|---|---|---|---|
| NIM | 1.64% | 1.83% | Below sector |
| Cash ROE | 6.4% | 10.7% | Below sector |
| CET1 | 10.94% | Management target 10.25-10.75% | Adequate, tightening |
| LCR | 142.9% | 100% minimum | Strong |
| Price-to-Book | 0.7x | 1.0x (book value) | Below book |
When applying this framework to any ASX bank, three diagnostic questions cut through the noise:
A framework that works for BOQ works for Bendigo and Adelaide Bank, Macquarie, or any other ASX-listed lender. Investors who can read these three numbers in combination are better positioned to separate price discounts that reflect genuine opportunity from those that reflect structural impairment.
BOQ trades below book value and below DDM fair value because its NIM, ROE, and CET1 trajectory have not yet confirmed an earnings recovery. The market has not missed something; it is pricing the gap between where the bank is and where it needs to be.
The upside case is genuine. At $6.34 with a DDM range of $7.19 to $7.40, there is a credible recovery scenario for investors with a longer horizon and tolerance for below-sector returns in the interim. The franking-adjusted value adds further appeal for tax-advantaged investors.
The signal to watch is not the share price itself. Investors applying the NIM, ROE, and CET1 framework should monitor three specific data points: NIM in the next half-year result, any movement in Fitch’s CET1 outlook, and whether ROE shows a trajectory toward the 8-9% range that would bring the stock closer to book value. Those metrics shifting would represent a change in the investment case. Until they do, the discount persists for a reason.
For investors wanting to model how the BOQ recovery thesis shifts under different rate and employment scenarios, our dedicated guide to ASX bank macro valuation assumptions demonstrates why the same bank can produce a fair value range from $19 to $85 per share depending entirely on macro inputs, a sensitivity that applies to BOQ’s DDM range with equal force.
Net interest margin (NIM) is the difference between what a bank earns on loans and what it pays on deposits and funding; for BOQ, which derives approximately 93% of revenue from lending, NIM is the primary driver of profitability, making its 1.64% figure and 19-basis-point gap behind the Big Four especially significant.
BOQ's trailing P/E of 43.81x reflects depressed current earnings rather than a growth premium; on a normalised cash earnings basis, the implied P/E would be closer to 20-22x, which would represent a discount to the current sector average of 25.28x.
The Common Equity Tier 1 (CET1) ratio measures a bank's highest-quality capital against risk-weighted assets; BOQ's CET1 of 10.94% sits above the regulatory floor but Fitch projects it declining to approximately 10.6%, which would tighten the buffer available for dividend growth and share buybacks.
BOQ reported a cash ROE of 6.4% for FY25, compared to a Big Four average of 10.7%, a 430-basis-point gap that explains why the stock trades at 0.7x book value, as a bank earning below its cost of equity will rationally trade below book.
Three key conditions would need to be confirmed in reported results: NIM stabilisation or recovery above 1.64%, ROE improvement toward the 8-9% range, and CET1 maintained above the management target floor of 10.25%, as without these the discount to DDM fair value of $7.19-$7.40 is likely to persist.