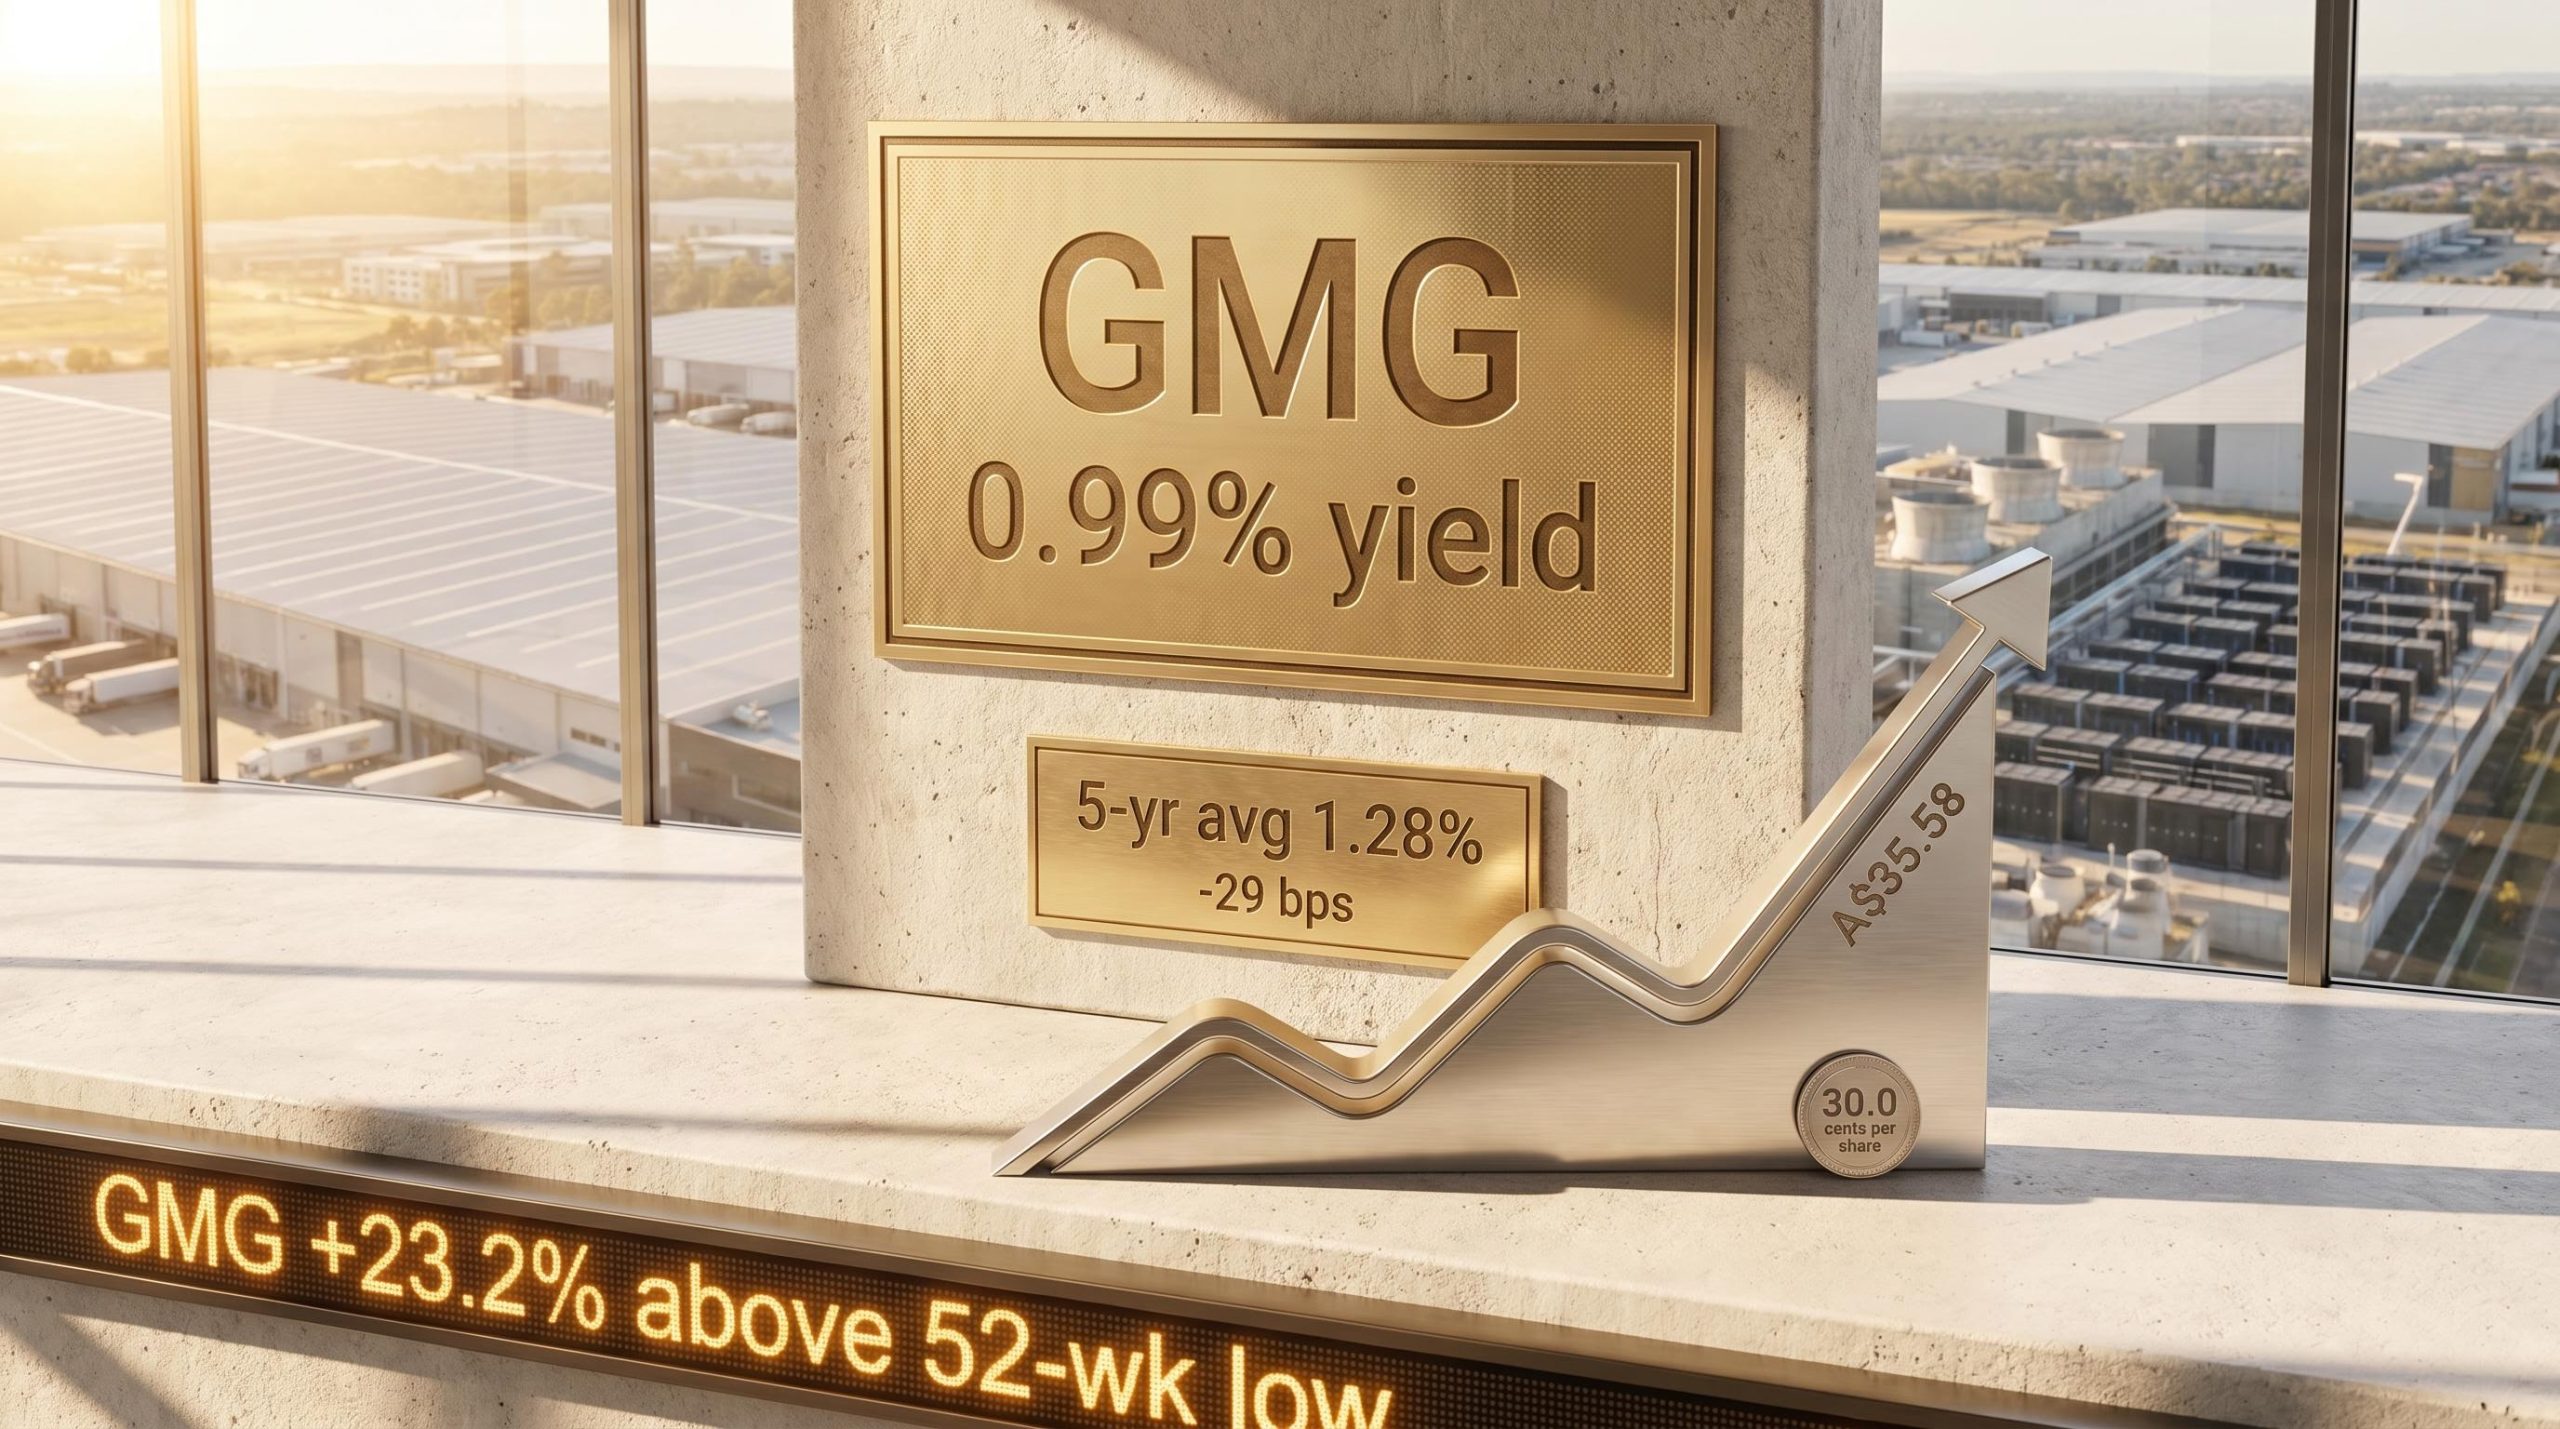
Goodman Group’s dividend yield sits at roughly 0.99%, below its five-year historical average of approximately 1.28%. For the largest listed property group on the ASX, that 29 basis point gap is worth examining carefully, not because it signals danger, but because it reveals how the market is pricing the stock.
GMG shares are trading 23.2% above their 52-week low in May 2026. Analysts carry a consensus Buy rating with a median price target of A$35.58. Understanding why the yield is compressed, and what that compression actually tells investors, requires unpacking how dividend yield functions as a valuation signal rather than simply an income figure.
What follows is a framework for reading dividend yield as a valuation tool, applied specifically to Goodman Group. The aim is to help finance-educated Australian investors interpret what a below-average yield may be signalling about the market’s current pricing of the stock, and when that signal should prompt further investigation rather than alarm.
Why dividend yield is more than an income figure
A stock’s dividend yield moves inversely to its share price. When the share price rises and the dividend stays constant, the yield falls. When the price drops and the dividend holds, the yield rises. This mechanical relationship means a falling yield can reflect a rising share price, not a shrinking dividend.
When a share price rises and the dividend stays constant, the yield falls. The yield figure alone does not reveal which variable moved.
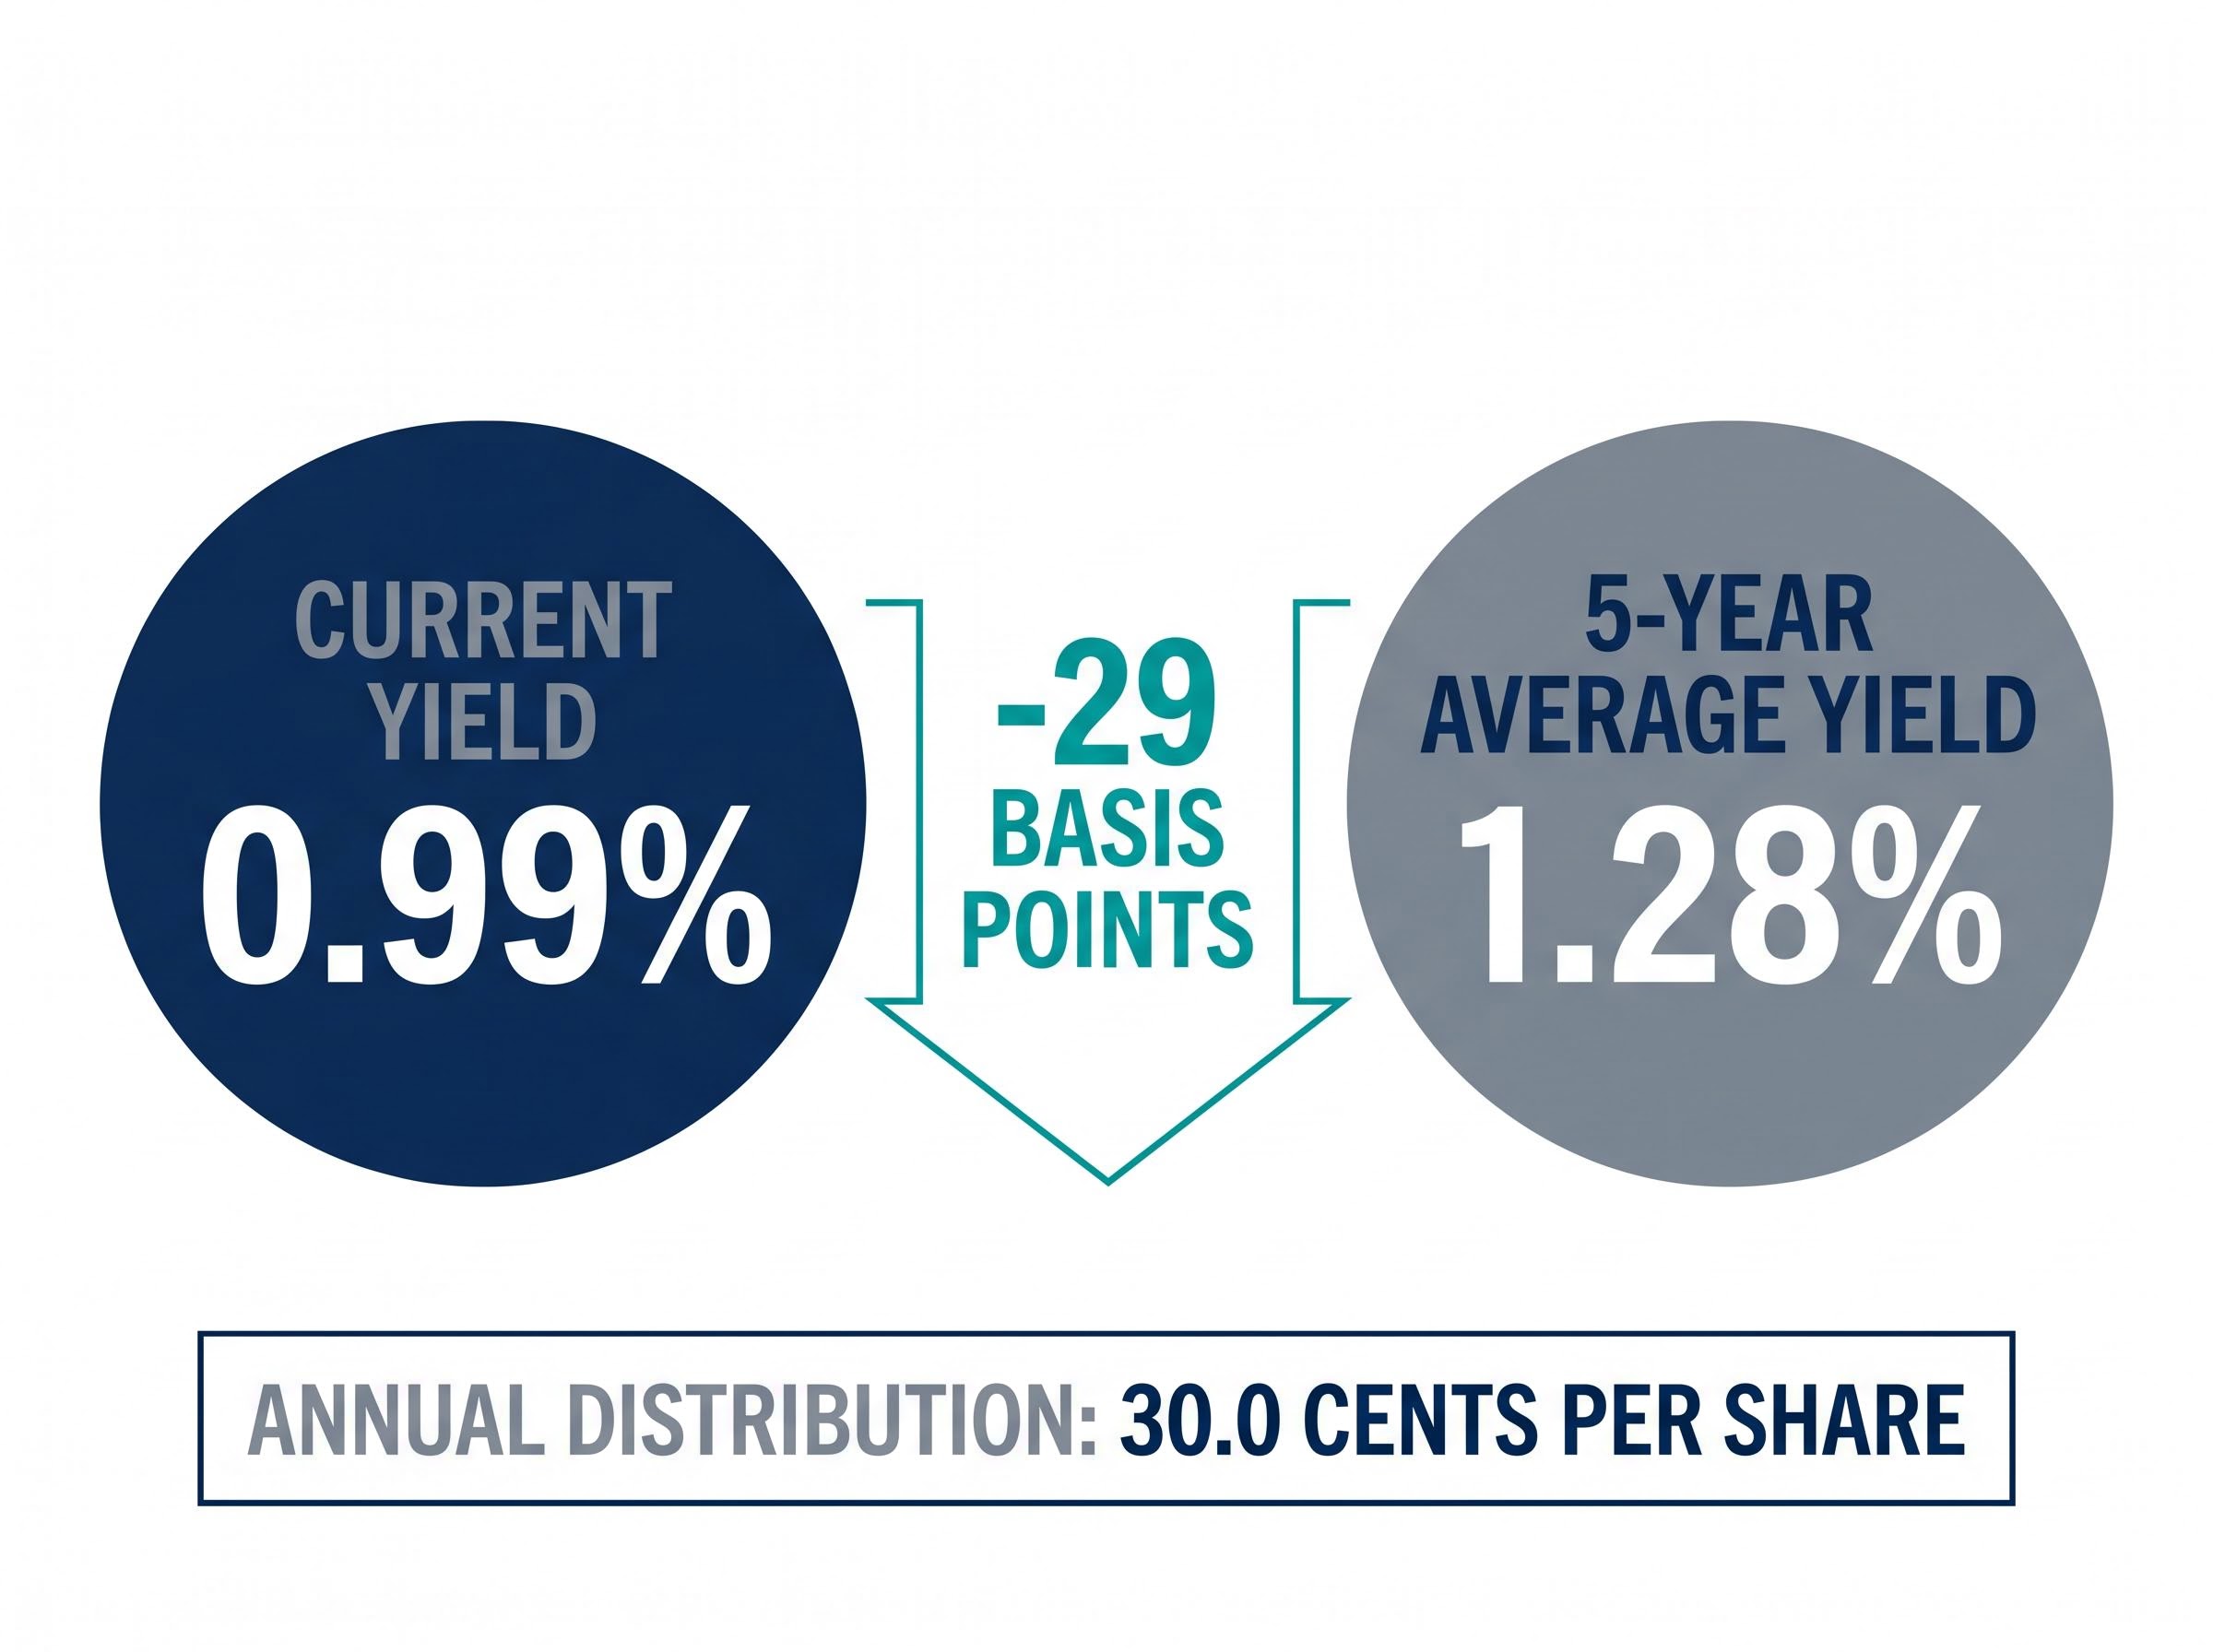
That distinction matters. Goodman Group’s current yield of 0.99% sits below its five-year average of approximately 1.28%, a gap of roughly 29 basis points. Taken in isolation, the number looks low. Placed against the share price trajectory, it looks like the product of sustained price appreciation.
The inverse relationship between share price and yield is one of the most misread aspects of dividend yield mechanics: a falling yield can reflect a rising share price rather than any change in the underlying distribution, which means the headline number requires context before it can serve as a valuation signal.
Comparing a stock’s current yield against its own historical average provides a quick relative valuation benchmark. The direction of the gap offers a signal:
- Yield above historical average: the share price may have compressed relative to the dividend, a possible undervaluation signal worth investigating.
- Yield below historical average: the share price may have risen faster than dividend growth, a possible premium pricing signal.
Neither direction delivers a verdict on its own. The signal needs context: what is driving the share price, whether the dividend policy has changed, and what the company’s reinvestment strategy looks like. For GMG, that context is substantial.
When big ASX news breaks, our subscribers know first
What Goodman Group actually is, and why its yield profile is structurally different
Goodman Group is not a passive income REIT. Established in 1989, it has developed into a global industrial property and logistics developer with a portfolio spanning Australia, New Zealand, the United Kingdom, Japan, the United States, and Brazil. Its core asset base comprises large-scale logistics centres, warehouses, and business parks, with a growing emphasis on digital infrastructure.
The operational profile is that of a development-led platform, not a rent-collecting trust distributing most of its earnings.
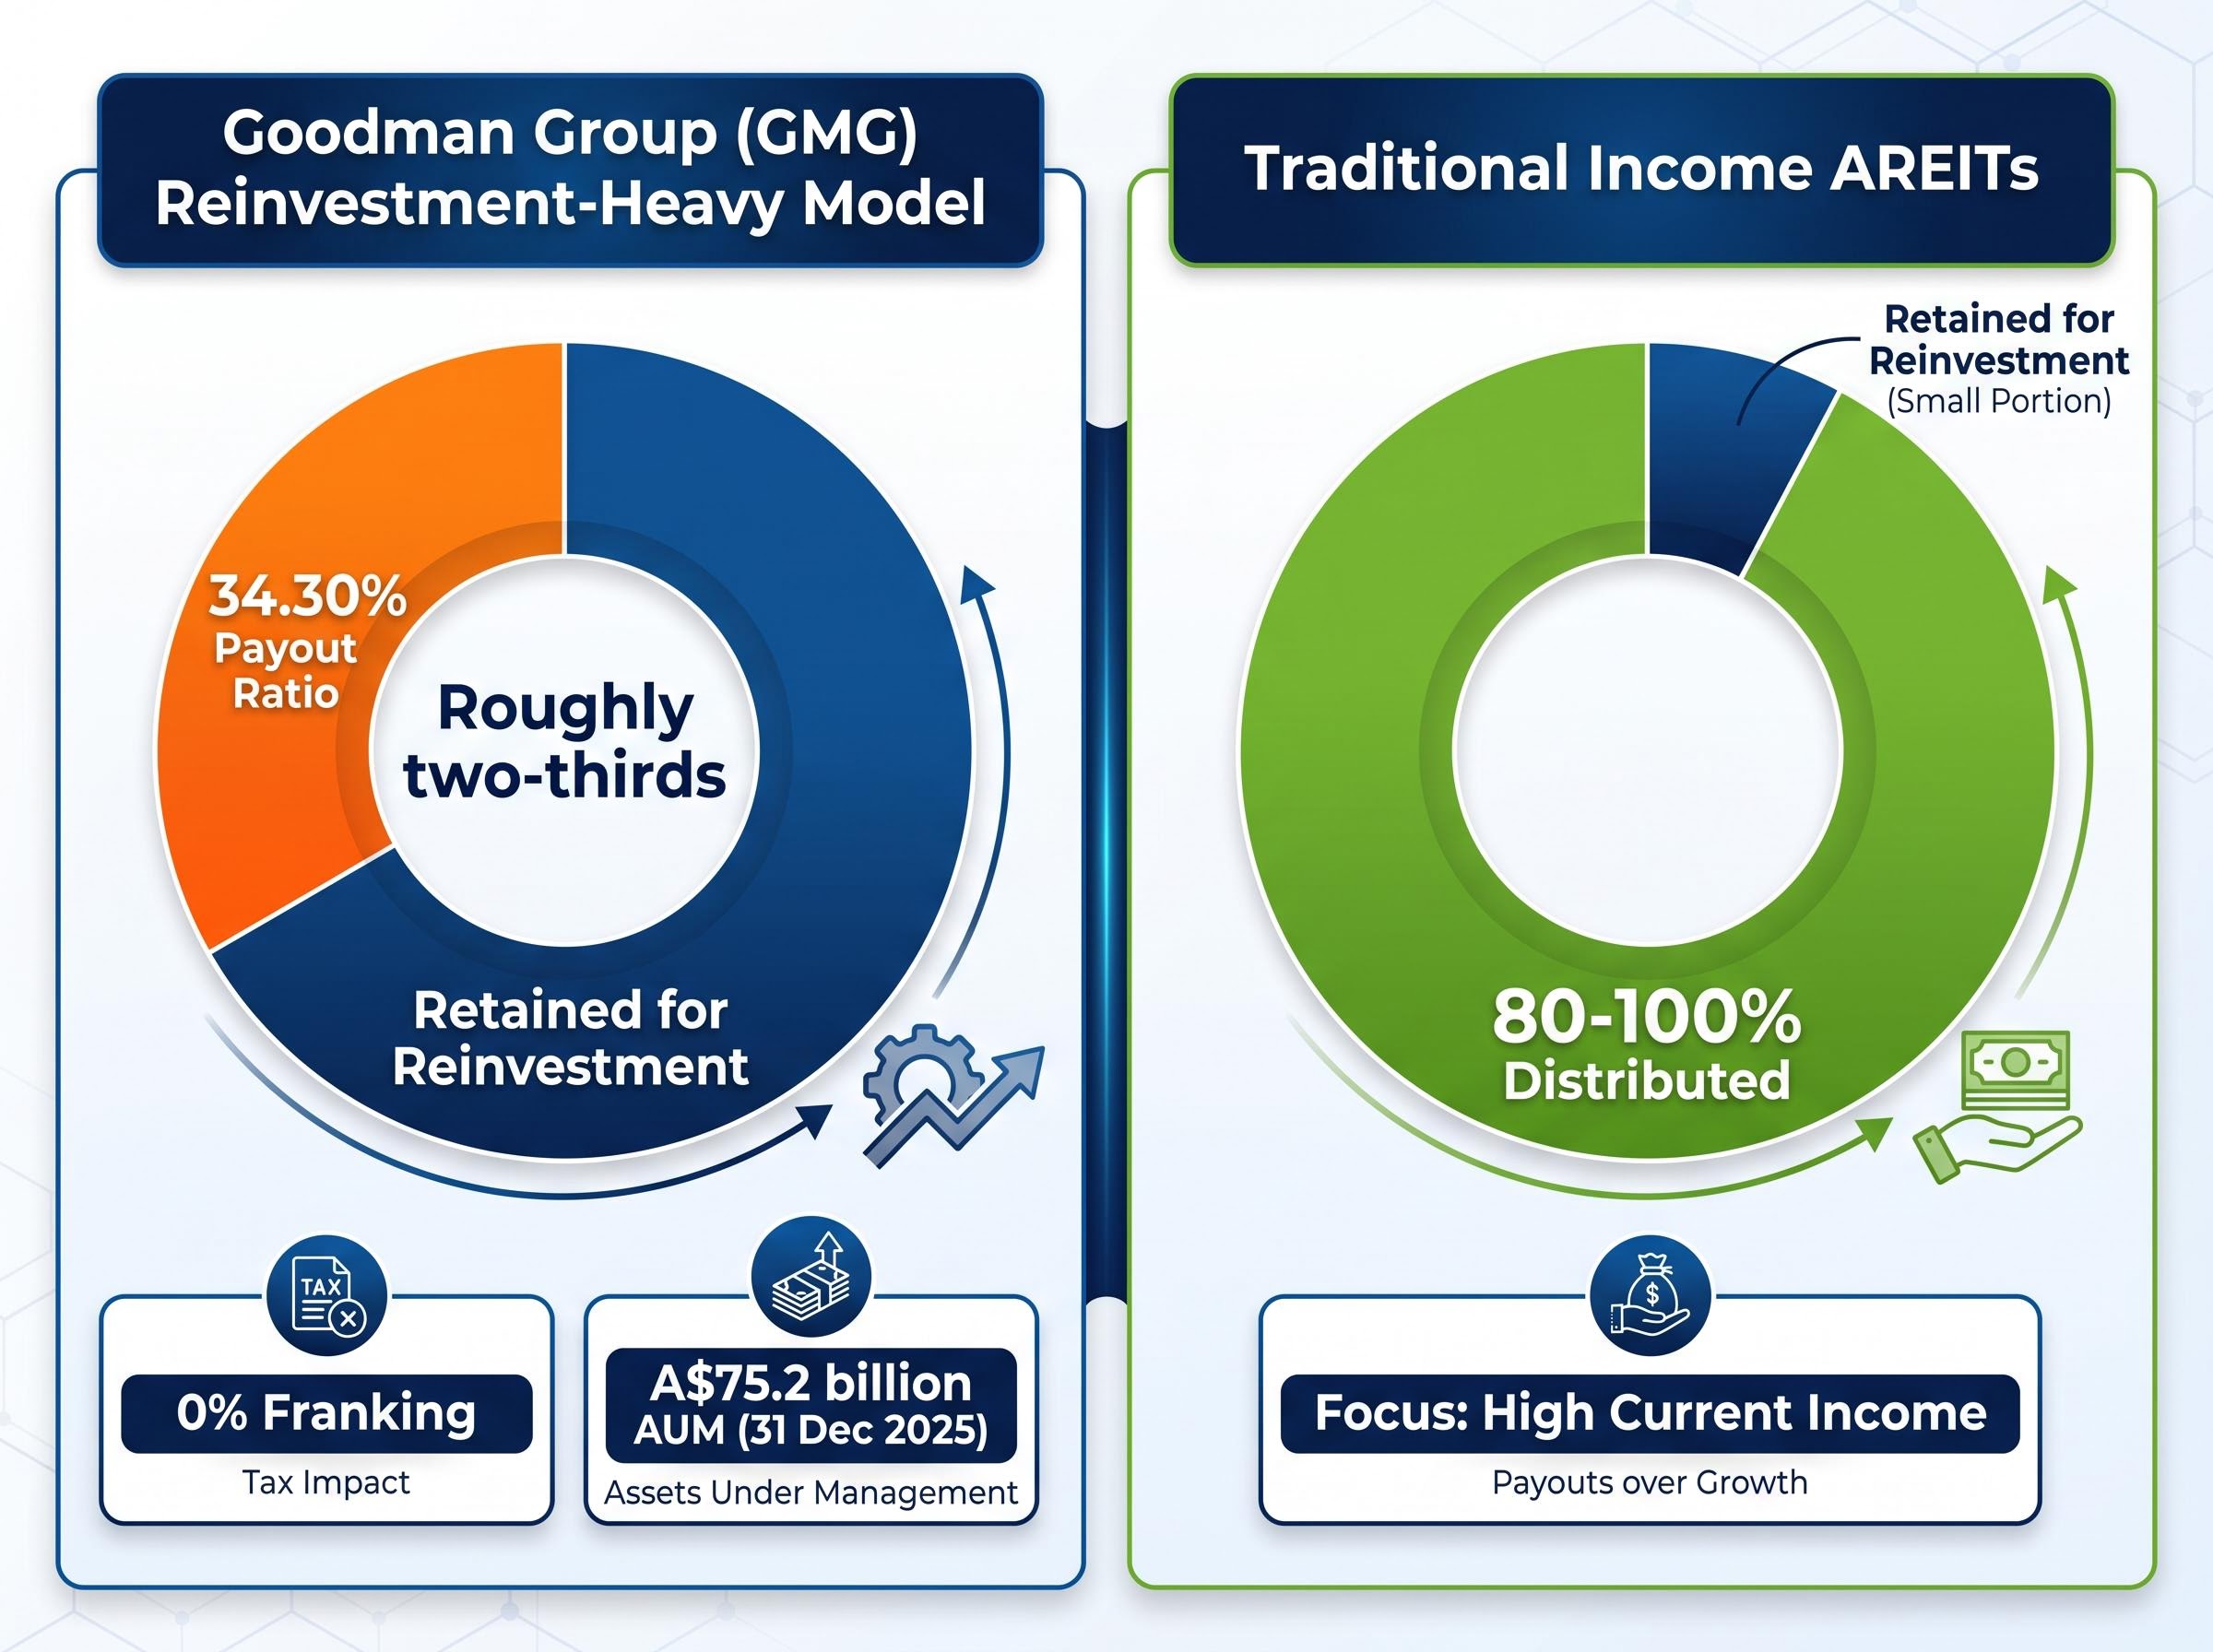
- External assets under management (AUM): A$75.2 billion (as at 31 December 2025)
- Annual distribution forecast (FY26): 30.0 cents per share
- Payout ratio: 34.30%
- Franking: 0% (unfranked distributions)
That payout ratio is the most telling figure in the list. It means Goodman retains roughly two-thirds of its earnings for reinvestment. Income-focused Australian Real Estate Investment Trusts (AREITs) often distribute 80-100% of earnings. GMG’s distribution posture is structurally different.
Payout ratio and unfranked distributions: what they mean for Australian investors
A 34.30% payout ratio positions Goodman firmly as a growth reinvestor. The company channels retained earnings into its development pipeline rather than maximising distributions to unitholders. For investors comparing GMG’s yield against traditional AREITs, this distinction is fundamental.
The unfranked nature of the distributions adds a further layer. Because GMG distributions carry 0% franking, Australian investors receive no franking credit offset against personal income tax. Relative to fully franked dividend payers, the after-tax yield attractiveness is reduced for domestic holders. The 0.99% headline yield, already low, delivers less on an after-tax basis than an equivalent yield from a franked source.
Unfranked distributions carry a real after-tax cost for domestic investors: unlike fully franked dividends, they arrive without a corporate tax credit attached, meaning Australian shareholders cannot offset the payment against their personal tax liability or claim a refund from the ATO, a gap that compounds across large positions held in lower-tax structures such as SMSFs.
Investors who apply the same yield expectations to GMG as they would to a traditional income AREIT will consistently misread what the number is telling them.
How to use historical yield as a valuation benchmark
The historical yield comparison method is one of the most accessible relative valuation tools available to individual investors. It works in three steps:
- Identify the stock’s current dividend yield. For GMG, this is approximately 0.99% based on the annual distribution of 30.0 cents per share relative to the current share price.
- Compare it to the stock’s own multi-year average yield. GMG’s five-year average yield is approximately 1.28%.
- Read the direction of the gap. A current yield below the historical average suggests the share price has risen relative to the dividend, which may indicate premium pricing by the market.
| Metric | GMG Current | GMG 5-Year Average | Gap |
|---|---|---|---|
| Dividend Yield | 0.99% | 1.28% | -29 basis points |
The method relies on an assumption: that dividend levels remain roughly stable over the comparison period, and that yield movement is primarily price-driven. When dividends change materially, the average itself shifts and the comparison weakens.
It also does not replace deeper valuation tools. Discounted Cash Flow (DCF) analysis and Dividend Discount Models offer more granular assessments of intrinsic value. Analyst consensus for GMG currently centres on a median price target of A$35.58, with a range from A$29.00 to A$40.00. These estimates incorporate forward earnings assumptions that a simple yield benchmark cannot capture.
Dividend Discount Models offer a more structured alternative to the historical yield benchmark, anchoring valuation to the present value of expected future distributions rather than a simple comparison to historical averages, though for a company with a 34.30% payout ratio and accelerating earnings growth, the assumptions embedded in the growth rate variable carry significant weight.
The historical yield method is a screening tool, not a final answer. It tells investors where to look more closely. For GMG, it points toward premium pricing, a signal that the next section unpacks.
What the data centre pivot means for GMG’s valuation premium
The premium pricing that GMG’s compressed yield implies is not arbitrary. It is grounded in a specific strategic transformation: the company’s accelerating shift into digital infrastructure and data centre development, powered by global demand for artificial intelligence (AI) computing capacity.
The scale of the pipeline is substantial:
- Global power bank: 6.0 GW
- FY26 target: 0.5 GW of data centre capacity in active projects
- European data centre joint venture with CPP Investments: A$14 billion (announced December 2025)
The A$14 billion European data centre joint venture with CPP Investments, announced in December 2025, represents one of the largest single digital infrastructure commitments by an ASX-listed company.
This pipeline repositions Goodman from a logistics property developer into a hybrid industrial and digital infrastructure platform. Data centres command higher development margins and longer lease tenures than traditional logistics assets, which supports the earnings growth outlook underpinning GMG’s valuation.
The JLL global data centre outlook projects the sector to nearly double in capacity by 2030, with AI workloads potentially representing half of all data centre demand, a trajectory that directly underpins the earnings growth case embedded in GMG’s current valuation premium.
Management has guided for 9% operating earnings per share (EPS) growth in FY26, with management earnings of A$325 million reported for the first half. That growth rate, combined with a distribution held steady at 30.0 cents per share, explains why the market is willing to price the stock at a level that compresses the yield below historical norms.
The analyst consensus Buy rating reflects this forward view. The market is pricing in a business that is reinvesting at scale into higher-value assets, not one that is failing to deliver income.
Reading the yield signal correctly for a growth-oriented property group
Bringing the threads together: GMG’s yield of 0.99% sits below its five-year average of 1.28% while the share price trades 23.2% above its 52-week low. The annual distribution remains stable at 30.0 cents per share. Operating EPS growth guidance stands at 9% for FY26. Analyst consensus is Buy, with a median target of A$35.58.
Read together, these data points describe a market that is pricing in future earnings growth rather than penalising the stock. The compressed yield is a function of price strength, not dividend weakness. A 34.30% payout ratio confirms the reinvestment-first posture that makes this yield profile structurally consistent rather than anomalous.
A total return framework reframes the GMG yield question entirely: rather than asking whether 0.99% is adequate income, it asks whether the combination of distribution and capital appreciation produces competitive long-run wealth outcomes, a question that the company’s 9% EPS growth guidance and reinvestment posture are more directly designed to answer.
The yield signal needs to be read alongside Goodman’s specific business model. Comparing it against income AREIT benchmarks misapplies the tool. A below-average yield on a growth-oriented property group, when combined with expanding earnings and a transforming asset base, is a different signal from the same pattern on a traditional income stock.
When a below-average yield warrants more concern
The current reading does not mean a compressed yield can never signal trouble for GMG. Three conditions would change the interpretation and warrant closer scrutiny:
- A reduction in the 30.0 cents per share distribution guidance, which would indicate pressure on cash generation rather than reinvestment confidence.
- A material downgrade to the 9% EPS growth target, which would weaken the forward earnings case that justifies the premium pricing.
- Share price convergence toward the A$29.00 analyst low target, which could indicate the market reassessing the growth thesis.
These are monitoring triggers, not current concerns. As at May 2026, none of these conditions are present.
GMG’s yield in May 2026 is a premium signal, not an income shortfall
For a growth-oriented industrial and digital infrastructure developer like Goodman Group, a dividend yield sitting below its five-year average is most plausibly a reflection of premium market pricing, not a warning about dividend health. The 0.99% yield tells investors that the share price has run ahead of the distribution, and the 9% EPS growth guidance, A$14 billion data centre joint venture, and A$75.2 billion AUM explain why the market has been willing to pay that premium.
The distribution outlook remains stable at 30.0 cents per share for FY26. Analysts maintain a Buy consensus with a median target of A$35.58, implying potential upside from current levels. The yield figure stays compressed because the business is growing into its valuation.
Australian investors can apply the same historical yield benchmark discipline to other ASX-listed companies, with one consistent reminder: context, sector, and payout structure always shape the interpretation. A low yield is a question, not an answer. For Goodman, the answer points to growth.
This article is for informational purposes only and should not be considered financial advice. Investors should conduct their own research and consult with financial professionals before making investment decisions. Past performance does not guarantee future results. Financial projections are subject to market conditions and various risk factors.