MercadoLibre just posted its fastest revenue growth in nearly four years. Revenue surged 49% year-over-year in Q1 2026, reaching approximately $9 billion, while the stock trades at roughly $1,633 as of 8 May 2026, well below the analyst consensus price target of approximately $2,639. U.S. investors evaluating emerging market technology exposure often overlook Latin America in favour of Southeast Asian or Chinese platforms. Yet MercadoLibre holds the number-one e-commerce position in every market it operates in, has nearly doubled its credit book in twelve months, and is accelerating delivery speed at a rate that suggests logistics infrastructure is pulling ahead of competitors rather than merely keeping pace. The Q1 2026 earnings release on 7 May 2026 sharpened the investment question: is the margin compression a signal of structural deterioration, or is it the cost of building a moat that will be very expensive for anyone else to replicate? This analysis breaks down what Q1 2026 reveals about MercadoLibre’s competitive position, unpacks why operating margin fell from 13% to roughly 7% and whether that matters, examines the fintech division’s underwriting edge, and presents the risk factors U.S. investors need to weigh before forming a view on valuation.
What Q1 2026 metrics actually tell us about momentum
The numbers surprised to the upside across every dimension that matters for a platform business. Q1 2026 was not a quarter carried by a single product line or a single geography; the acceleration was broad-based.
MercadoLibre reported its fastest revenue growth in nearly four years, with Q1 2026 representing a meaningful re-acceleration after several quarters of decelerating comparisons.
The headline metrics tell the story:
- Revenue: approximately $9 billion, up 49% year-over-year
- Items sold: up 47% year-over-year
- FX-neutral GMV growth: up 38% year-over-year
- Unique active buyers: grew from approximately 66 million to 84 million (roughly 26% growth)
- Merchant payment volume growth: accelerated from 32% to 39% year-over-year
FX headwinds shaved approximately 3% off USD-reported revenue growth in the quarter, which means the underlying local currency performance was stronger still. The simultaneous acceleration across buyer counts, item volumes, and payment processing rates is not coincidental. It reflects a commerce-fintech flywheel gaining rotational speed, a pattern that becomes clearer when examining the structural mechanics behind it.
The Q1 2026 earnings season produced blended S&P 500 EPS growth of 27.1% against a 13.1% consensus estimate, with an 84% beat rate across the index; MELI’s own 49% revenue growth places it well above that aggregate benchmark, reinforcing that the re-acceleration is company-specific rather than a rising-tide effect.
When big ASX news breaks, our subscribers know first
The structural moat: why the e-commerce and fintech flywheel is difficult to replicate
MercadoLibre’s competitive advantage is not simply scale in either e-commerce or fintech independently. The structural edge lies in the data loop connecting them, and that loop compounds with each transaction.
The flywheel operates in three reinforcing steps:
- Commerce generates transaction data. Hundreds of millions of purchases across Brazil, Mexico, Argentina, and Chile produce granular visibility into how consumers spend, what they buy, and how frequently they return.
- Transaction data enables superior credit underwriting. Mercado Pago uses purchasing behaviour to assess borrower risk with precision that traditional banks structurally cannot match, because banks lack real-time visibility into how borrowers actually spend.
- Fintech revenue funds logistics investment. Credit and payments revenue finances the fulfilment network expansion that makes the e-commerce experience faster, pulling more buyers onto the platform, generating more data, and restarting the loop.
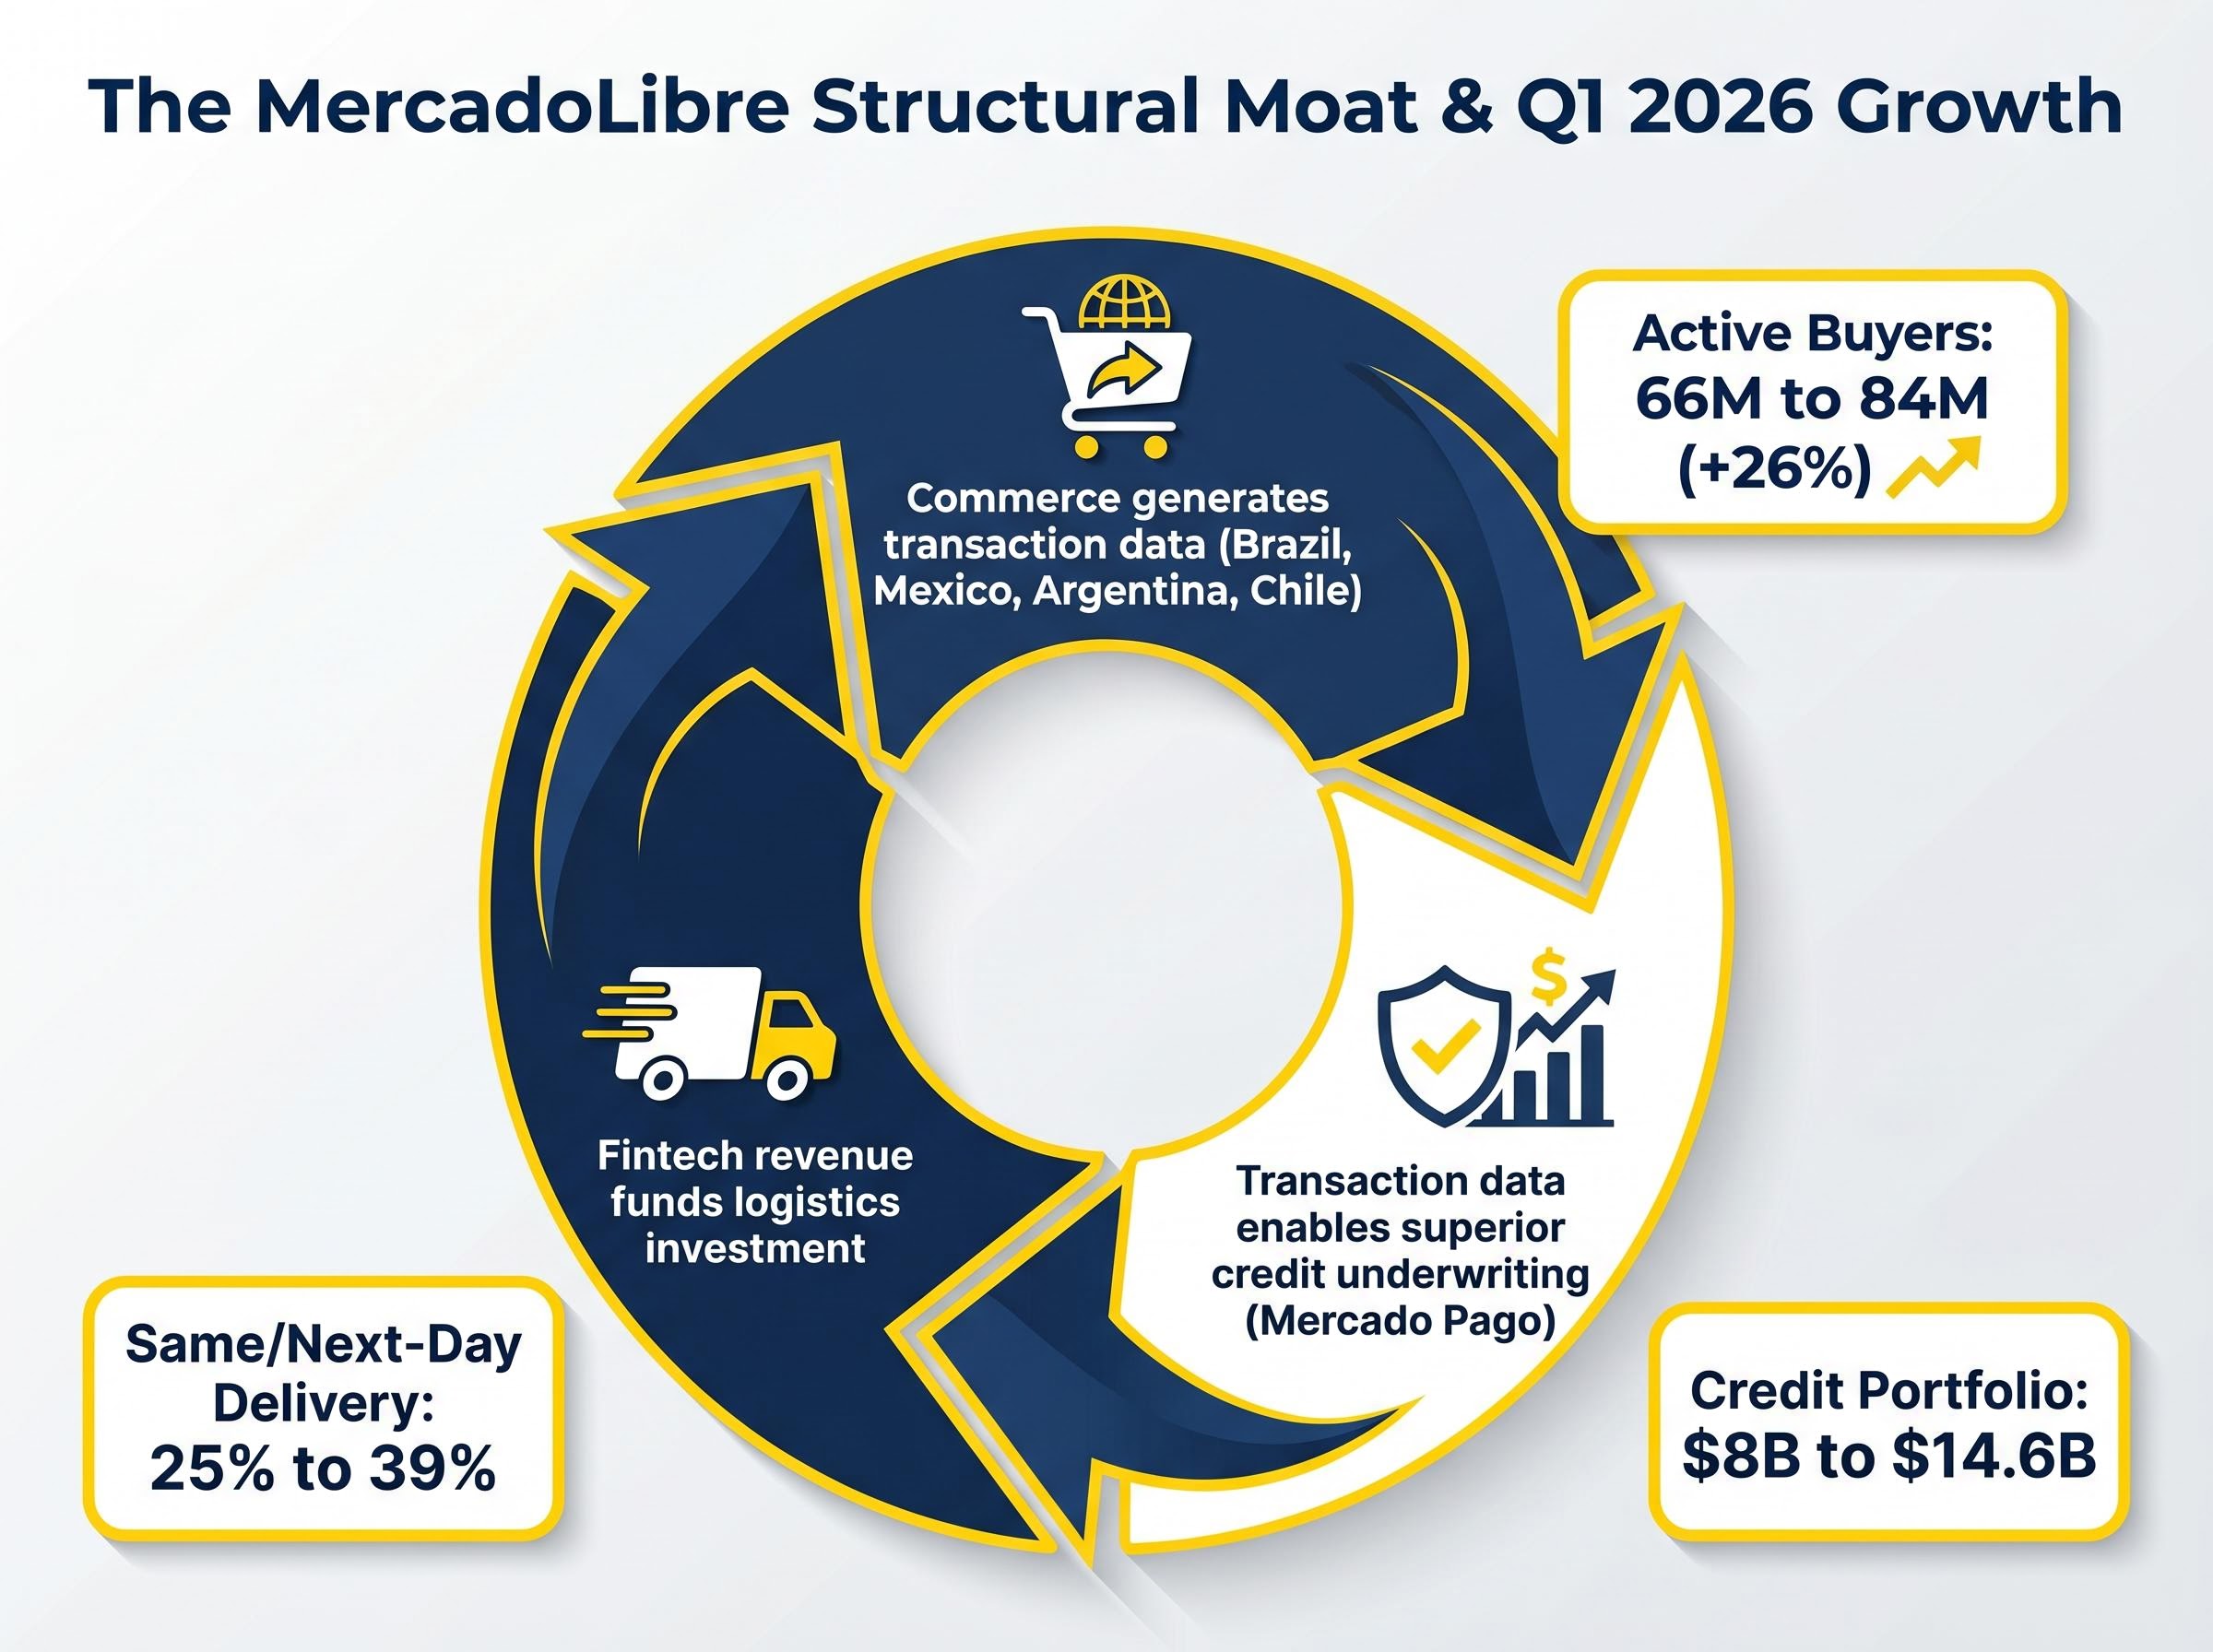
The logistics layer functions as a second moat. Same-day and next-day delivery rose from 25% to 39% of shipments year-over-year, a capital-intensive barrier that forces any challenger to match years of infrastructure investment before competing on delivery speed.
| Competitive Moat Layer | Key Metric | Year-over-Year Change |
|---|---|---|
| Logistics speed | Same-day/next-day delivery share | 25% to 39% of shipments |
| Buyer network | Unique active buyers | 66 million to 84 million (+26%) |
| Payment volume | Total payment volume growth | Approximately +50% YoY |
The credit portfolio reached $14.6 billion in Q1 2026, and MercadoLibre holds the number-one e-commerce position across all operating markets, with fintech ranking first or second depending on the country. A competitor entering the e-commerce market cannot simply build a marketplace; they would also need to replicate the transaction history that enables the fintech edge, and vice versa.
Understanding MercadoLibre’s business model for investors new to LatAm fintech
U.S. investors accustomed to evaluating fintech through the lens of Stripe, PayPal, or Affirm should recognise that MercadoLibre operates in a fundamentally different market structure. Latin America has historically had low bank account penetration and high consumer credit costs, which means digital-first financial services capture demand that never existed in a comparable form in the U.S. or European markets. That structural gap gives MercadoLibre pricing power and addressable market depth that U.S.-centric fintech names do not enjoy.
The e-commerce engine: marketplace fees, advertising, and first-party inventory
Three revenue streams sit within commerce services. Third-party seller fees carry the highest margins and scale with GMV. Advertising revenue (high purchase intent, attractive to merchants) has been growing as a share of commerce revenue. First-party product sales, at approximately $4 billion annualised, carry lower margins and are assigned lower valuation weight by analysts, but were deliberately expanded to ensure product availability and price competitiveness, a strategic choice with short-term margin cost and long-term customer retention benefit.
The fintech engine: Mercado Pago’s payments and credit stack
Mercado Pago operates a full product stack: digital wallet, payment acquiring for merchants, credit cards, personal loans, merchant financing, and a small but growing insurtech component. The credit portfolio composition breaks down as follows:
- Credit cards: approximately 46%
- Consumer loans: approximately 37%
- Merchant loans: approximately 16%
The credit book grew from approximately $8 billion to $14.6 billion in twelve months, an 87% year-over-year increase. Fintech is expected to contribute approximately 45% of total revenue by FY2026 consensus estimates.
Both 15-to-90-day and 90-day-plus past-due ratios improved year-over-year despite the credit portfolio nearly doubling in size, a signal that underwriting discipline is holding as the book scales.
That delinquency improvement while scaling is what separates MercadoLibre from lenders that grow by relaxing standards. The proprietary purchasing data across hundreds of millions of transactions gives the credit division an underwriting advantage that traditional banks structurally cannot replicate.
Where margin compression comes from, and why the breakdown matters
Operating margin fell from approximately 13% to approximately 7% year-over-year in Q1 2026. The headline looks concerning. The composition tells a different story.
The compression is almost entirely attributable to two deliberate choices rather than operational deterioration. The first driver, cost-of-goods-sold investments (free shipping threshold reduction and first-party inventory expansion), accounted for approximately 3 percentage points of the decline. The second, bad debt provision growth, accounted for approximately 4 percentage points.
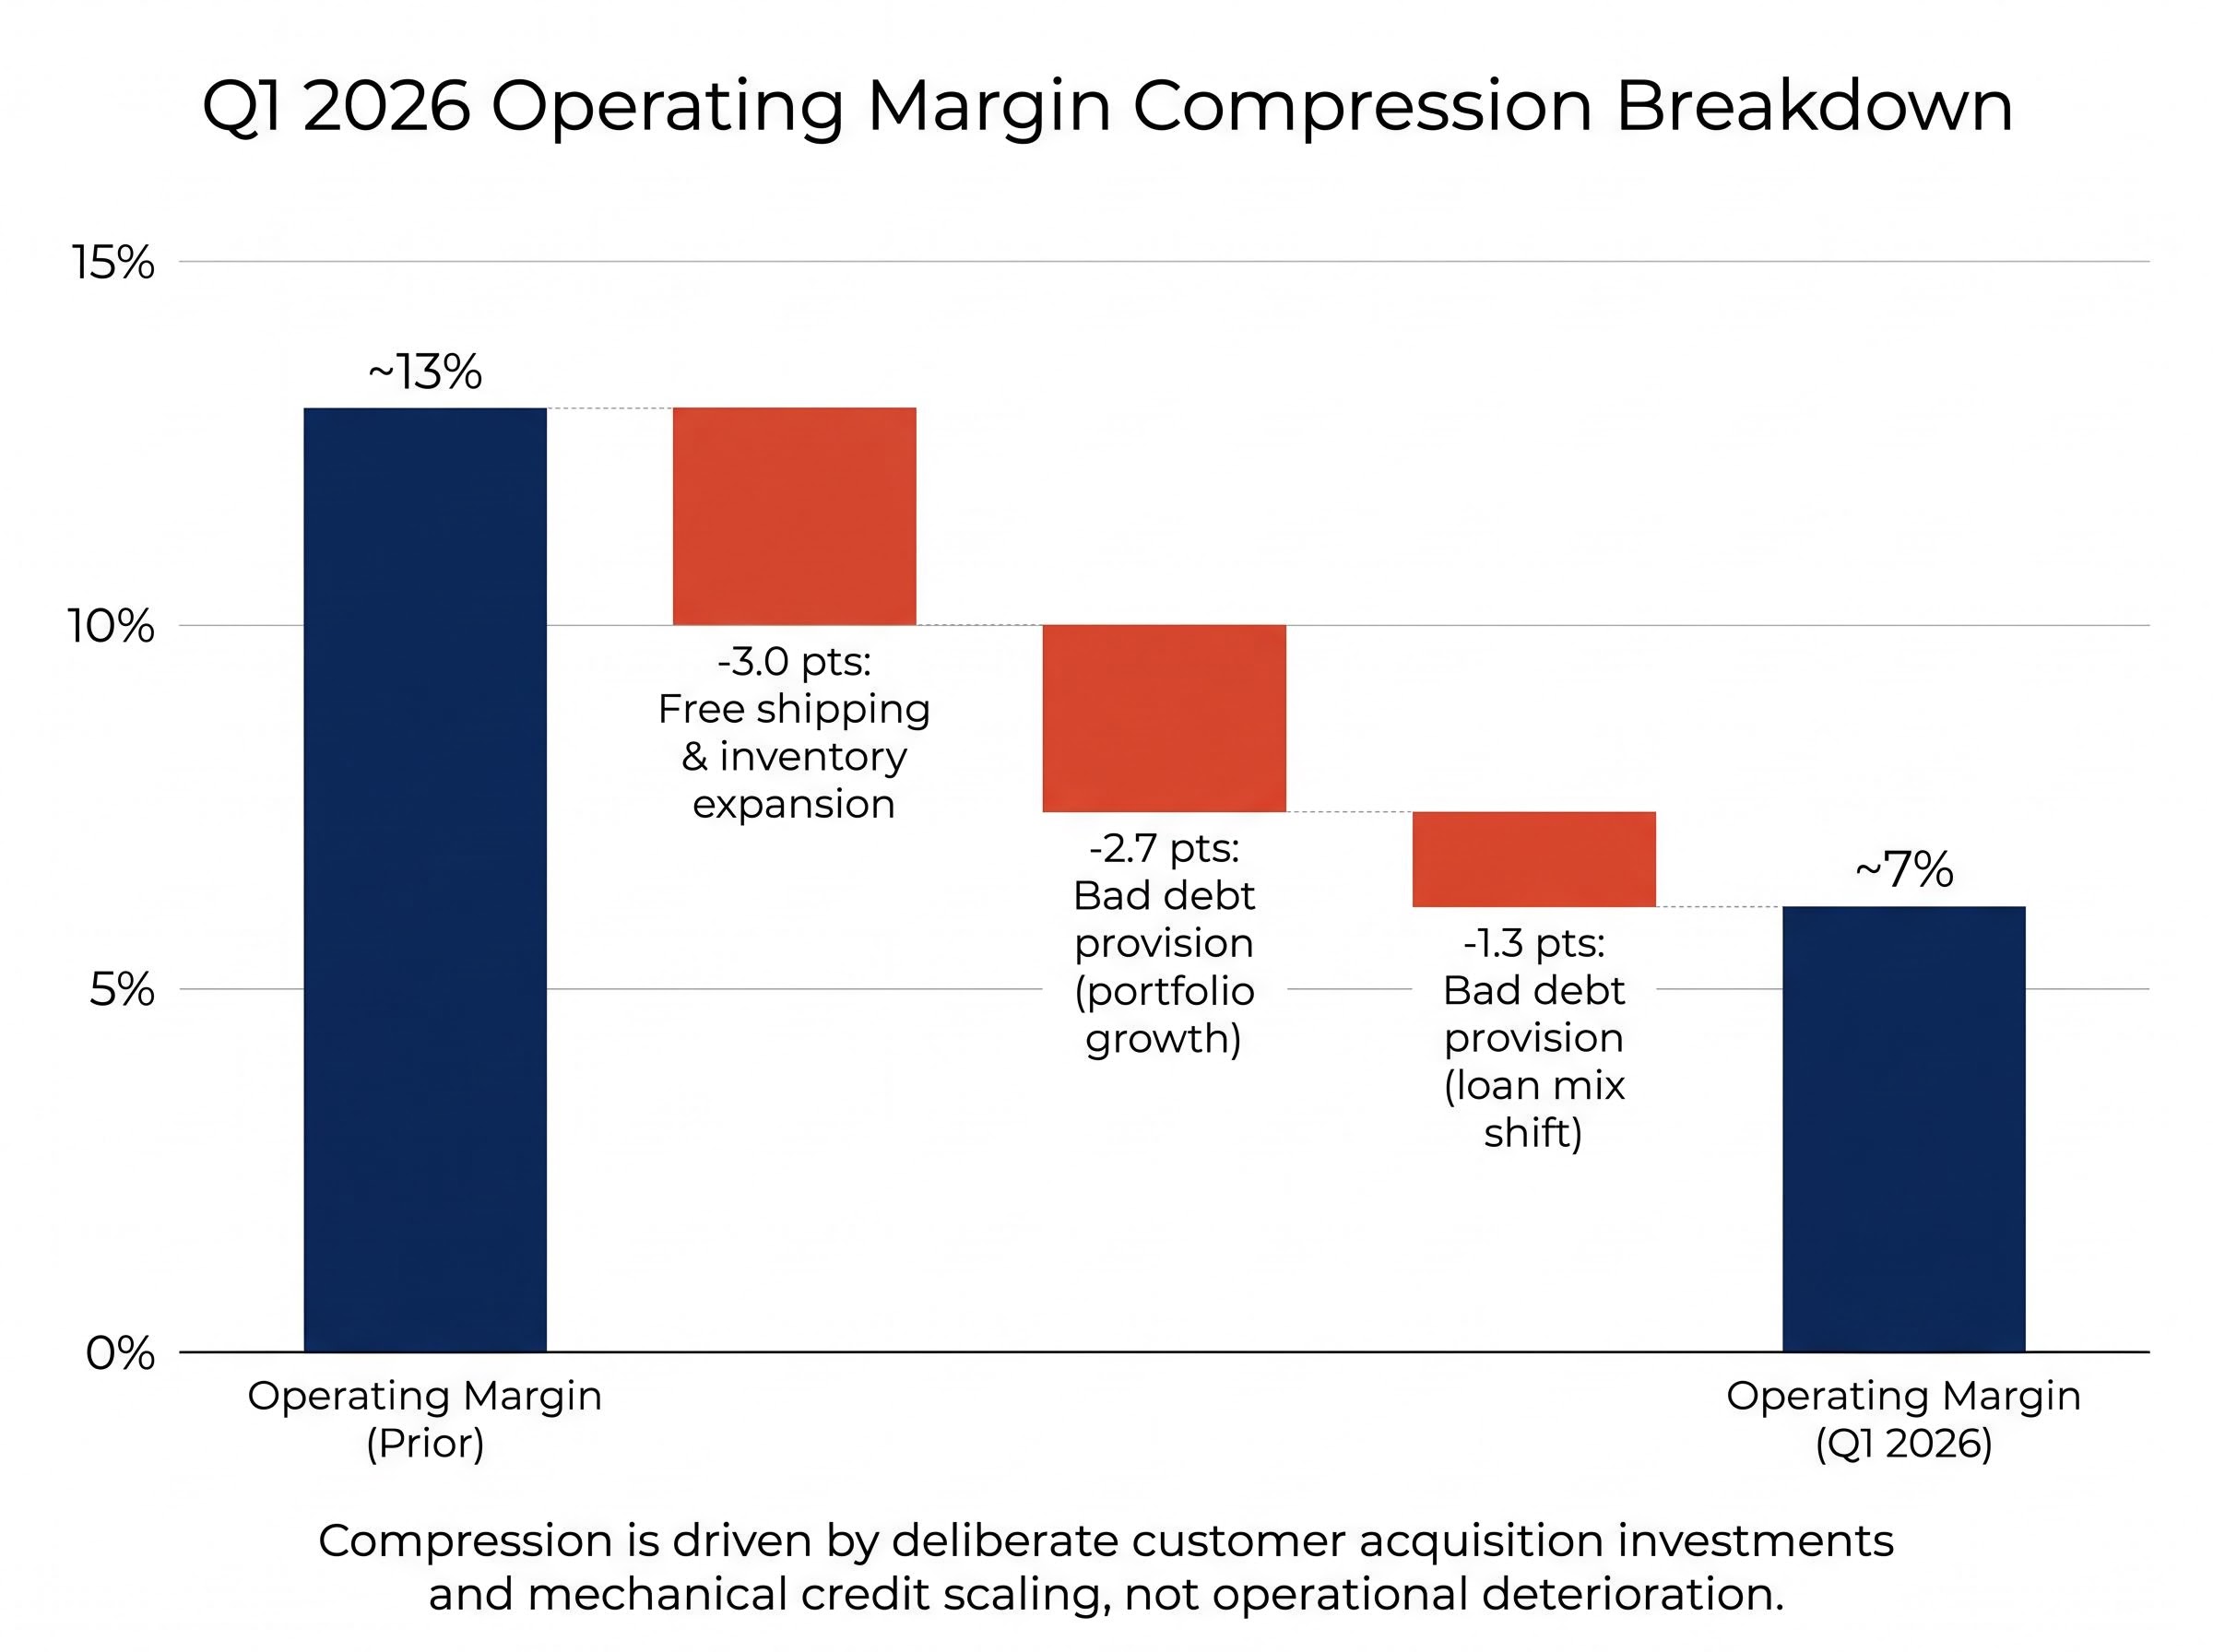
Two-thirds of the bad debt provision increase is attributable to the speed of credit portfolio growth rather than worsening loan quality. The remaining one-third reflects a mix shift toward consumer credit products, which carry higher provision rates by design.
| Margin Driver | Contribution (Percentage Points) | Nature of Cost |
|---|---|---|
| Free shipping and inventory expansion | ~3 pts | Deliberate investment in customer acquisition |
| Bad debt provision (portfolio growth) | ~2.7 pts | Mechanical consequence of rapid credit scaling |
| Bad debt provision (loan mix shift) | ~1.3 pts | Higher provision rates on consumer credit products |
Analyst consensus expects operating margin to recover from 7.8% in FY2026 to 9.2% in FY2027 as Brazilian and Mexican operations scale and investment intensity moderates. The distinction between margin compression caused by investment and compression caused by competitive pressure or loan deterioration is the most consequential analytical call in the MELI thesis right now. The Q1 2026 data supports the former interpretation, but investors should monitor delinquency trends closely in coming quarters.
The pattern of strong earnings triggering a selloff on margin or spending concerns appeared again in May 2026 when Meta’s best quarterly result in years sent the stock down roughly 10%, a structurally similar dynamic to the MELI situation where the market is discounting current-period margin compression rather than pricing the long-run return on investment being made.
The competitive and macro risks U.S. investors need to price in
The bear case against MercadoLibre is not abstract emerging market anxiety. It consists of three specific, quantifiable risk categories.
Competition is intensifying in both commerce and fintech. Amazon launched aggressive free shipping in Brazil with a threshold below R$50 as of April 2026, capturing incremental marketplace share. Shopee reported items sold up 55% year-over-year in Brazil, while simultaneously raising seller fees to test market power. In fintech, Nubank’s Q1 2026 credit portfolio reached $32.7 billion, more than double MercadoLibre’s $14.6 billion book.
Regulatory headwinds are specific and dated. Mexico’s CNBV tightened consumer lending rules effective January 2026, capping unsecured loans at 1.5x borrower income (down from 2x), with a compliance deadline in Q3 2026 that could moderate near-term credit card portfolio growth. In Brazil, Open Finance Phase 3 mandates (effective March 2026) increase competitive access to customer data, potentially eroding one layer of MercadoLibre’s information advantage.
BCB Insights on Open Finance data sharing document a phased rollout that progressively expands which financial institutions must share customer data, with each new phase lowering the information barriers that previously shielded incumbent players from data-driven challengers.
The currency environment adds translation headwinds across all three major markets:
- BRL/USD: approximately 4.90, with Selic at 14.50%
- ARS/USD: approximately 1,395.50, with monthly inflation running above 25%
- MXN/USD: approximately 17.20, with Banxico at 6.50%
FX headwinds shaved approximately 3% off USD revenue in Q1 2026.
| Risk Category | Specific Risk | Key Data Point | Investor Consideration |
|---|---|---|---|
| Competitive | Amazon Brazil free shipping | Threshold below R$50 (April 2026) | Pressures MELI’s fulfilment cost advantage |
| Competitive | Shopee volume growth | +55% YoY items sold in Brazil | Tests MELI’s marketplace share in price-sensitive segments |
| Competitive | Nubank credit scale | $32.7B portfolio vs. MELI’s $14.6B | Nubank holds >2x the credit book in LatAm |
| Regulatory | CNBV lending cap (Mexico) | 1.5x income cap, Q3 2026 deadline | Could constrain near-term credit card growth |
| Regulatory | Open Finance Phase 3 (Brazil) | Mandatory data sharing (March 2026) | Increases competitor access to customer data |
| Currency | BRL, ARS, MXN volatility | ~3% USD revenue drag in Q1 2026 | Ongoing translation headwind for USD-reporting investors |
The trailing P/E of 46.73 and forward P/E of 35.71 mean any execution stumble would compress multiples meaningfully. These risks are real and measurable, not generic LatAm discount factors.
The gap between current price and analyst targets frames the investment question precisely
MercadoLibre trades at approximately $1,633 as of 8 May 2026, against an analyst consensus price target of approximately $2,639, implying roughly 62% upside to consensus.
The analyst consensus stands at Moderate Buy, based on 15 Buy ratings, 1 Strong Buy, 2 Hold, and 1 Sell, with a consensus target of approximately $2,639.
Analyst price target spreads of this magnitude are not unusual for high-multiple platform businesses where scenario inputs diverge sharply on growth duration and margin trajectory; the same four-step framework that explains Tesla’s $475 spread between bear and bull cases applies directly to interpreting why MELI’s consensus sits $1,006 above the current share price.
The valuation multiple context matters. A trailing P/E of 46.73 and forward P/E of 35.71 price in continued high growth, yet the FY2027 EPS estimate of approximately $48.20 is effectively flat versus FY2026’s $48.14, reflecting margin recovery expectations rather than earnings acceleration. FY2026 consensus revenue sits at approximately $38.69 billion.
Segment-level valuation illustrates the gap. If the commerce services business alone (third-party fees and advertising, excluding lower-margin first-party sales) is valued conservatively at a 15-17x forward earnings multiple with 15% assumed growth, and the fintech division separately at a 15x multiple with 20% assumed growth, both produce valuations materially above the current market capitalisation of approximately $82.78 billion.
| Valuation Scenario | Implied Market Cap | Implied Per-Share Price | Upside from Current $1,633 |
|---|---|---|---|
| Low Case (conservative segment multiples) | ~$120 billion | ~$2,365 | ~45% |
| Base Case (analyst consensus) | ~$134 billion | ~$2,639 | ~62% |
| High Case (bull scenario) | ~$152 billion | ~$2,995 | ~83% |
Institutional positioning supports the constructive read. Vanguard boosted its position to 219,309 shares in Q4 2025 (most recently confirmed), while BlackRock held 1.42 million shares as of 31 December 2025. YTD performance stands at +18.93%. The gap between current price and consensus appears to reflect broader LatAm sentiment and margin concerns rather than a fundamental reassessment of business quality.
Q1 2026 is a checkpoint, not a verdict, but the evidence leans one way
The Q1 2026 data shows a business accelerating on every operational metric that matters for long-term value creation: buyer growth, delivery speed, credit volume, and payment processing. The margin decline is attributable to investment choices that the data validates rather than competitive pressure or deteriorating loan quality.
The uncertainties are real. Currency volatility in Brazil and Argentina is not resolving, the CNBV compliance deadline in Mexico creates a near-term credit growth headwind, and a trailing P/E of 46.73 leaves limited room for execution missteps.
Three monitoring points for U.S. investors over the next two quarters:
- Margin recovery trajectory: whether operating margin stabilises above 7% in Q2-Q3 2026, supporting the FY2027 consensus recovery to 9.2%
- Delinquency ratios: confirmation that both past-due metrics hold steady or improve as the credit book scales through the second half of 2026
- CNBV compliance impact: the Q3 2026 deadline will provide the first measurable read on how lending caps affect Mexico credit card origination volumes
The approximately 62% gap between the current share price of roughly $1,633 and the consensus target of approximately $2,639 frames the investment question with precision. The structural moat argument is stronger after Q1 2026 than before it. For U.S. investors, the decision ultimately rests on risk tolerance for LatAm macro exposure rather than doubt about the underlying business quality. The next round of 13F filings in August 2026 will provide updated institutional positioning data to confirm or challenge that reading.
This article is for informational purposes only and should not be considered financial advice. Investors should conduct their own research and consult with financial professionals before making investment decisions. Past performance does not guarantee future results. Financial projections are subject to market conditions and various risk factors.