At a forward price-to-earnings ratio of nearly 189x, Tesla is not being priced as a car company. It is being priced as a bet that robotaxis, humanoid robots, and autonomous software will collectively generate enough earnings to justify a $1.5 trillion market capitalisation. That bet may pay off. It may not. The price paid to participate in it is one of the most consequential variables in the entire stock valuation analysis.
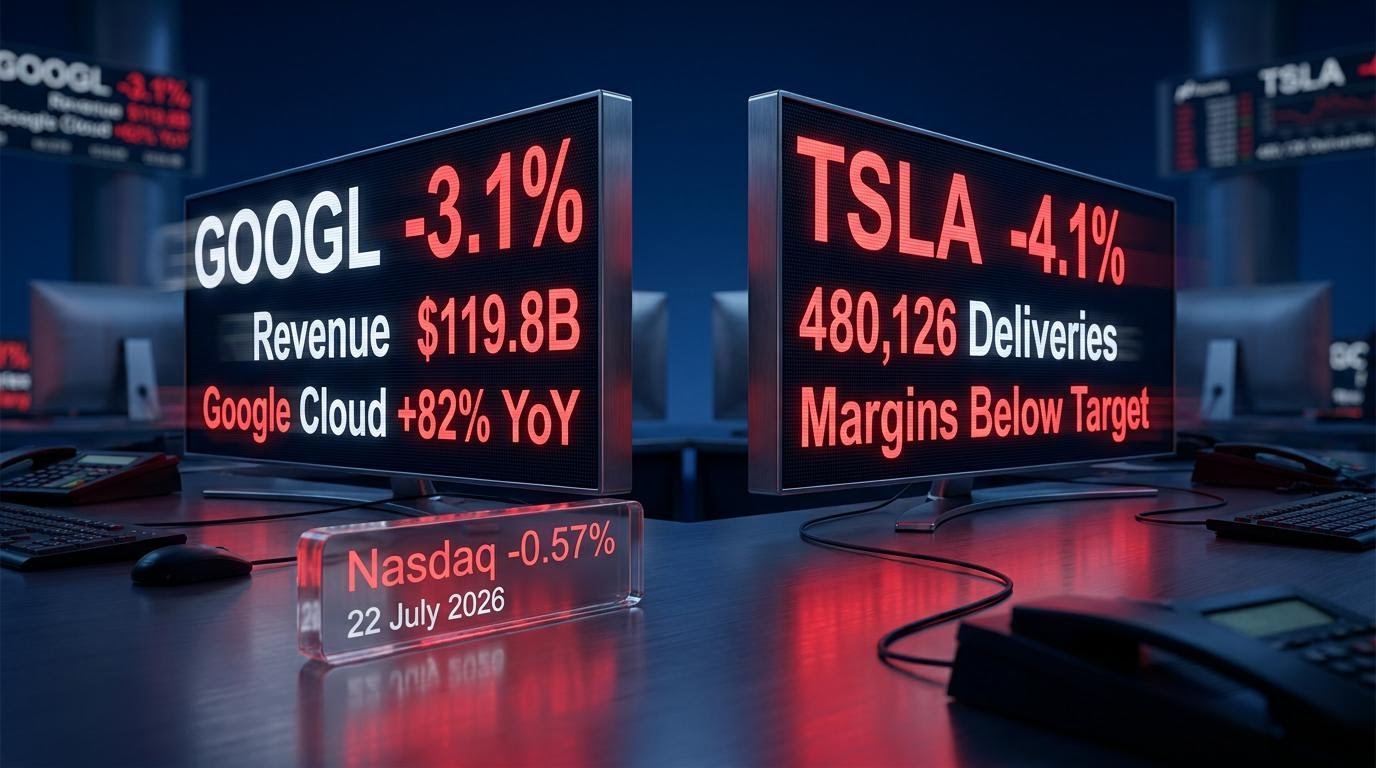
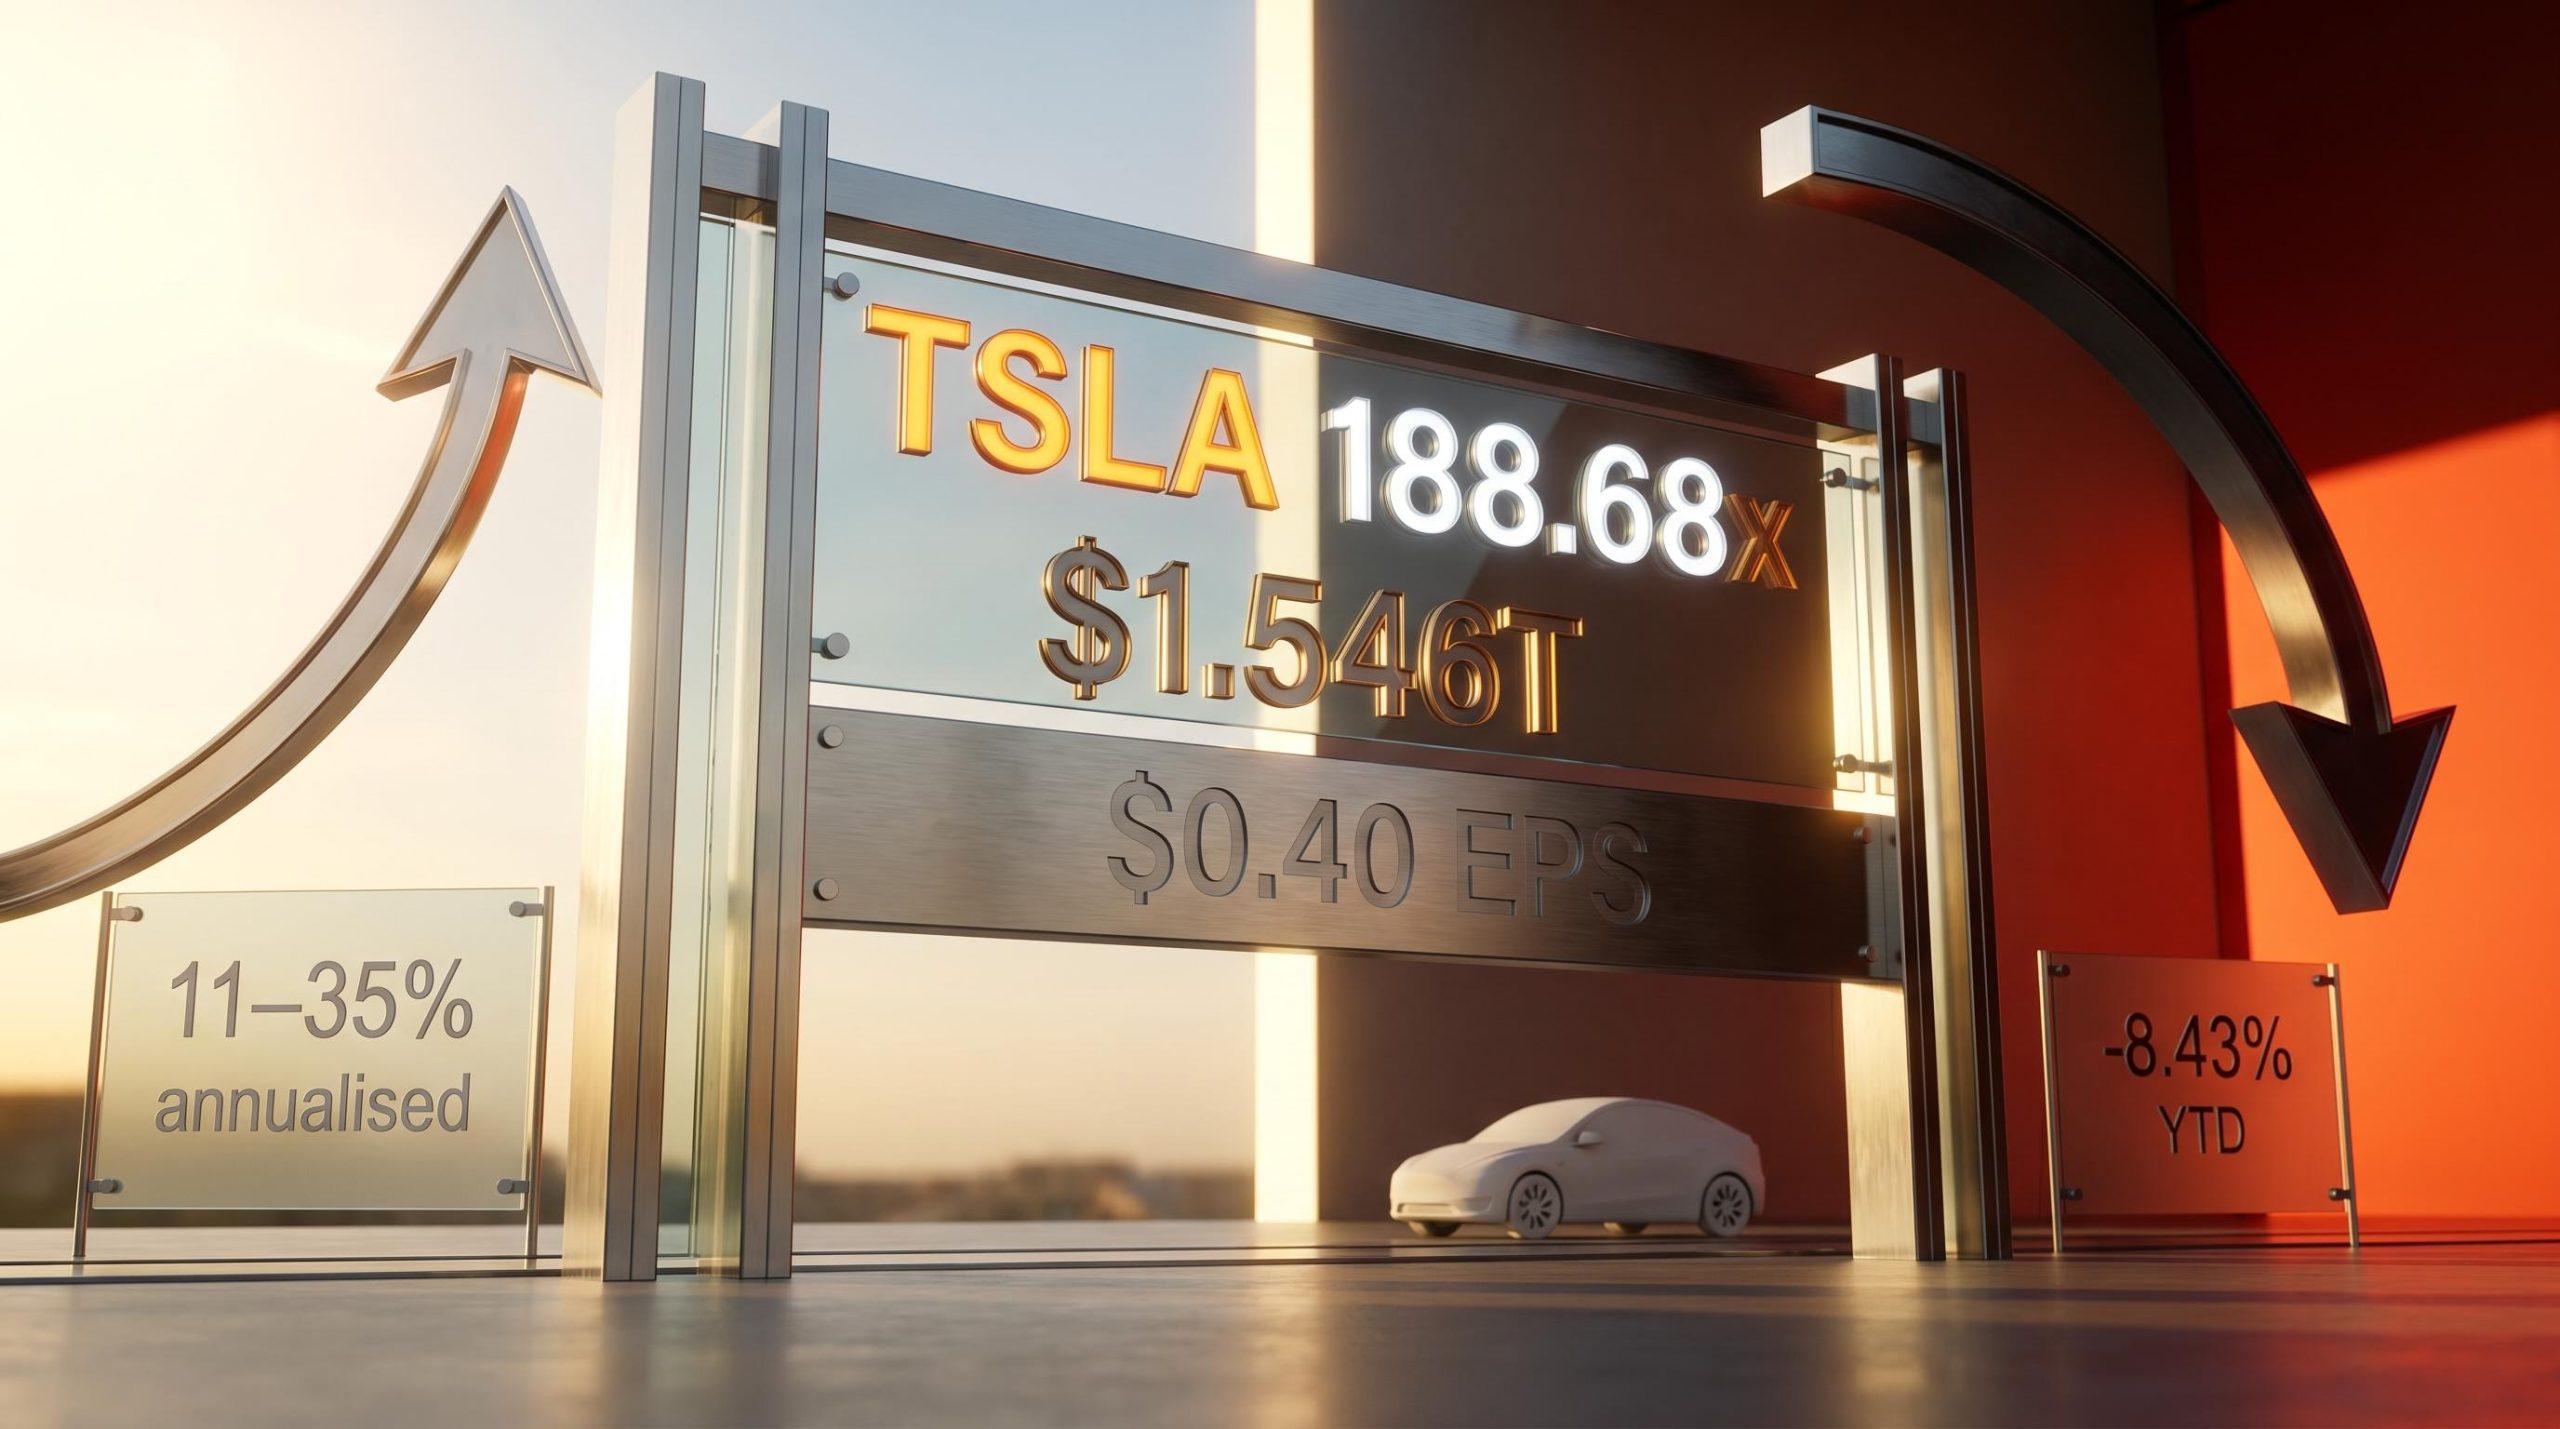
Tesla’s Q1 2026 earnings, reported 22 April 2026, beat analyst forecasts on revenue ($22.4 billion, up 16% year-over-year), earnings per share ($0.40 vs. $0.35 consensus), and gross margin (21.7% vs. a projected 17%). Yet the stock has still underperformed the S&P 500 year-to-date: -8.43% vs. roughly +7% for the index. That tension between strong near-term results and a still-uncertain long-term story is precisely what makes Tesla a useful teaching case for investors learning how to think through a company in transition.
This guide uses Tesla’s current valuation as a concrete, working example to teach the framework investors need whenever they encounter a stock where the price reflects a future that has not yet arrived: how to build bull and bear scenarios, how to translate growth and margin assumptions into return projections, and why entry price determines so much of the outcome.
Why companies in transition break traditional valuation tools
The first instinct is familiar. Check the P/E ratio. Compare it to peers. Ford and GM trade at 5-10x earnings. Tesla trades at 188.68x forward earnings with a market capitalisation of $1.546 trillion as of 7 May 2026. The comparison is structurally meaningless.
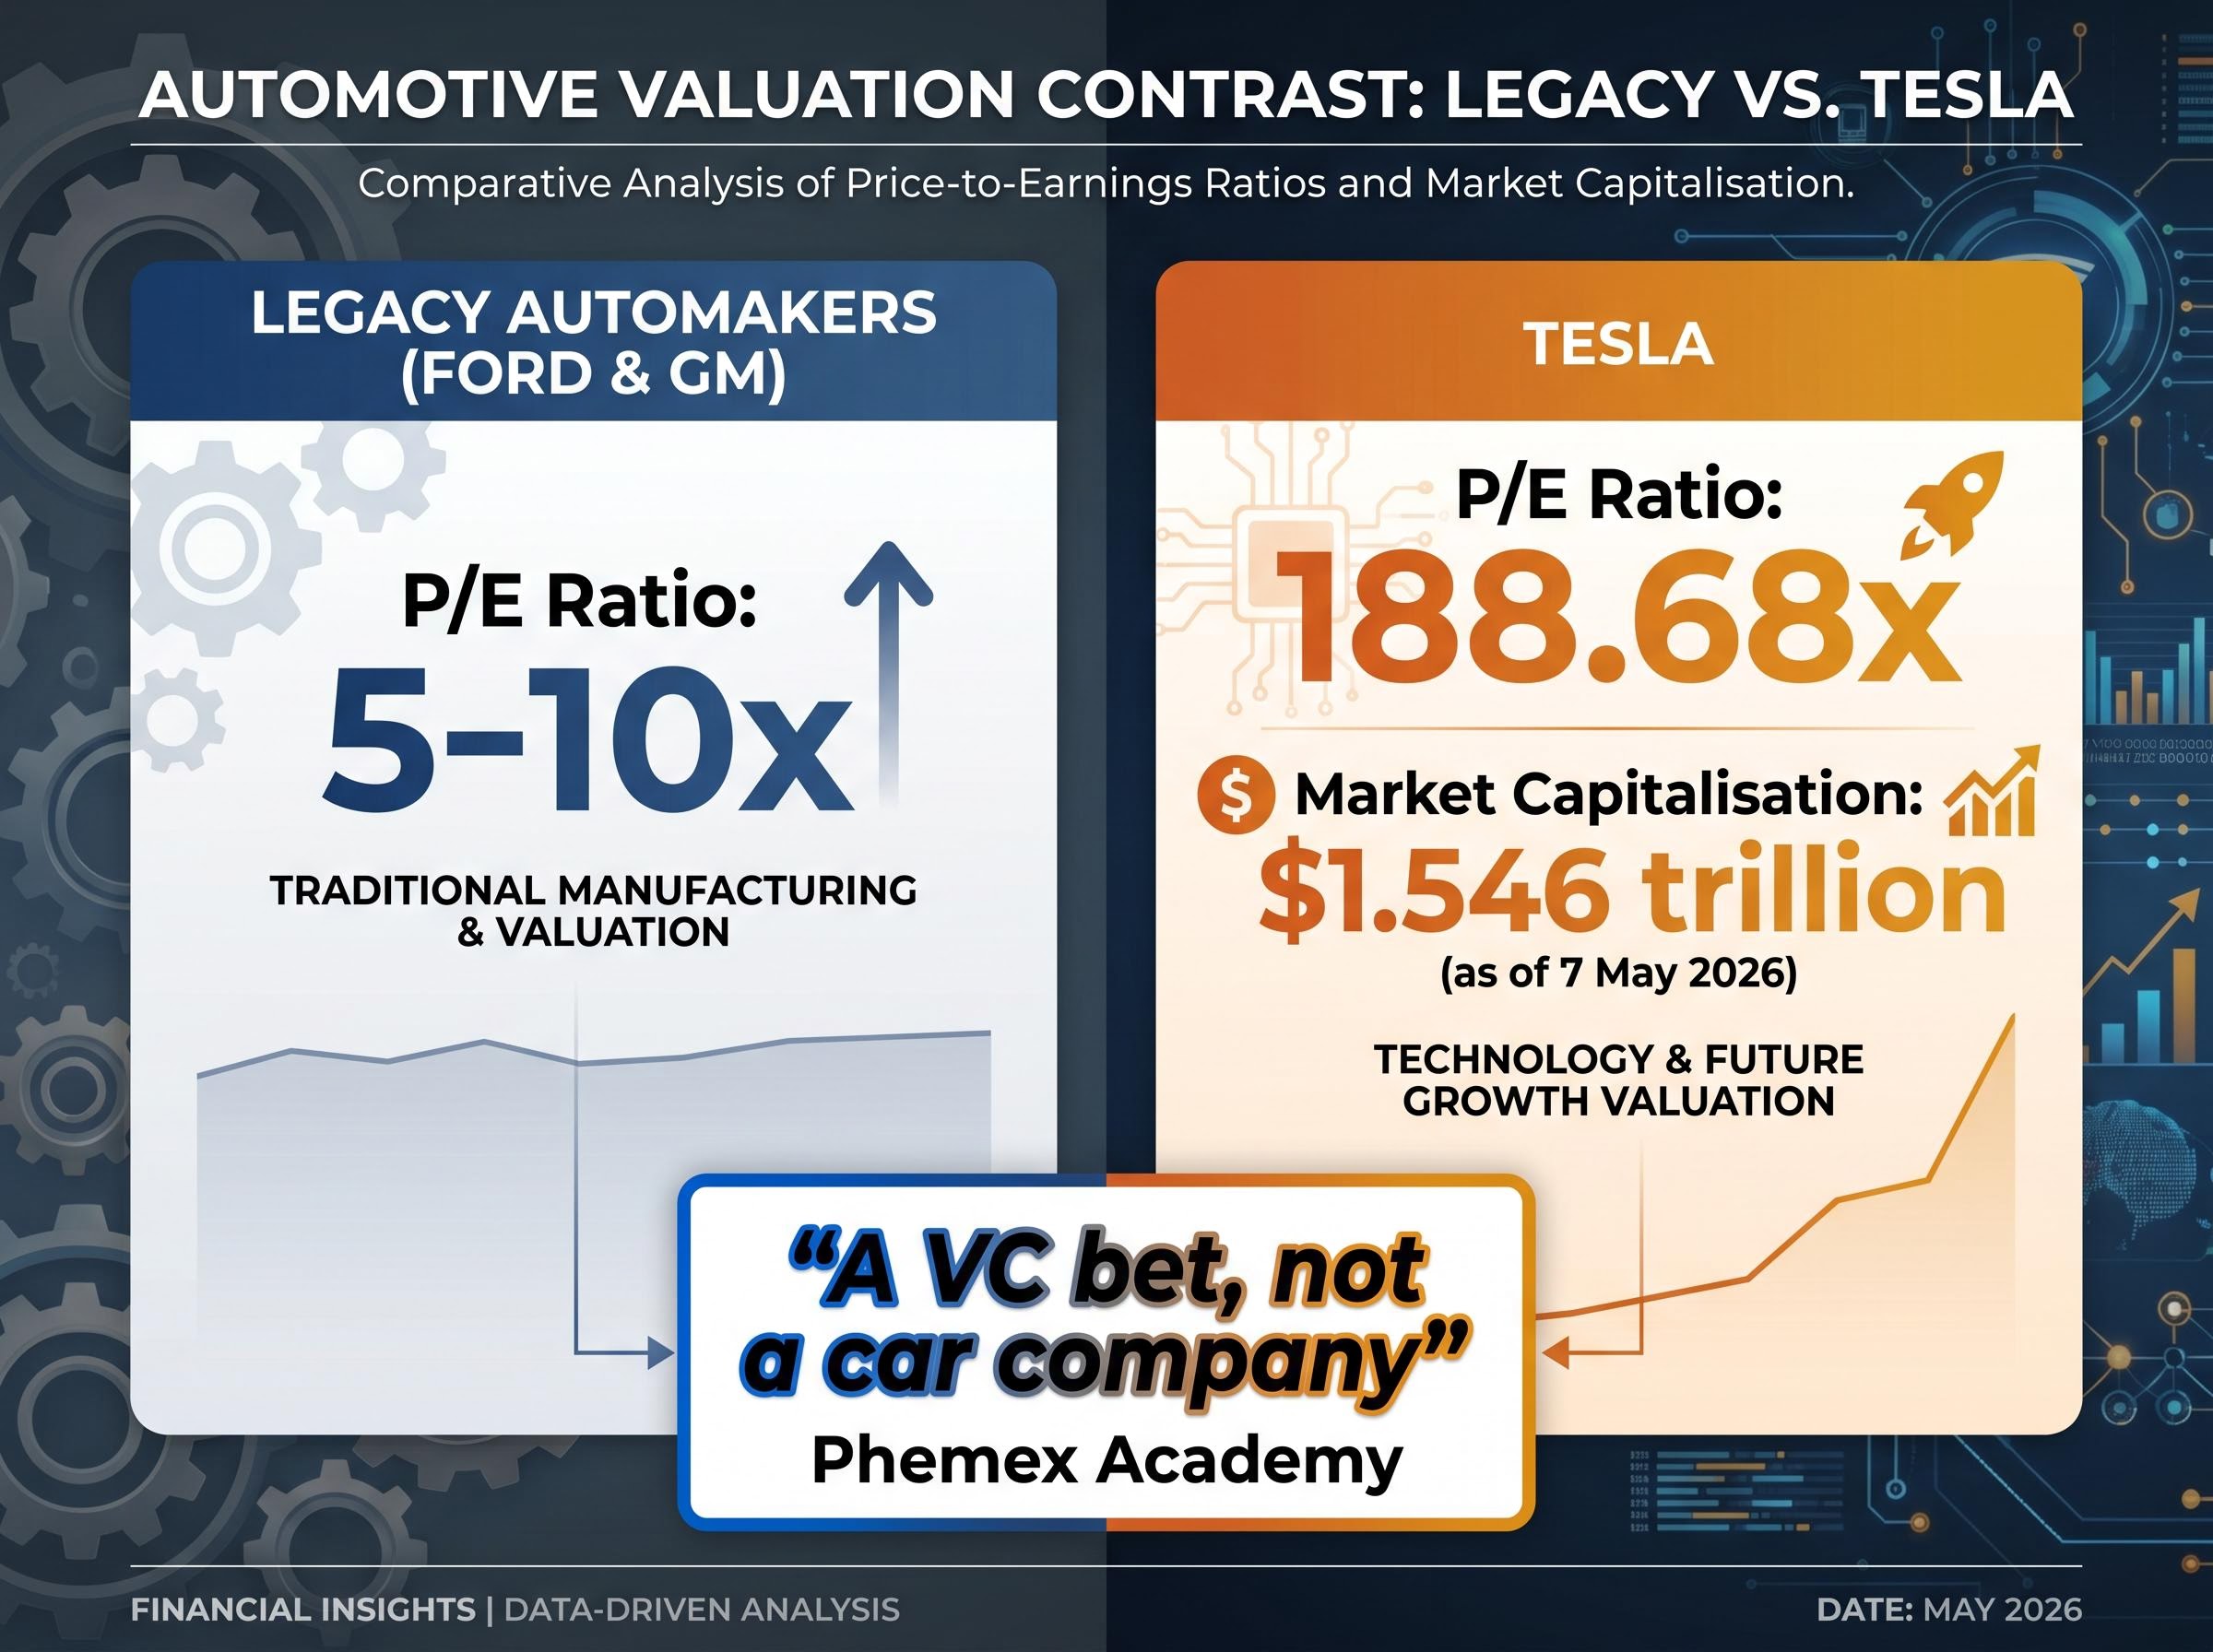
It is meaningless because the two sides of the comparison are measuring different things. Legacy automaker multiples reflect mature businesses with predictable revenue, stable margins, and limited optionality. Tesla’s multiple reflects a market that is assigning probability-weighted value to businesses that do not yet appear in the company’s financial statements: a commercial robotaxi network, a humanoid robot platform, and an autonomous software licensing model.
This is the core problem with backward-looking metrics applied to transition-stage companies. When the stock price is pricing in a future business that does not yet exist in the financials, traditional tools produce misleading conclusions in both directions. A value investor sees a 189x P/E and concludes the stock is absurdly overvalued. A growth investor sees revenue acceleration and concludes the multiple is justified. Both are anchoring to incomplete information.
Phemex Academy characterises Tesla as “a VC bet, not a car company,” a framing that captures the analytical challenge. The stock is not priced on what Tesla earns today. It is priced on what Tesla could earn if several high-variance bets pay off simultaneously.
What traditional valuation metrics measure versus what they miss on optionality-driven companies:
- What they measure: current earnings, historical growth rates, peer comparisons based on existing business lines, trailing margins
- What they miss: the probability-weighted value of new business lines not yet generating revenue, the margin profile of software and services platforms that do not yet exist at scale, the compounding effect of market capture in winner-take-most categories
Understanding why standard tools break down on transition-stage companies is the prerequisite for everything that follows. Investors who skip this step routinely misprice both the upside and the downside.
When big ASX news breaks, our subscribers know first
The anatomy of a scenario-based valuation: three variables that determine everything
Any forward-looking valuation of a transition-stage company rests on three interacting variables. Each one maps onto a different kind of business risk, and the interaction between them, not any single input in isolation, is what produces the range of outcomes investors need to understand.
Revenue growth rate reflects market capture risk. For Tesla, the question is whether autonomous mobility and humanoid robotics open addressable markets large enough to sustain 20-35% annual revenue growth (the bull case midpoint of 27%), or whether competition, regulation, and execution friction limit growth to 6-12% (the bear case midpoint of 9%). The gap between those two assumptions is the gap between a company that dominates new categories and one that remains primarily an electric vehicle manufacturer.
Net profit margin reflects execution and competitive risk. Bull case margins of 20-30% assume Tesla achieves software-like profitability on its autonomous and robotics platforms. Bear case margins of 8-14% assume the company remains hardware-heavy, with competitive pricing pressure compressing returns. Notably, even the bear case margin range exceeds what traditional automakers like Ford and GM achieve, reflecting Tesla’s brand positioning and software integration advantages.
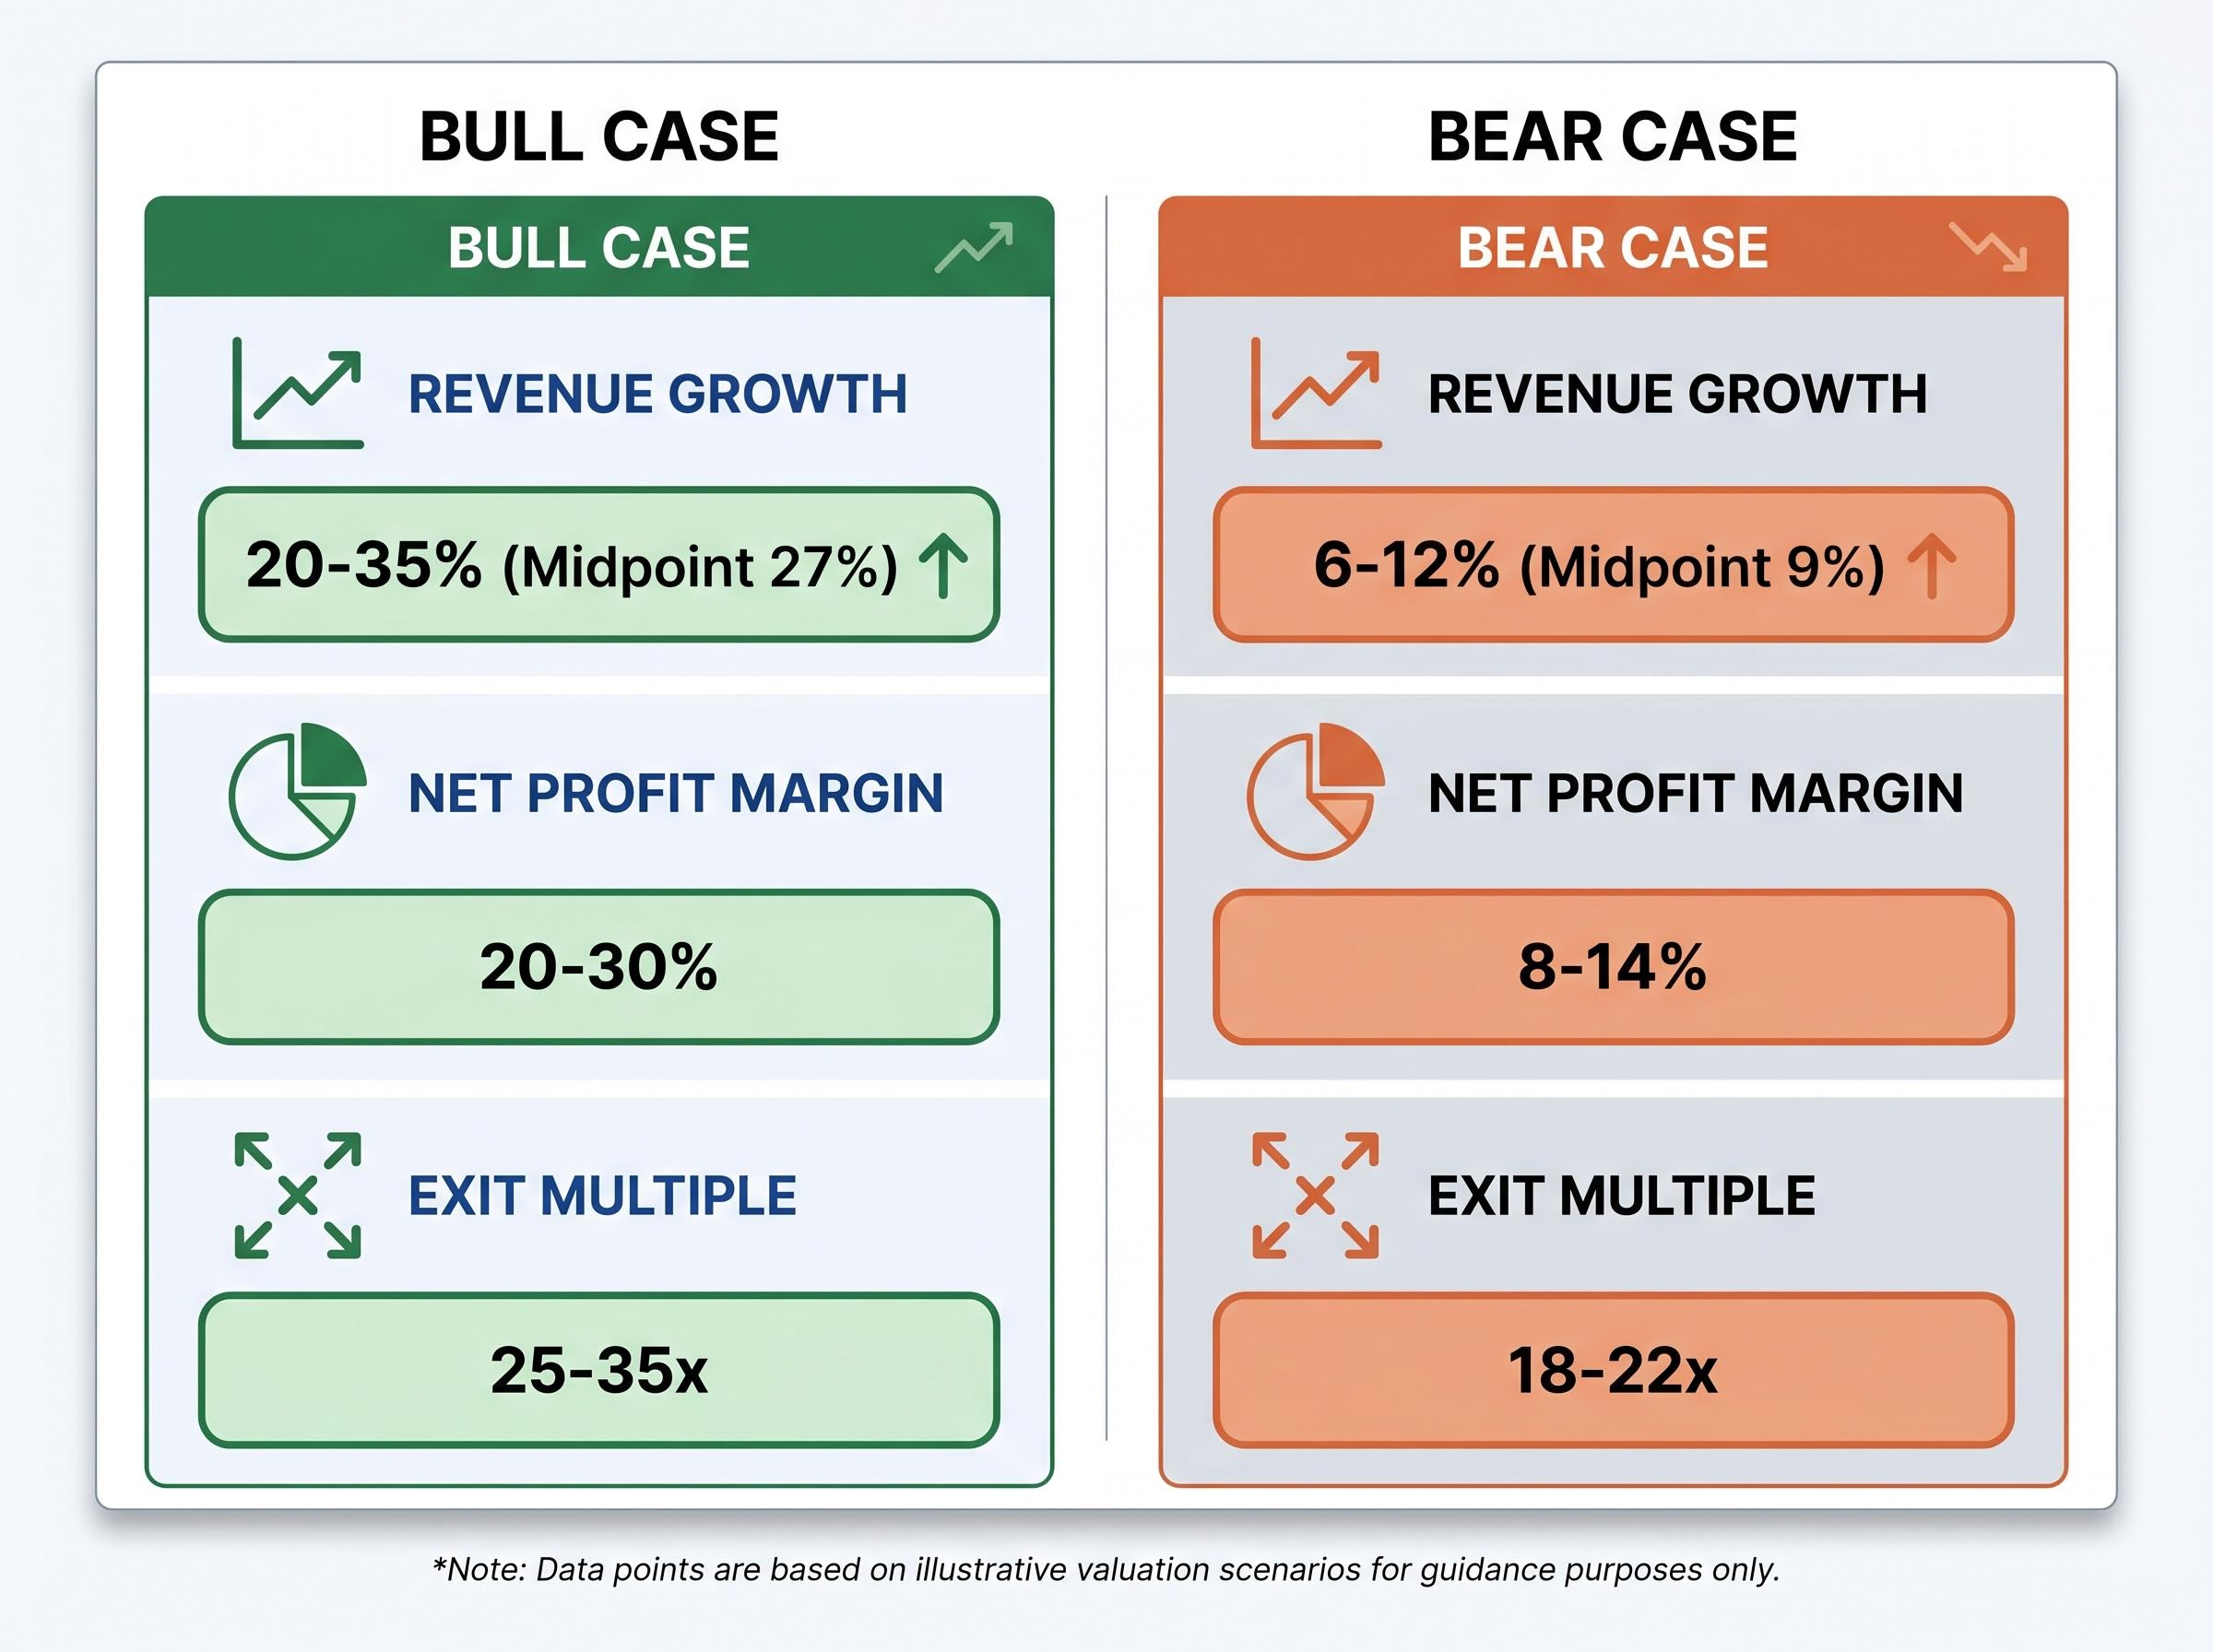
Exit multiple reflects what future investors will pay for Tesla’s earnings stream at the end of the projection period. A 25-35x exit multiple (bull case) assumes the market continues to value Tesla as a technology platform. An 18-22x exit multiple (bear case) assumes a re-rating toward industrial or automotive peer levels.
The NYU Stern DCF framework for high-growth firms, developed by valuation scholar Aswath Damodaran, addresses precisely this problem: how to adjust discount rates as a growth company matures, how to prevent terminal value from swamping the entire model, and how to connect the narrative assumptions about a company’s future to the specific numbers inside a discounted cash flow analysis.
How the three variables interact to produce return outcomes
| Variable | Bull case | Bear case | What it assumes about Tesla’s transformation |
|---|---|---|---|
| Revenue growth (annual) | 20-35% (midpoint 27%) | 6-12% (midpoint 9%) | Bull: robotaxi and Optimus open massive new TAMs. Bear: core EV growth decelerates. |
| Net profit margin | 20-30% | 8-14% | Bull: software-like margins on autonomous platforms. Bear: hardware-heavy, competitive margin pressure. |
| Exit multiple | 25-35x | 18-22x | Bull: market values Tesla as a tech platform. Bear: re-rating toward auto/industrial peers. |
Stacking bull case assumptions across all three variables produces an estimated annualised return range of 11-35% over a 10-year horizon. Stacking bear case assumptions at current prices produces negative projected returns. The same company, the same future, but two entirely different investment outcomes depending on which set of assumptions proves closer to reality.
What the bull case actually requires Tesla to become
The bull case return range of 11-35% annualised over a decade is real. It is also conditional on a specific sequence of operational achievements, each of which must materialise in roughly the right order and at roughly the right scale.
The execution requirements, in the order they must be met:
- Full autonomous driving capability at scale. Tesla’s autonomous vehicle miles nearly doubled year-over-year in Q1 2026, and robotaxi operations have expanded to Austin, Dallas, and Houston. No meaningful revenue has been recognised from these operations yet. The technology must progress from supervised to fully unsupervised operation across diverse geographies.
- Commercial robotaxi network generating material revenue. Expansion into three Texas cities represents a pilot footprint. The bull case requires this to scale into a commercial network generating billions in annual revenue, at margins that reflect a software and services business rather than a vehicle leasing operation.
- Optimus robots deployed to third-party businesses by approximately 2027. The Optimus V3 production is targeted for late July to early August 2025, with third-party commercial availability projected for 2027. If Optimus achieves software-like margins (20-30%), that margin profile is what justifies the 25-35x exit multiple in the bull case.
Elon Musk has characterised Optimus as “potentially the largest product ever brought to market.”
The ARK Invest framework, published 15 April 2022 as an open-source Monte Carlo model available on GitHub, represents the primary publicly documented methodology that assigns scenario probabilities to these outcomes. ARK’s model assigned roughly a 25% probability to the full bull case materialising. The model’s $5,800 bull case target from 2022 predates current market conditions, but the methodological approach, assigning explicit probabilities to discrete scenarios, remains directly applicable.
Knowing what the bull case requires makes it possible to monitor whether reality is tracking toward it or diverging from it. That monitoring capacity is how investors decide whether to add, hold, or exit a position over time.
What the bear case reveals about the price already paid
The bear case is not a collapse scenario. It is the possibility that Tesla remains an excellent electric vehicle company with a growing energy division but never generates meaningful autonomous or robotics revenue. Under those assumptions, the current share price tells a specific story about what investors have already paid for.
At approximately $375-$415 per share, the bear case assumptions produce negative projected returns across every modelled outcome. This is the most important number in the analysis. It means that investors buying at current prices are paying for the AI transformation whether they intend to or not. There is no entry point near today’s price where the bear case produces a positive return.
DCF intrinsic value estimates for Tesla, such as AlphaSpread’s model placing fair value at $70.79 per share, represent the discounted present value of expected future cash flows under conservative assumptions rather than optionality-driven market pricing, and the gap between that figure and the current share price is a direct measure of how much transformation the market has already priced into the stock.
The $25 billion+ capital expenditure guidance for 2026, with consensus estimates shifting directionally toward approximately -$5.1 billion in free cash flow (an unverified directional estimate), reinforces this point. Tesla is spending as if the transformation is certain. The bear case asks: what if it is not?
A partial offset exists. The energy generation and storage segment delivered $12.7 billion in revenue during FY2025, up 27% year-over-year, at approximately 30% gross margins. This is a genuine, profitable growth business. But it is not large enough to justify a $1.5 trillion market capitalisation on its own.
The specific execution failures or missed milestones that would keep Tesla in the bear case:
- Regulatory delays preventing unsupervised robotaxi operations beyond limited Texas geographies
- Autonomous driving technology failing to achieve Level 4 capability (fully driverless in defined conditions) at commercial scale
- Optimus commercial deployment slipping past 2027 or failing to attract third-party enterprise contracts at scale
- Competitive pressure from Waymo, Figure, Boston Dynamics, and legacy OEMs narrowing Tesla’s technology advantages
The consensus analyst rating as of May 2026 is “Hold” from 41 analysts, with an average price target of $406.65 and a range spanning $25 to $600. That $575 spread is not analytical failure. It is a direct expression of genuine scenario uncertainty.
Why timeline slippage is a financial variable, not just a narrative risk
Elon Musk’s history of ambitious timelines is well documented: the 2016 claim that all Tesla vehicles had full self-driving hardware, the 2019 prediction of one million robotaxis by 2020, the 2021 projection of Optimus deployment by 2022. Each missed deadline is more than a narrative disappointment. A 2-3 year delay in robotaxi or Optimus revenue recognition changes the discounted present value of those cash flows materially, because money earned further in the future is worth less today. Timeline slippage is not a qualitative concern. It is a quantifiable financial variable.
Why entry price is the variable investors control most
The same company, the same bull and bear case assumptions, and three different entry prices produce three fundamentally different investment experiences.
| Entry price | Bull case (10-year annualised) | Bear case (10-year annualised) | Implied requirement |
|---|---|---|---|
| $100 (a few years prior) | Strong positive returns | Modest positive to flat | Significant margin of safety; bear case is survivable |
| $250 | Solid positive returns | Approximately breakeven to slightly negative | Some margin of safety; partial transformation required |
| $415 (current, May 2026) | 11-35% annualised | Negative across all modelled outcomes | Full transformation required just to justify current price |
At current prices, every projected bear case outcome is negative. The investor buying at $415 is implicitly betting that the bull case, or something very close to it, will materialise.
At $411.79 as of 7 May 2026, forward earnings per share estimates would need to grow more than 5x from current levels for the valuation to normalise toward historical technology company multiples. That is the weight of the entry price.
The concept of margin of safety, the buffer between the price paid and the price that would need to materialise for the investment to work, is relevant for any stock but is especially consequential for high-multiple, high-optionality names. An investor who bought at $100 a few years ago has margin of safety. An investor buying at $415 does not.
The concept of margin of safety is especially consequential in a market where the Buffett Indicator has reached 223.6%, approximately 2.4 standard deviations above its long-run historical trend, a level that reinforces why paying careful attention to entry price is not merely a Tesla-specific concern but a discipline that applies across US equities in 2026.
Investors do not control whether Tesla’s autonomous future materialises. They do not control regulatory timelines, competitive dynamics, or technological breakthroughs. Entry price is the one variable that is entirely within an investor’s control, and it determines how much transformation is required just to earn a satisfactory return.
The framework beyond Tesla: applying scenario thinking to any company in transition
The Tesla case study illustrates a methodology that applies whenever a stock’s current multiple cannot be justified by existing financials alone. Early-stage technology companies, platform businesses undergoing pivots, and legacy companies attempting category reinvention all present the same analytical challenge.
The framework distils into a four-step process:
- Identify what transformation is priced in. Compare the current market capitalisation to what the existing business can support. The gap is the optionality premium. For Tesla, that gap represents the market’s probability-weighted bet on robotaxis, Optimus, and autonomous software.
- Define discrete scenarios with specific variable assumptions. Build a bull case, a bear case, and a base case (partial execution). The analyst consensus spread of $25 to $600 from 41 analysts illustrates the range that genuine scenario uncertainty produces.
- Model return outcomes for each scenario at the current entry price. The same future looks entirely different depending on the price paid today. This step makes entry price sensitivity explicit rather than implicit.
- Assess whether the probability-weighted expected return is attractive relative to the risk. ARK Invest’s open-source Monte Carlo model on GitHub provides a practical resource for investors who want to build their own probability-weighted scenario models.
Converting three narrative scenarios into a single probability-weighted expected return forces a discipline that ranges of outcomes alone do not: the investor must state, explicitly, how likely they believe each scenario to be, which often reveals that the headline bull case return is less relevant than the blended return across all three cases weighted by honest probability estimates.
A realistic third scenario, the “between the scenarios” base case, is worth modelling explicitly. In this outcome, Tesla achieves partial execution on autonomous and robotics (perhaps one city-scale robotaxi operation generating material revenue, Optimus deployed internally but not yet at third-party commercial scale) while the core auto and energy businesses continue growing. Most real outcomes fall somewhere between the extremes.
When to update your scenario assumptions
Scenario models are not static. Specific operational milestones should act as triggers to revisit and update assumptions: the first robotaxi city generating material revenue, signed Optimus commercial contracts with third-party enterprises, autonomous vehicle regulatory permits filed in California. Each milestone, hit or missed, shifts the probability weightings and turns the framework into an ongoing monitoring tool rather than a one-time analysis.
For investors who want to go further than the three-variable scenario framework, our dedicated guide to execution risk beyond the scenario model examines the specific competitive benchmarks, including Waymo’s approximately 2 million paid rides completed by March 2026, that allow investors to track whether Tesla’s autonomous thesis is gaining or losing ground against rivals operating at commercial scale today.
The price of optimism: what Tesla’s valuation teaches about buying transformation early
Stocks pricing in transformations that have not yet occurred are neither obviously good nor obviously bad investments. They are investments where entry price and scenario clarity determine almost everything.
The Tesla case makes this concrete. The bull case annualised returns of 11-35% are real and achievable if the transformation materialises. The bear case returns, negative at current prices, are equally real if it does not. The company’s Q1 2026 earnings demonstrated strong operational execution. The stock’s -8.43% year-to-date performance against the S&P 500’s +7% gain demonstrates that execution alone is not enough when the price already reflects a far larger story.
Before buying any high-multiple company in transition, the investor’s task is to articulate which scenario they are implicitly betting on, what that scenario specifically requires, and whether the price they are paying provides any margin for error. That discipline, applied consistently, is worth more than any single stock call.
This article is for informational purposes only and should not be considered financial advice. Investors should conduct their own research and consult with financial professionals before making investment decisions. Past performance does not guarantee future results. Financial projections are subject to market conditions and various risk factors.