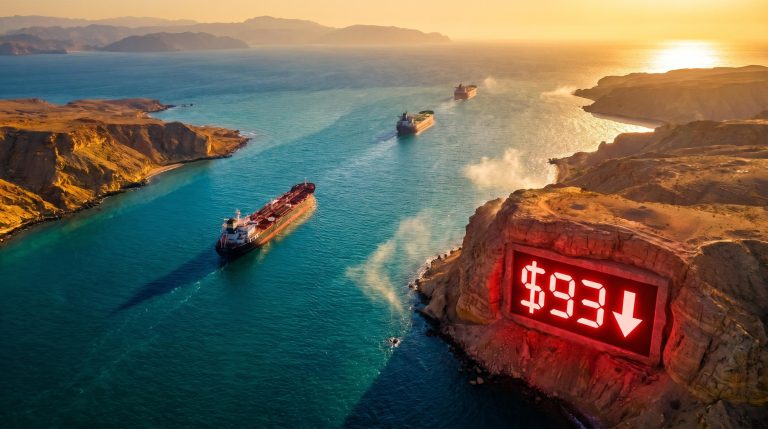
Crude Drops 4% on Hormuz Hopes, but the Deal Isn’t Done
8 hrs ago

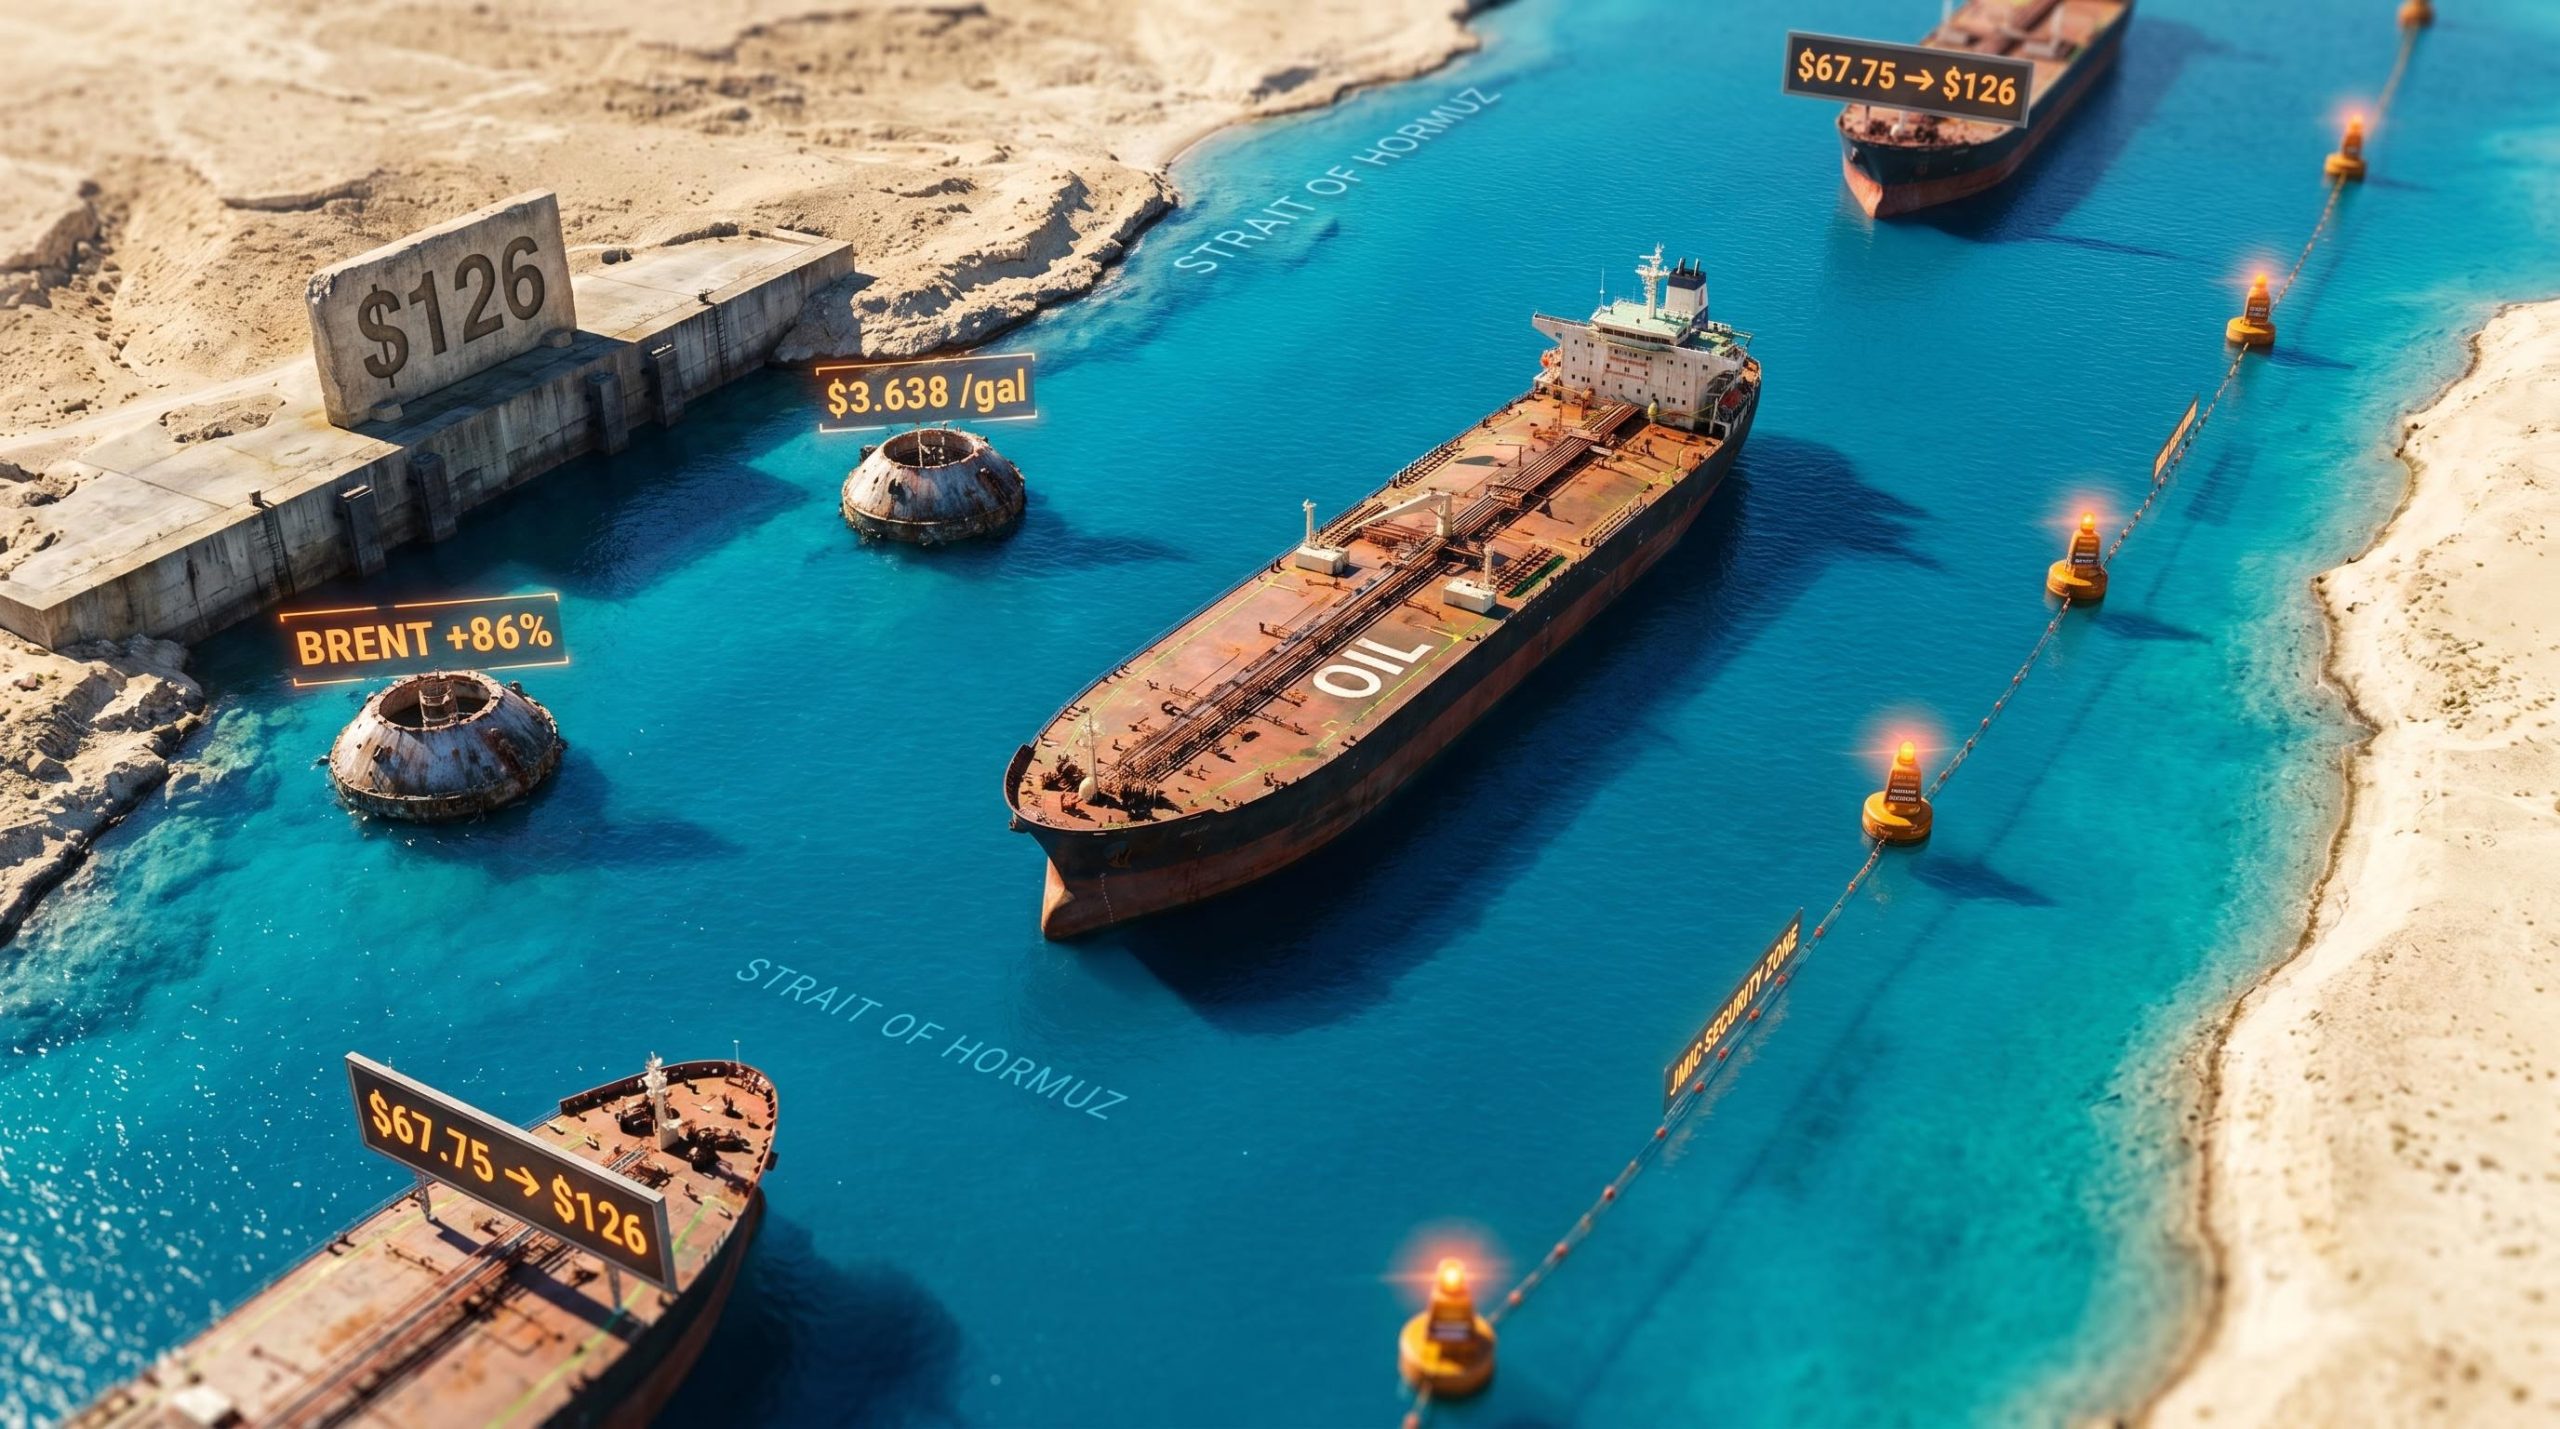
One-fifth of the world’s oil passes through a waterway roughly 33 kilometres wide at its narrowest navigable point. Since late February 2026, that waterway has sat at the centre of a US-Iran military standoff that has driven Brent crude from $68 to a wartime high above $126 per barrel in just over two months.
The Strait of Hormuz conflict is no longer a distant geopolitical abstraction. With the standoff now entering its third month, American consumers are paying the highest gasoline prices since September 2023, the Federal Reserve is navigating its most contentious rate environment in decades, and economists are watching incoming data this week for signs that the shock is filtering into hiring and household confidence.
What follows maps how a regional military deadlock translates into real economic consequences for American households, businesses, and portfolios, covering the mechanics of the price transmission, the current state of diplomatic and military tensions, and what incoming data tells investors about where the US economy stands.
Before a single price chart enters the picture, the geography matters. The Strait of Hormuz is the sole maritime passage connecting the Persian Gulf’s oil-exporting states to the open ocean. There is no second door.
Approximately one-fifth of the world’s entire petroleum supply transits the Strait of Hormuz daily, making it the single most consequential energy chokepoint on the planet.
Alternative routes exist in theory. Tankers can reroute around the Cape of Good Hope. Pipeline capacity through Saudi Arabia and the UAE can absorb some volume. But none of these alternatives can replace Hormuz throughput at scale in the short term, and that asymmetry is precisely what gives Iran persistent leverage over global energy markets.
Three facts define the strait’s strategic role:
In late February 2026, Brent crude sat at approximately $67-68 per barrel (trading at $67.75 on 13 February 2026). That figure serves as the pre-conflict baseline against which every subsequent price movement in this article is measured.
The surge did not arrive in a single session. It built across distinct phases, each tied to a shift in the diplomatic or military temperature, and each priced by markets processing new information in real time.
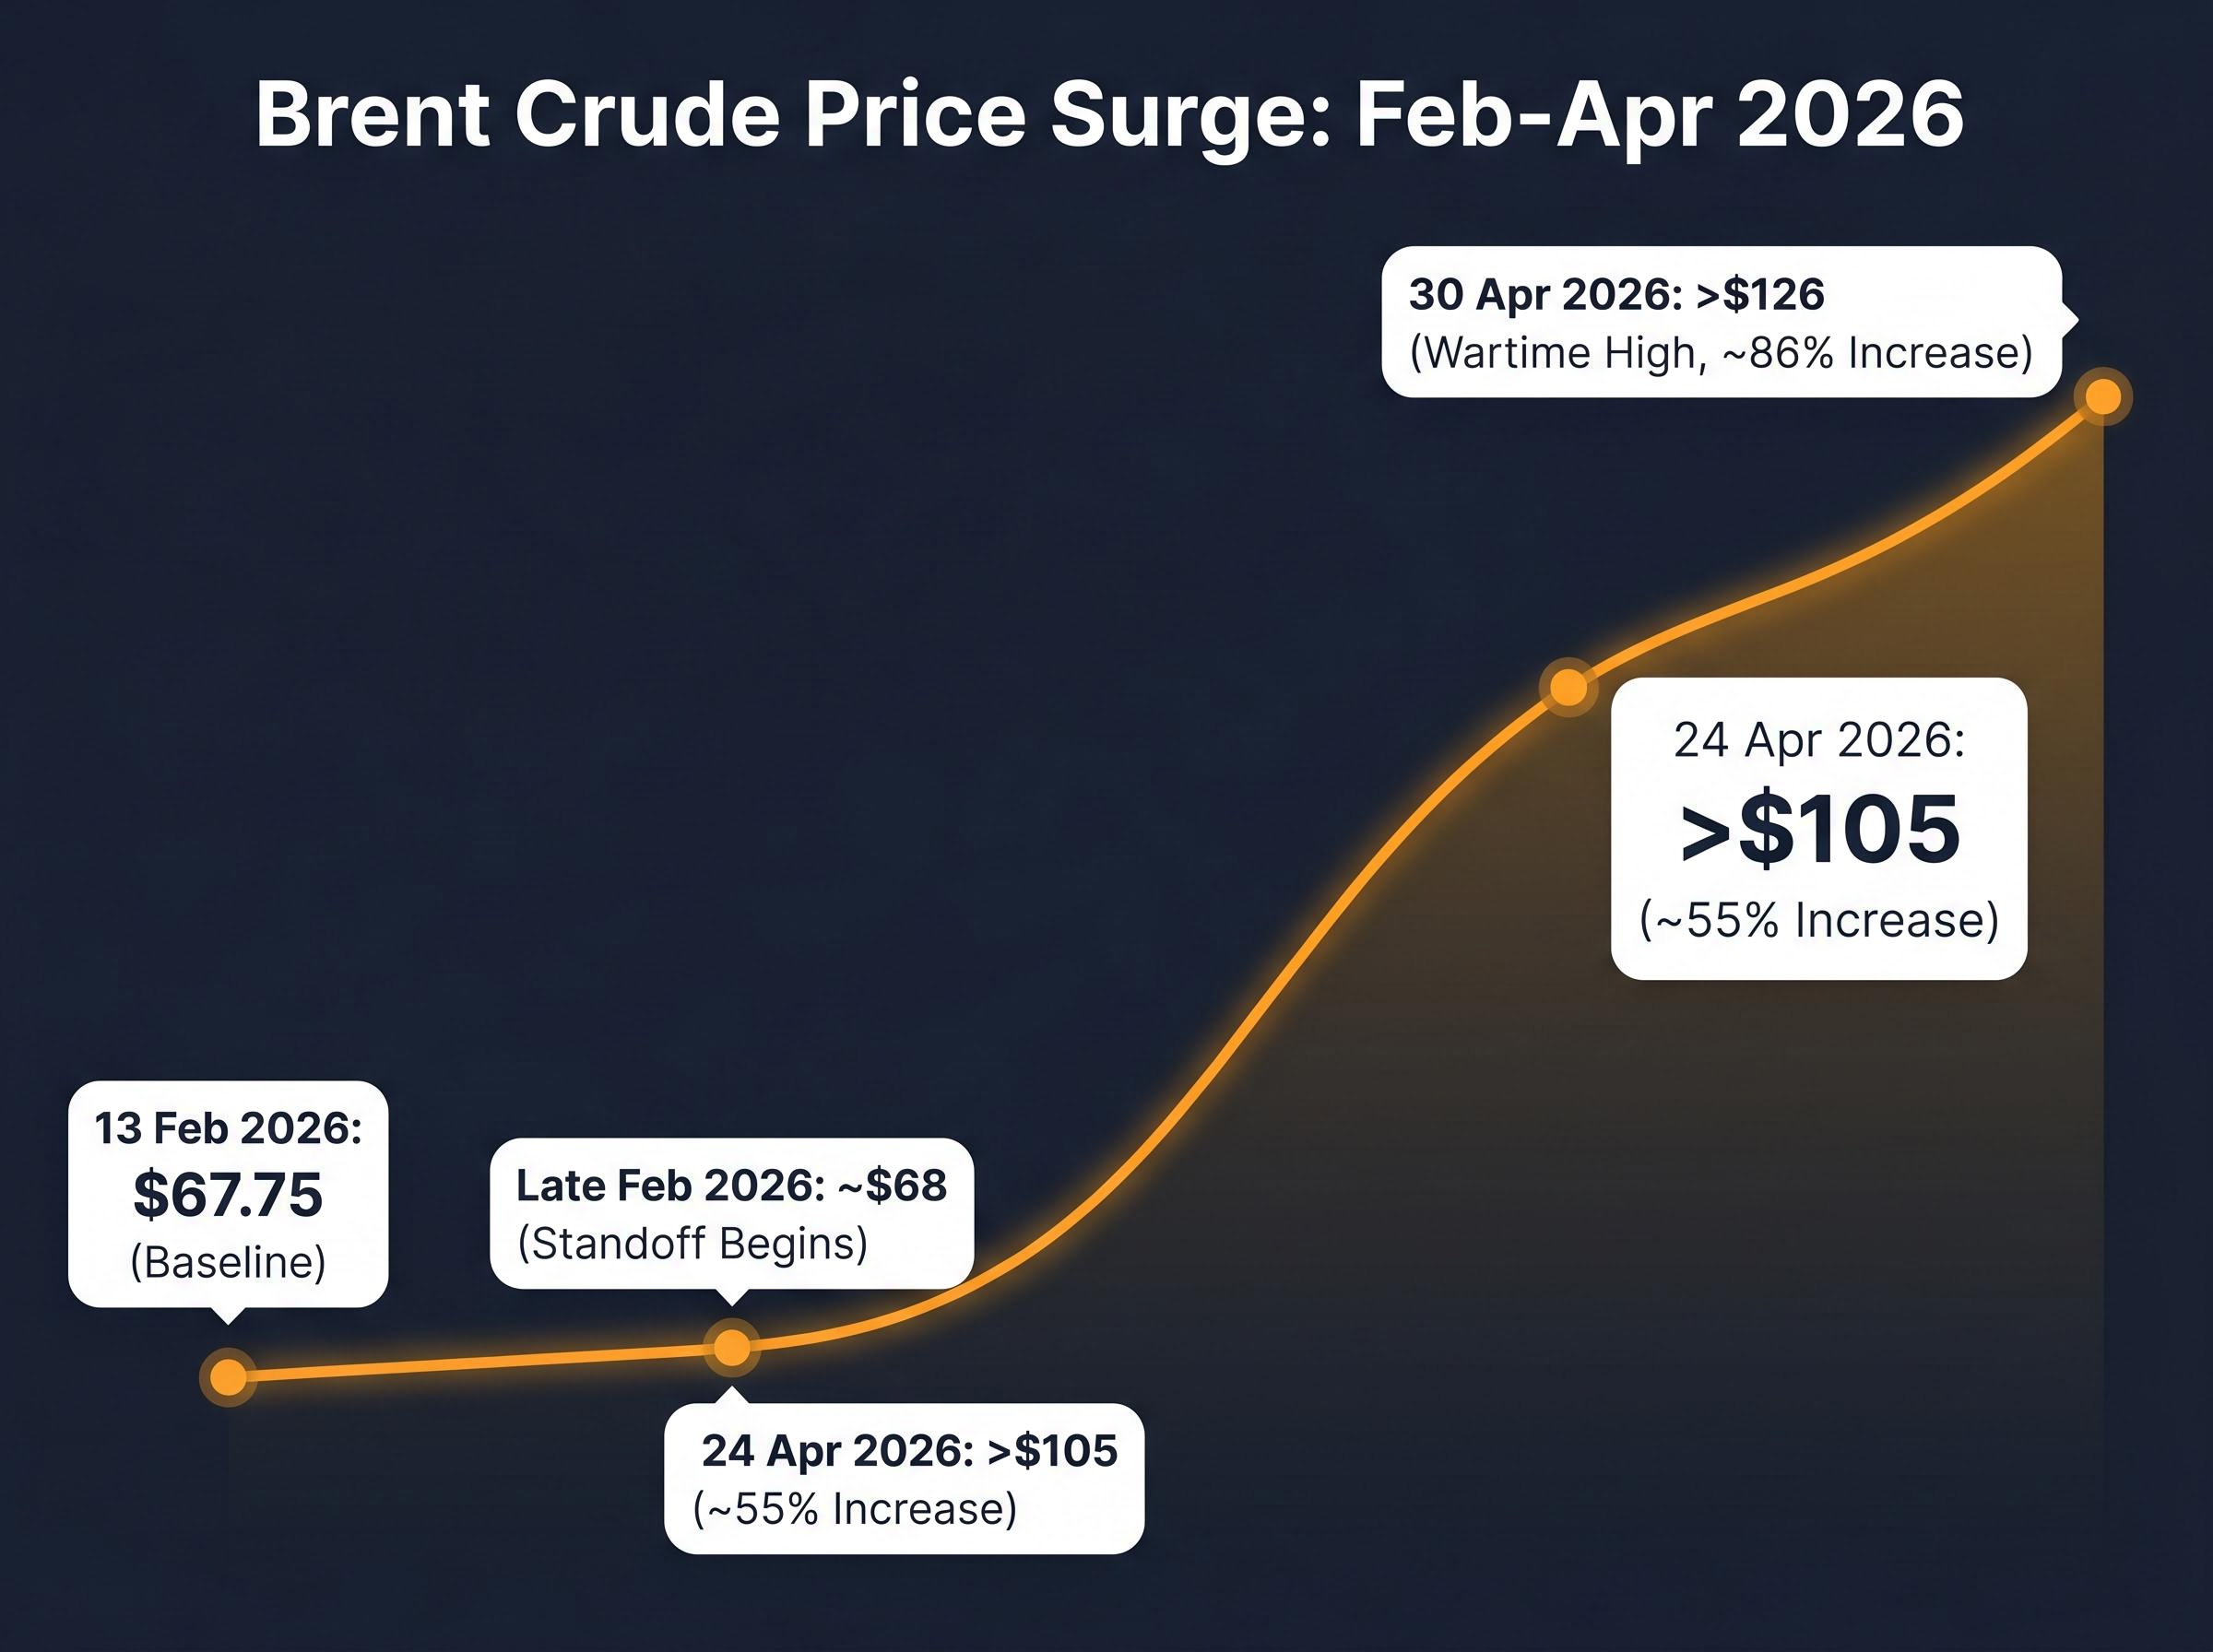
The table below traces the trajectory:
| Date | Brent Price | Change from Baseline | Context |
|---|---|---|---|
| 13 February 2026 | $67.75 | Baseline | Pre-conflict level |
| Late February 2026 | ~$68 | ~0% | Standoff begins; initial market caution |
| 24 April 2026 | >$105 | ~55% | Fifth consecutive day above $105; stalemate entrenched |
| 30 April 2026 | >$126 | ~86% | Wartime high; acute supply fears peak |
Each phase reflected a specific market calculation. The sustained April elevation above $105 corresponded with the realisation that negotiations were producing no breakthroughs after weeks of deadlock. The 30 April spike above $126 came as intensifying rhetoric raised the probability, however briefly, of a full transit shutdown.
Bloomberg analysts’ base-case projection places Brent at $80-90 per barrel, but that estimate assumes de-escalation or meaningful easing of supply stress. With prices sitting well above that range, markets are effectively signalling that resolution remains distant.
Analyst projections also suggest oil prices could remain elevated 20-30% above pre-COVID levels for up to 12 months following a major supply disruption of this magnitude. Restoring market confidence after a sustained shock takes considerably longer than restoring physical supply, and the forward curve reflects that lag.
Roughly eight weeks in, the standoff has settled into a pattern that is stressed but not yet fully broken.
Iran now requires commercial ships to obtain Iranian authorisation before transiting the strait. The United States has responded by establishing a Joint Maritime Information Center (JMIC) security zone south of standard shipping corridors, according to the Associated Press. Ships are still moving through, but the dual-authority environment has compressed transit options and elevated insurance costs.
What makes the current disruption structurally different from prior standoffs is the Hormuz triple lock: simultaneous US naval blockade operations, Iranian toll enforcement on non-US and non-Israeli vessels, and the near-total withdrawal of commercial war risk insurance coverage, a combination that prevents the market from pricing a simple bilateral resolution.
Three active pressure points define the current state of play:
President Trump’s public messaging has added its own layer of uncertainty. Speaking to reporters on 3 May 2026, he described talks as proceeding positively while separately suggesting Iran’s proposal would likely be rejected, a pair of statements that are difficult to reconcile and that markets have treated accordingly.
Matt Smith, an analyst at Kpler, has warned that Iran’s export drops and filling onshore storage risk supply shutdowns that would further rattle global energy markets. Smith’s assessment frames Iran as approaching what analysts describe as a critical breaking point.
The distinction between “disrupted” and “closed” remains the most important variable. The strait is functioning under duress. The question is how long that duress can persist before something breaks.
The transmission chain from a waterway in the Persian Gulf to an American household budget runs through three steps:
The historical relationship between oil prices and recession risk follows a consistent structural pattern: every major US recession since 1973 has been preceded by an energy shock that compressed consumer disposable income, raised business input costs, and constrained Federal Reserve flexibility simultaneously.
Bloomberg analysts project that sustained oil prices at current levels will push developed-market inflation to approximately 4%, above central bank targets and above what Federal Reserve policy was calibrated to handle.
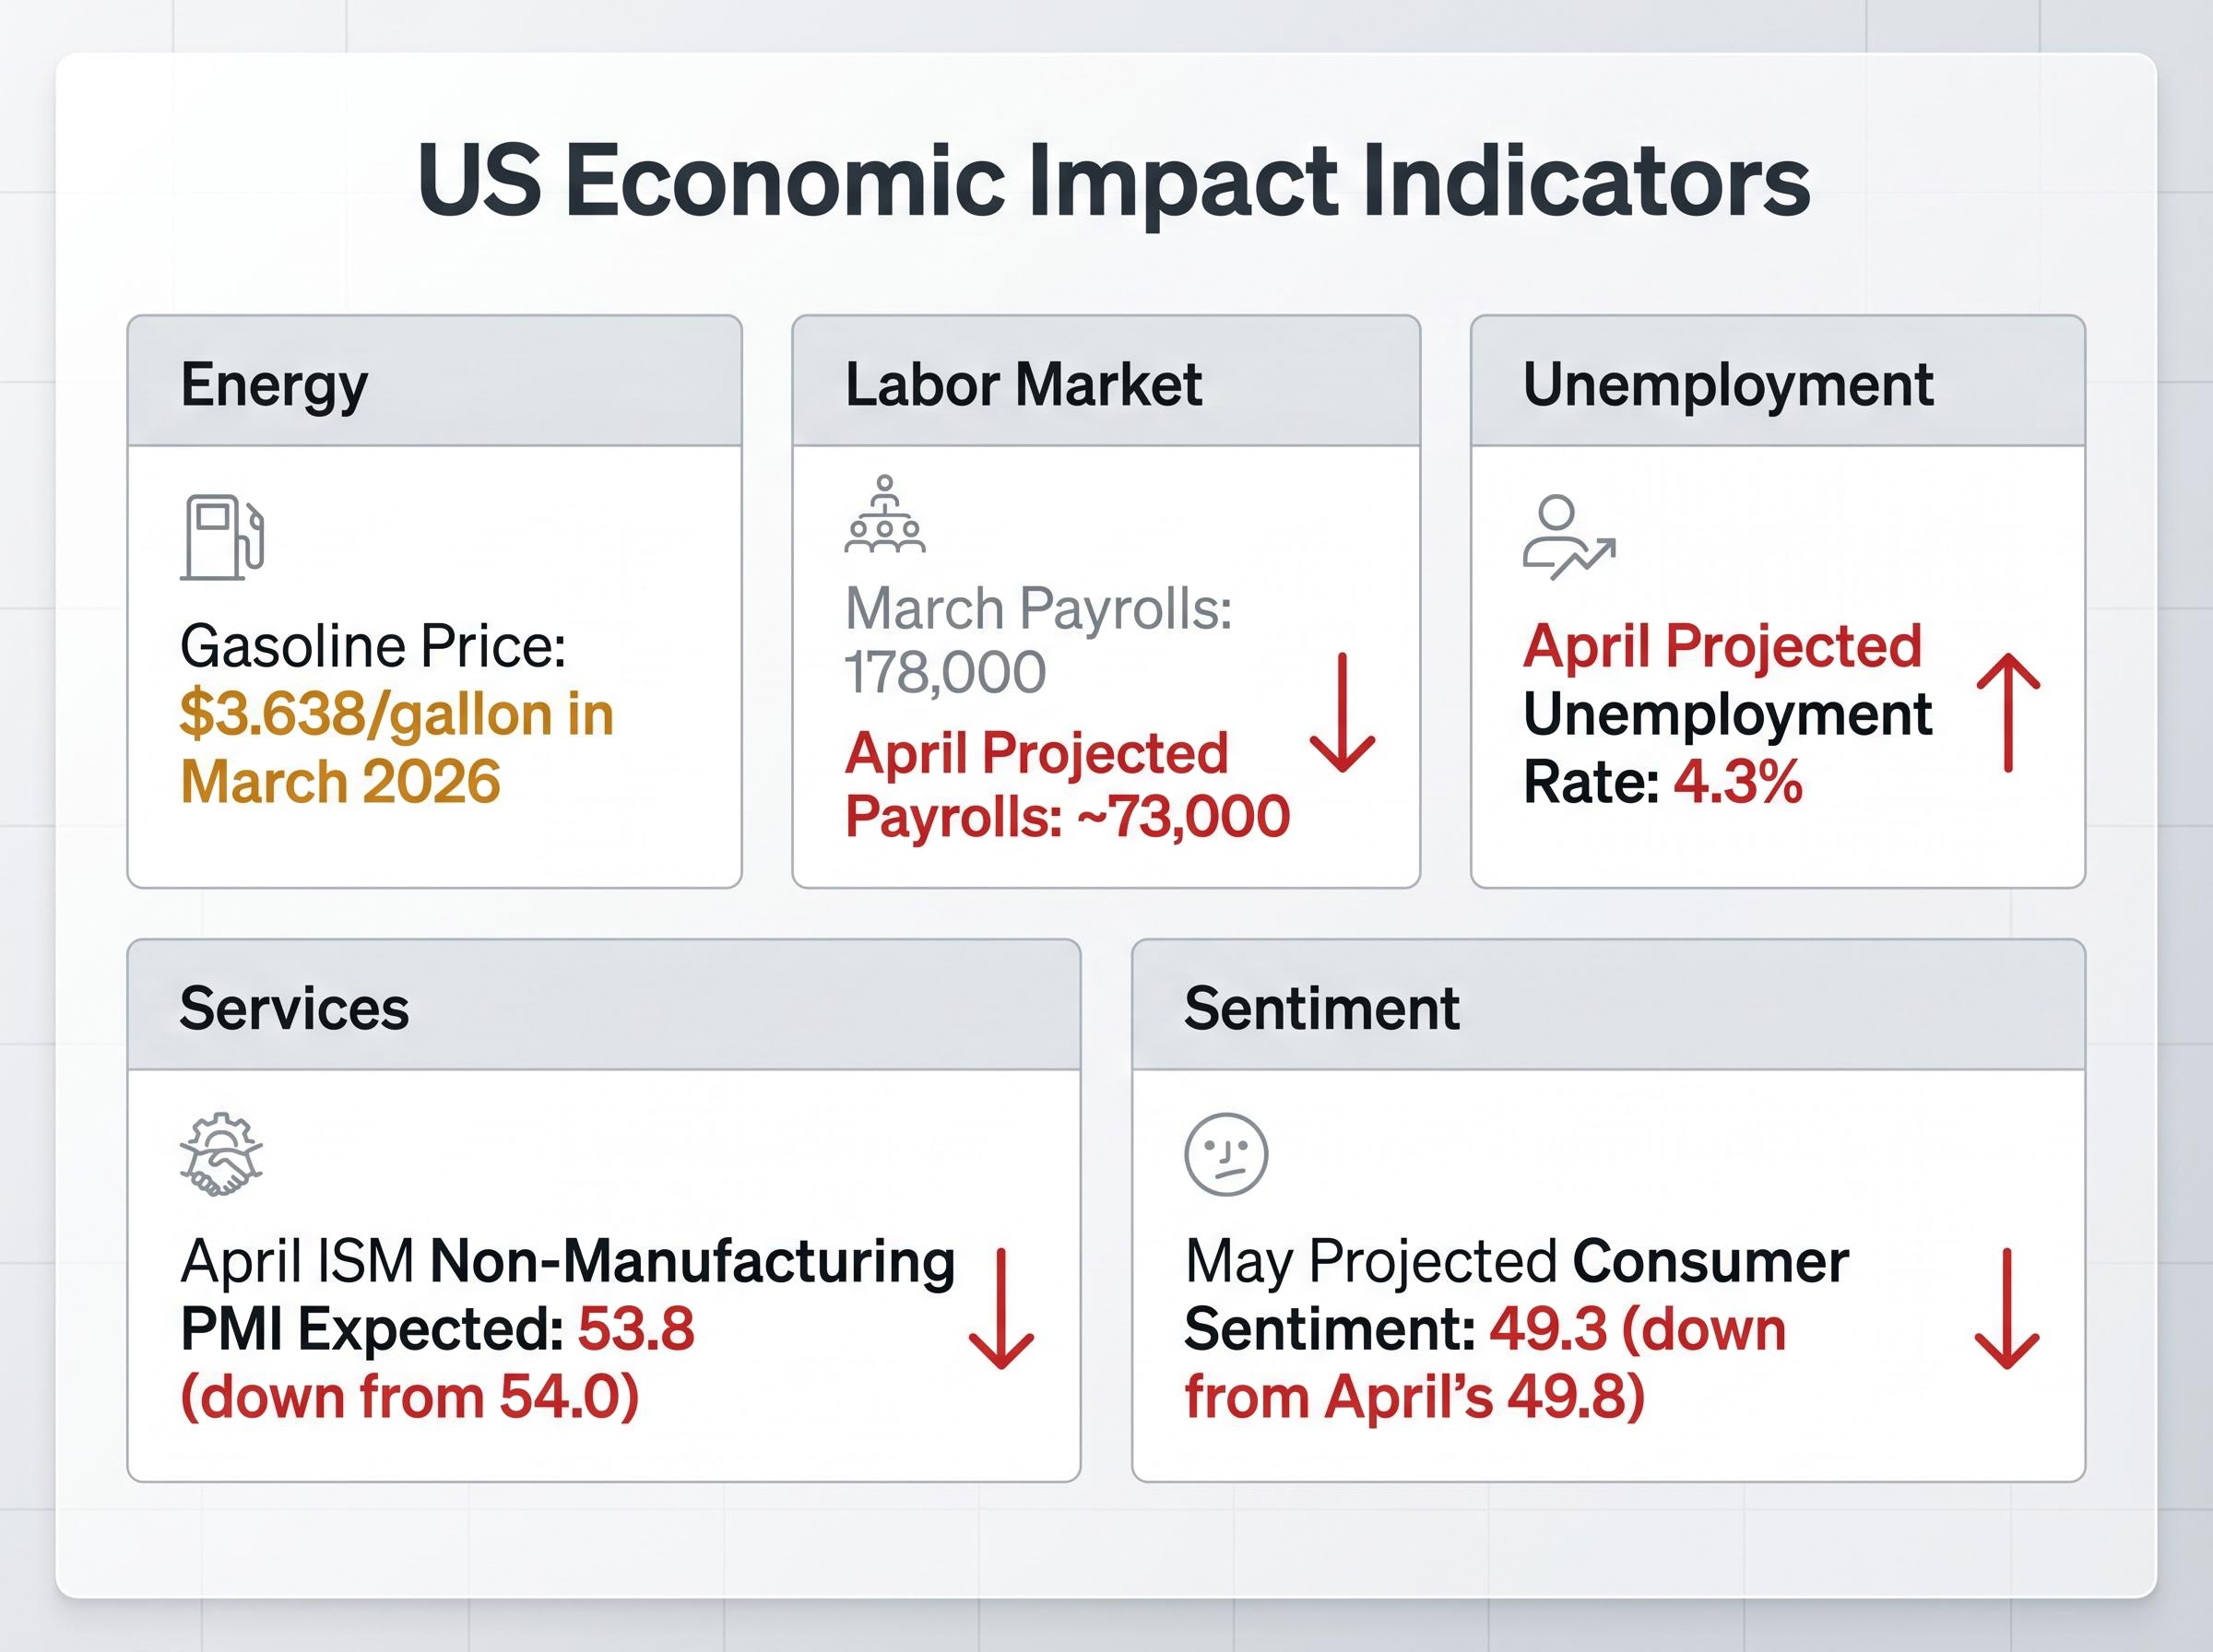
Consumer confidence is already registering the strain. The University of Michigan’s preliminary May consumer sentiment index was projected at 49.3, down from 49.8 in April. Joanne Hsu, director of the University of Michigan Surveys of Consumers, has cited the conflict’s influence on household sentiment as a contributing factor.
The economic strain is acquiring political dimensions as well. Jessica Taylor of the Cook Political Report has identified rising gasoline prices as a key issue trending against Republicans in the 2026 Senate elections, illustrating how quickly an energy shock can migrate from commodity markets to ballot-box calculations.
The Federal Reserve held its benchmark rate unchanged at 3.5-3.75% at its April meeting. The decision itself was unremarkable. The vote was not.
Four of the 12 Federal Open Market Committee (FOMC) members, the body that sets interest rate policy, dissented from the policy statement, making it the most contentious Fed vote since the early 1990s. The division reflects a genuine disagreement over whether the Hormuz-driven inflation surge warrants a policy response or whether tightening into a supply shock would cause more damage than it prevents.
The four-way FOMC dissent represents more than a policy disagreement; it reflects a genuine dual-mandate conflict between PCE inflation running at 3.5% against a 2% target and an unemployment rate that has climbed to 4.3%, two objectives the Fed’s rate tools cannot address simultaneously without making one problem materially worse.
Adding institutional complexity, Fed Chair Jerome Powell announced he would remain on the Fed’s board after his chairmanship concludes in May 2026, a departure from institutional norms that could complicate the transition to designated successor Kevin Warsh. The US 10-year Treasury yield stood at 4.31% on 24 April 2026, reflecting the market’s attempt to price both the inflation risk and the policy uncertainty simultaneously.
The jobs picture offers the most direct window into whether the conflict is suppressing real economic activity, not just raising prices.
JOLTS job openings data (due Tuesday) and ADP private payrolls (due Wednesday) will provide supplementary readings ahead of the Friday jobs report, offering earlier signals on whether employers are pulling back.
No one credibly has a timeline for resolution. What investors and households can do is monitor the situation through a framework of three plausible trajectories.
Moody’s Analytics places US recession probability at nearly 49%, with PNC Financial Services Group warning that odds exceed 50% if oil reaches $160 per barrel, a threshold that sits within the range of escalation scenarios that markets have already begun pricing.
| Scenario | Brent Price Range | Fed Policy Implication | Household and Portfolio Impact |
|---|---|---|---|
| De-escalation | $80-90 | Room to resume rate cuts | Inflation pressure eases; consumer relief at the pump |
| Continued stalemate | $100-120 | Rates held; policy division persists | Energy-sector outperformance; sustained consumer strain |
| Escalation | $126+ | Emergency policy response possible | Severe macroeconomic shock; recession risk elevated |
The week of 4-8 May 2026 carries particular weight. New York Fed President John Williams speaks on Monday and Thursday. Fed Governors Michelle Bowman and Michael Barr speak on Tuesday. Markets will parse every remark for signals about how policymakers are weighting the conflict’s inflationary impact against growth risks.
The monetary policy divergence is not confined to the United States. Sweden’s Riksbank and Norway’s Norges Bank are expected to hold rates this week but signal heightened upside risk to their rate trajectories due to the energy supply shock, while the Reserve Bank of Australia is projected to raise rates by 25 basis points, illustrating the global fractures the conflict is accelerating.
The 10-year Treasury yield at 4.31% reflects where the market’s balance of probabilities sits today. That number will move as the data arrives.
Even if the strait reopens cleanly and diplomacy succeeds, the economic damage already accumulated does not instantly reverse. Consumer confidence sits near multi-year lows. Inflation is re-accelerating. The Federal Reserve is divided. The labour market appears to be decelerating.
The data releases this week serve as the first meaningful diagnostic. If April payrolls confirm the expected deceleration to approximately 73,000, that would represent the most direct evidence yet that the conflict is suppressing US hiring, not just raising energy costs. Combined with JOLTS, ADP, and ISM services data, the picture that emerges by Friday will shape how seriously policymakers and markets treat the Hormuz shock heading into the second half of the year.
The combination of Fed speaker remarks and economic data makes this one of the more consequential information weeks of 2026 so far. For investors, the appropriate posture is informed attention rather than premature conviction; the framework exists, but the data has not yet arrived.
This article is for informational purposes only and should not be considered financial advice. Investors should conduct their own research and consult with financial professionals before making investment decisions. Past performance does not guarantee future results. Financial projections are subject to market conditions and various risk factors.
—
The Strait of Hormuz is a narrow waterway roughly 33 kilometres wide at its narrowest navigable point that connects Persian Gulf oil exporters to the open ocean, handling approximately one-fifth of the world's entire petroleum supply daily. Because no alternative route can replace its throughput at scale in the short term, any disruption there immediately pressures global oil prices.
Brent crude climbed from a pre-conflict baseline of approximately $67.75 per barrel on 13 February 2026 to above $126 per barrel by 30 April 2026, an increase of roughly 86% in just over two months. Each phase of the price surge corresponded with a shift in the diplomatic or military temperature of the standoff.
US national average gasoline prices hit $3.638 per gallon in March 2026, the highest since September 2023, and higher energy costs are feeding into transportation, manufacturing, and food prices. Consumer sentiment has fallen sharply, and April payrolls are projected at approximately 73,000, far below March's 178,000, suggesting the conflict is already suppressing US hiring.
Analysts outline three trajectories: de-escalation that returns Brent to $80-90 and allows the Fed to resume rate cuts; a continued stalemate keeping prices at $100-120 with sustained consumer strain; and escalation above $126 that could trigger an emergency policy response and significantly elevated recession risk. Moody's Analytics currently places US recession probability at nearly 49%.
The Fed held its benchmark rate unchanged at 3.5-3.75% at its April 2026 meeting, but four of the twelve FOMC members dissented, making it the most contentious Fed vote since the early 1990s. The division reflects a genuine conflict between PCE inflation running at 3.5% against a 2% target and an unemployment rate that has climbed to 4.3%, two problems the Fed's rate tools cannot address simultaneously without worsening one of them.