Why Flight Centre’s Share Price Rose on an Earnings Downgrade
1 hr ago
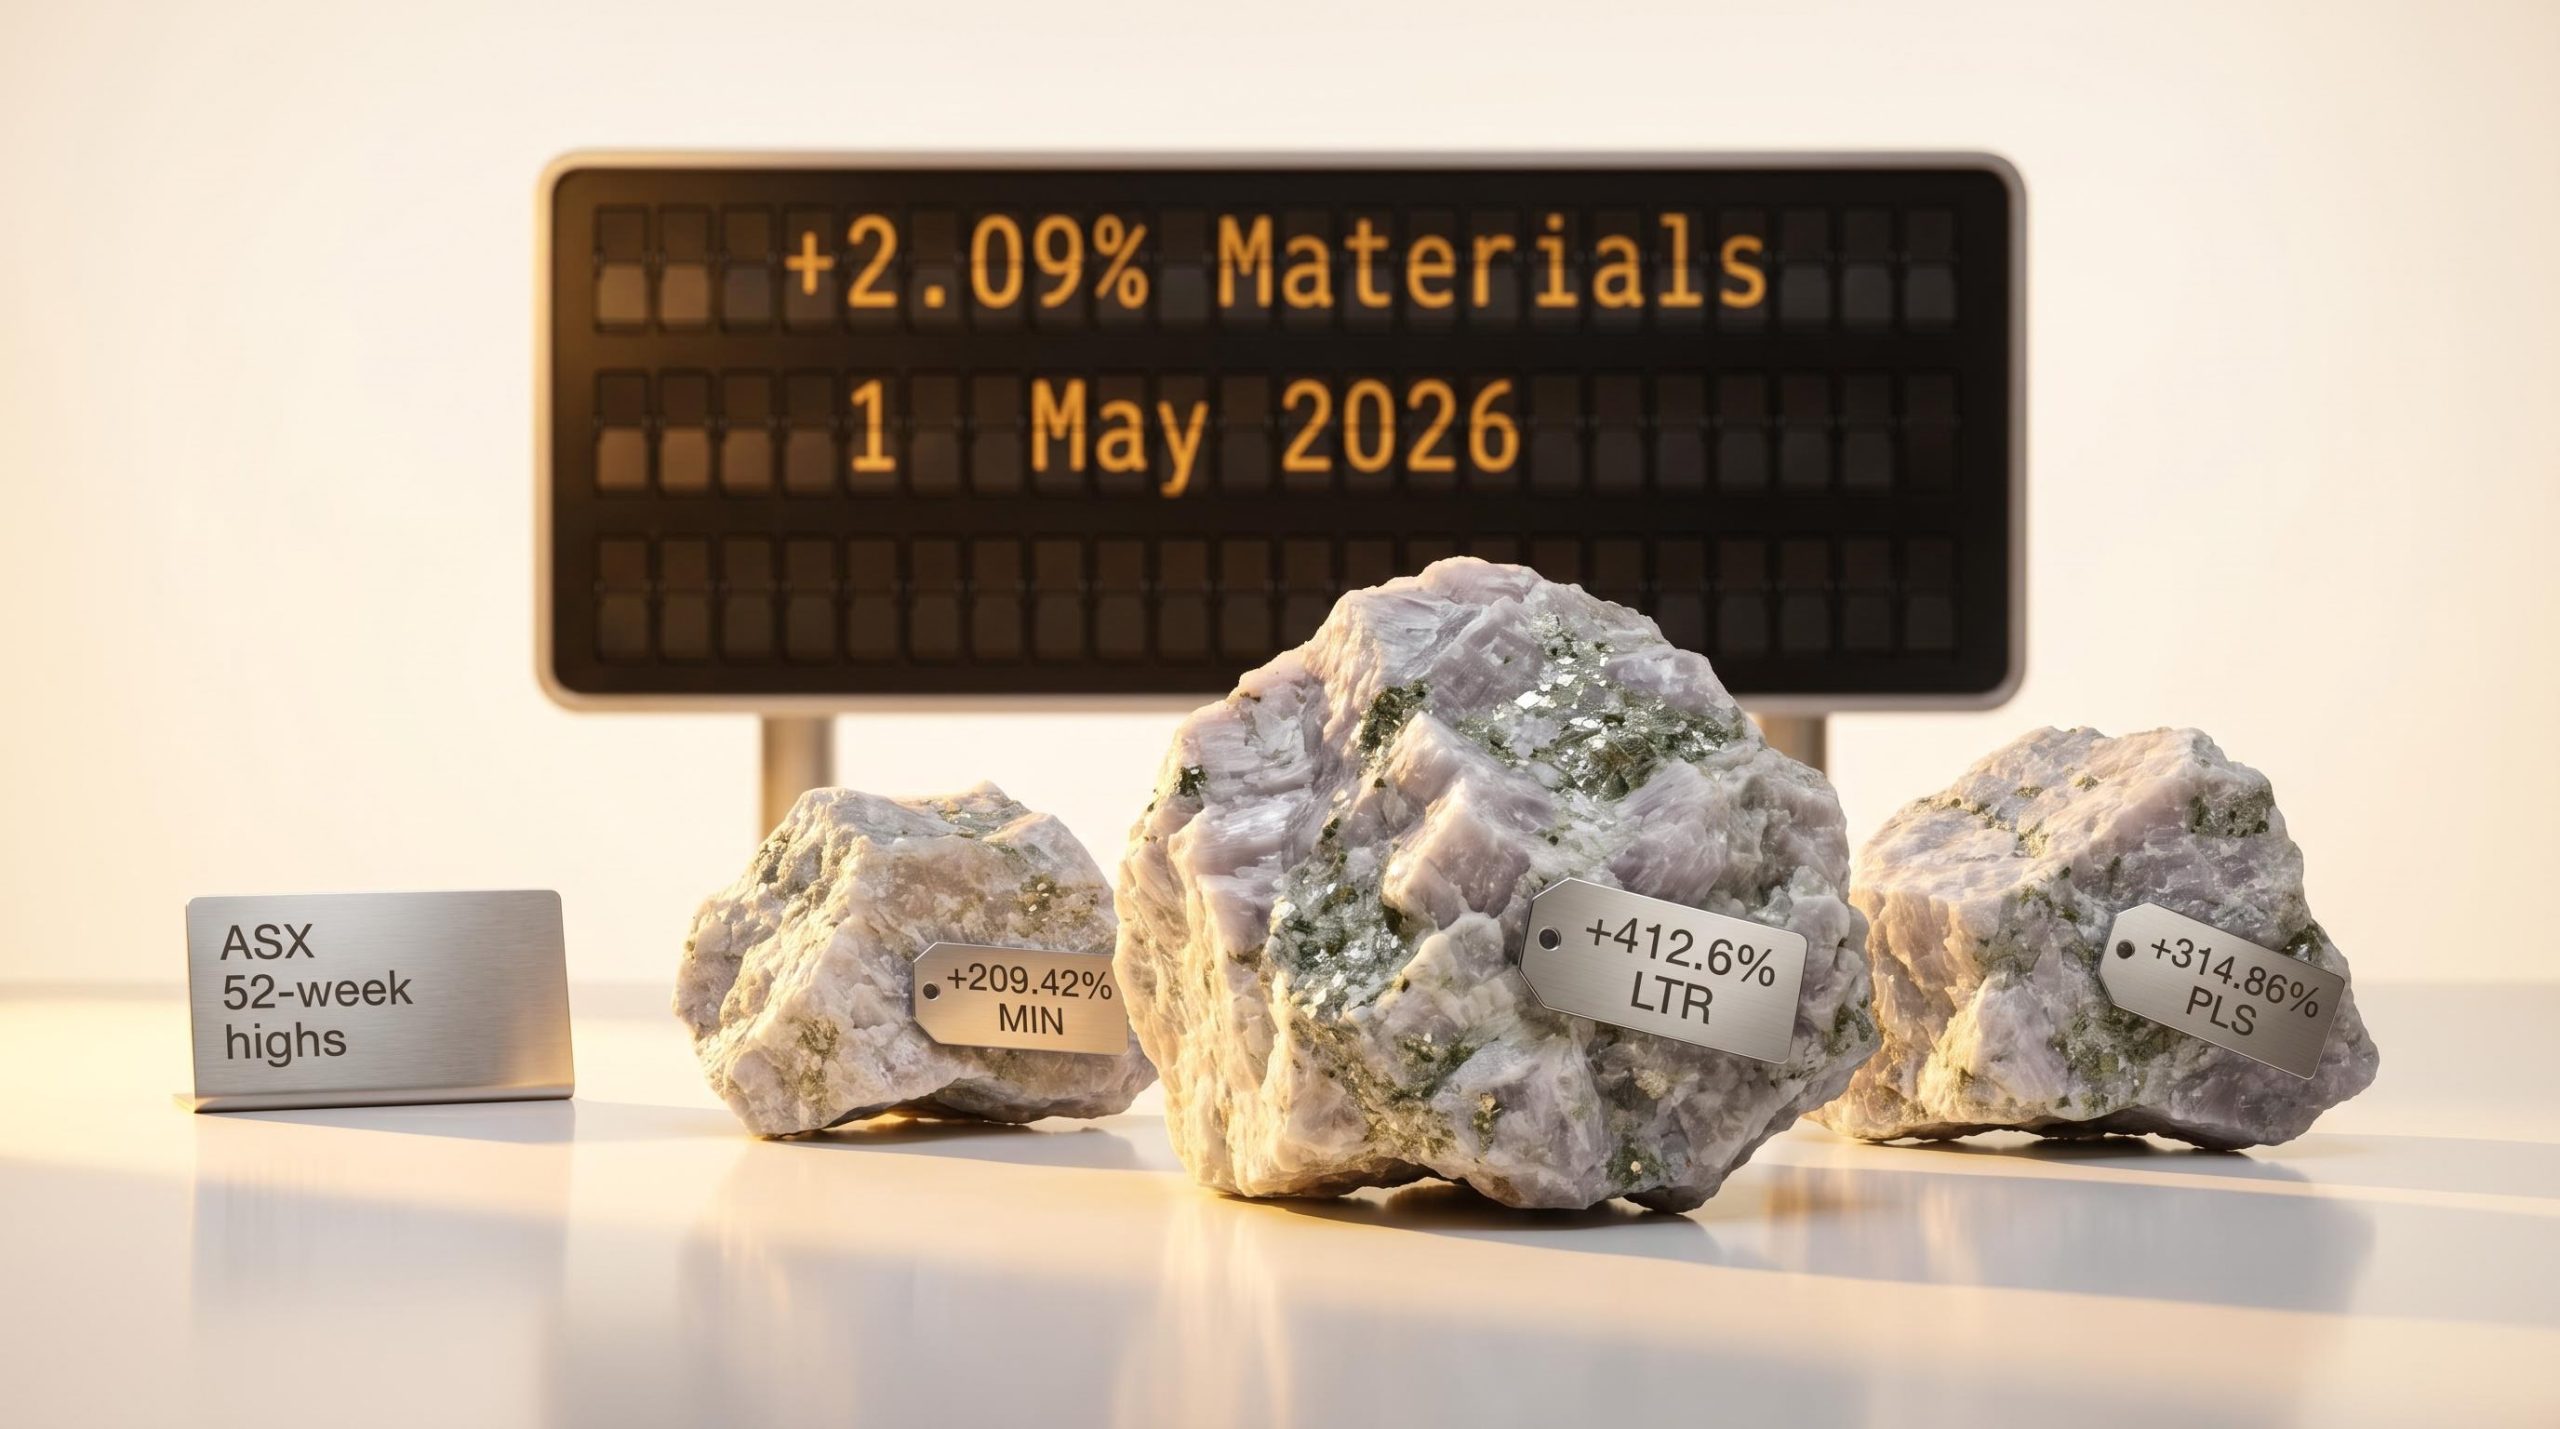
The S&P/ASX 200 slipped 0.65% in the week ending 1 May 2026 and sits roughly flat for the year. Beneath that calm surface, the divergence is anything but flat. Twenty-two constituents touched fresh 52-week lows across the week, concentrated in Consumer Discretionary and Health Care. Eleven moved in the opposite direction, reaching new annual highs, with three lithium names posting one-year gains that would look extraordinary in any market environment: Liontown Resources up 412.6%, Pilbara Minerals up 314.86%, and Mineral Resources up 209.42%. This analysis maps which ASX 200 stocks hit new annual highs, what commodity and macro forces are driving them, how the sector distribution of highs and lows reveals a rotation already underway, and what the signal means for investors navigating a market still short of a breakout.
The index barely moved. The stocks underneath it moved violently in opposite directions.
Liontown Resources (LTR) delivered a one-year return of +412.6%, the largest annual gain among all ASX 200 constituents reaching fresh 52-week highs in the week ending 1 May 2026.
Eleven names reached new annual highs across the week. Three Materials stocks with triple-digit annual returns dominated the list, but the full field spans Technology, Energy, Utilities, and one Consumer Discretionary name. The range matters: this is not a single-commodity phenomenon.
Two names on the list, Predictive Discovery and Karoon Energy, reached their annual highs during the week but finished lower on a closing basis, down 4.7% and 3.1% respectively. That distinction sharpens the picture. Intraweek highs followed by weekly losses suggest distribution at elevated prices rather than clean breakout momentum.
| Company (Ticker, Sector) | Close Price | Weekly Return | One-Year Return |
|---|---|---|---|
| Liontown Resources (LTR, Materials) | $2.64 | +17.9% | +412.6% |
| Pilbara Minerals (PLS, Materials) | $6.14 | +6.4% | +314.86% |
| Mineral Resources (MIN, Materials) | $66.70 | +12.4% | +209.42% |
| Codan (CDA, Technology) | $43.33 | +21.6% | +166.3% |
| Predictive Discovery (PDI, Materials) | $0.91 | -4.7% | +149.3% |
| Tabcorp Holdings (TAH, Consumer Discretionary) | $1.17 | +5.0% | +86.4% |
| Nickel Industries (NIC, Materials) | $1.07 | +7.0% | +79.0% |
| Karoon Energy (KAR, Energy) | $2.17 | -3.1% | +52.8% |
| Ampol (ALD, Energy) | $35.82 | +4.7% | +43.6% |
| Aurizon Holdings (AZJ, Industrials) | $4.27 | +2.2% | +42.3% |
| APA Group (APA, Utilities) | $10.50 | +3.8% | +25.6% |
For investors scanning for upward price discovery within a directionless index, these 11 names represent the specific points where momentum is trending higher rather than reverting.
The lithium trade has a fundamental story underneath it, and that story starts at the commodity level.
Lithium carbonate spot prices averaged approximately $15,000 per tonne (lithium carbonate equivalent, or LCE) in April 2026, up 5% month-on-month. The price recovery is being supported by steady electric vehicle demand in China, where 2.1 million units were sold across Q1 2026. No major production cuts were announced during the period, meaning the price lift is demand-led rather than supply-constrained.
That commodity-level strength translated directly into institutional behaviour on 1 May 2026, when the Materials sector rallied +2.09%, leading 10 of 11 ASX sectors into positive territory. The session’s performance suggests institutional buyers returning to large miners at current valuations rather than retail-driven speculation.
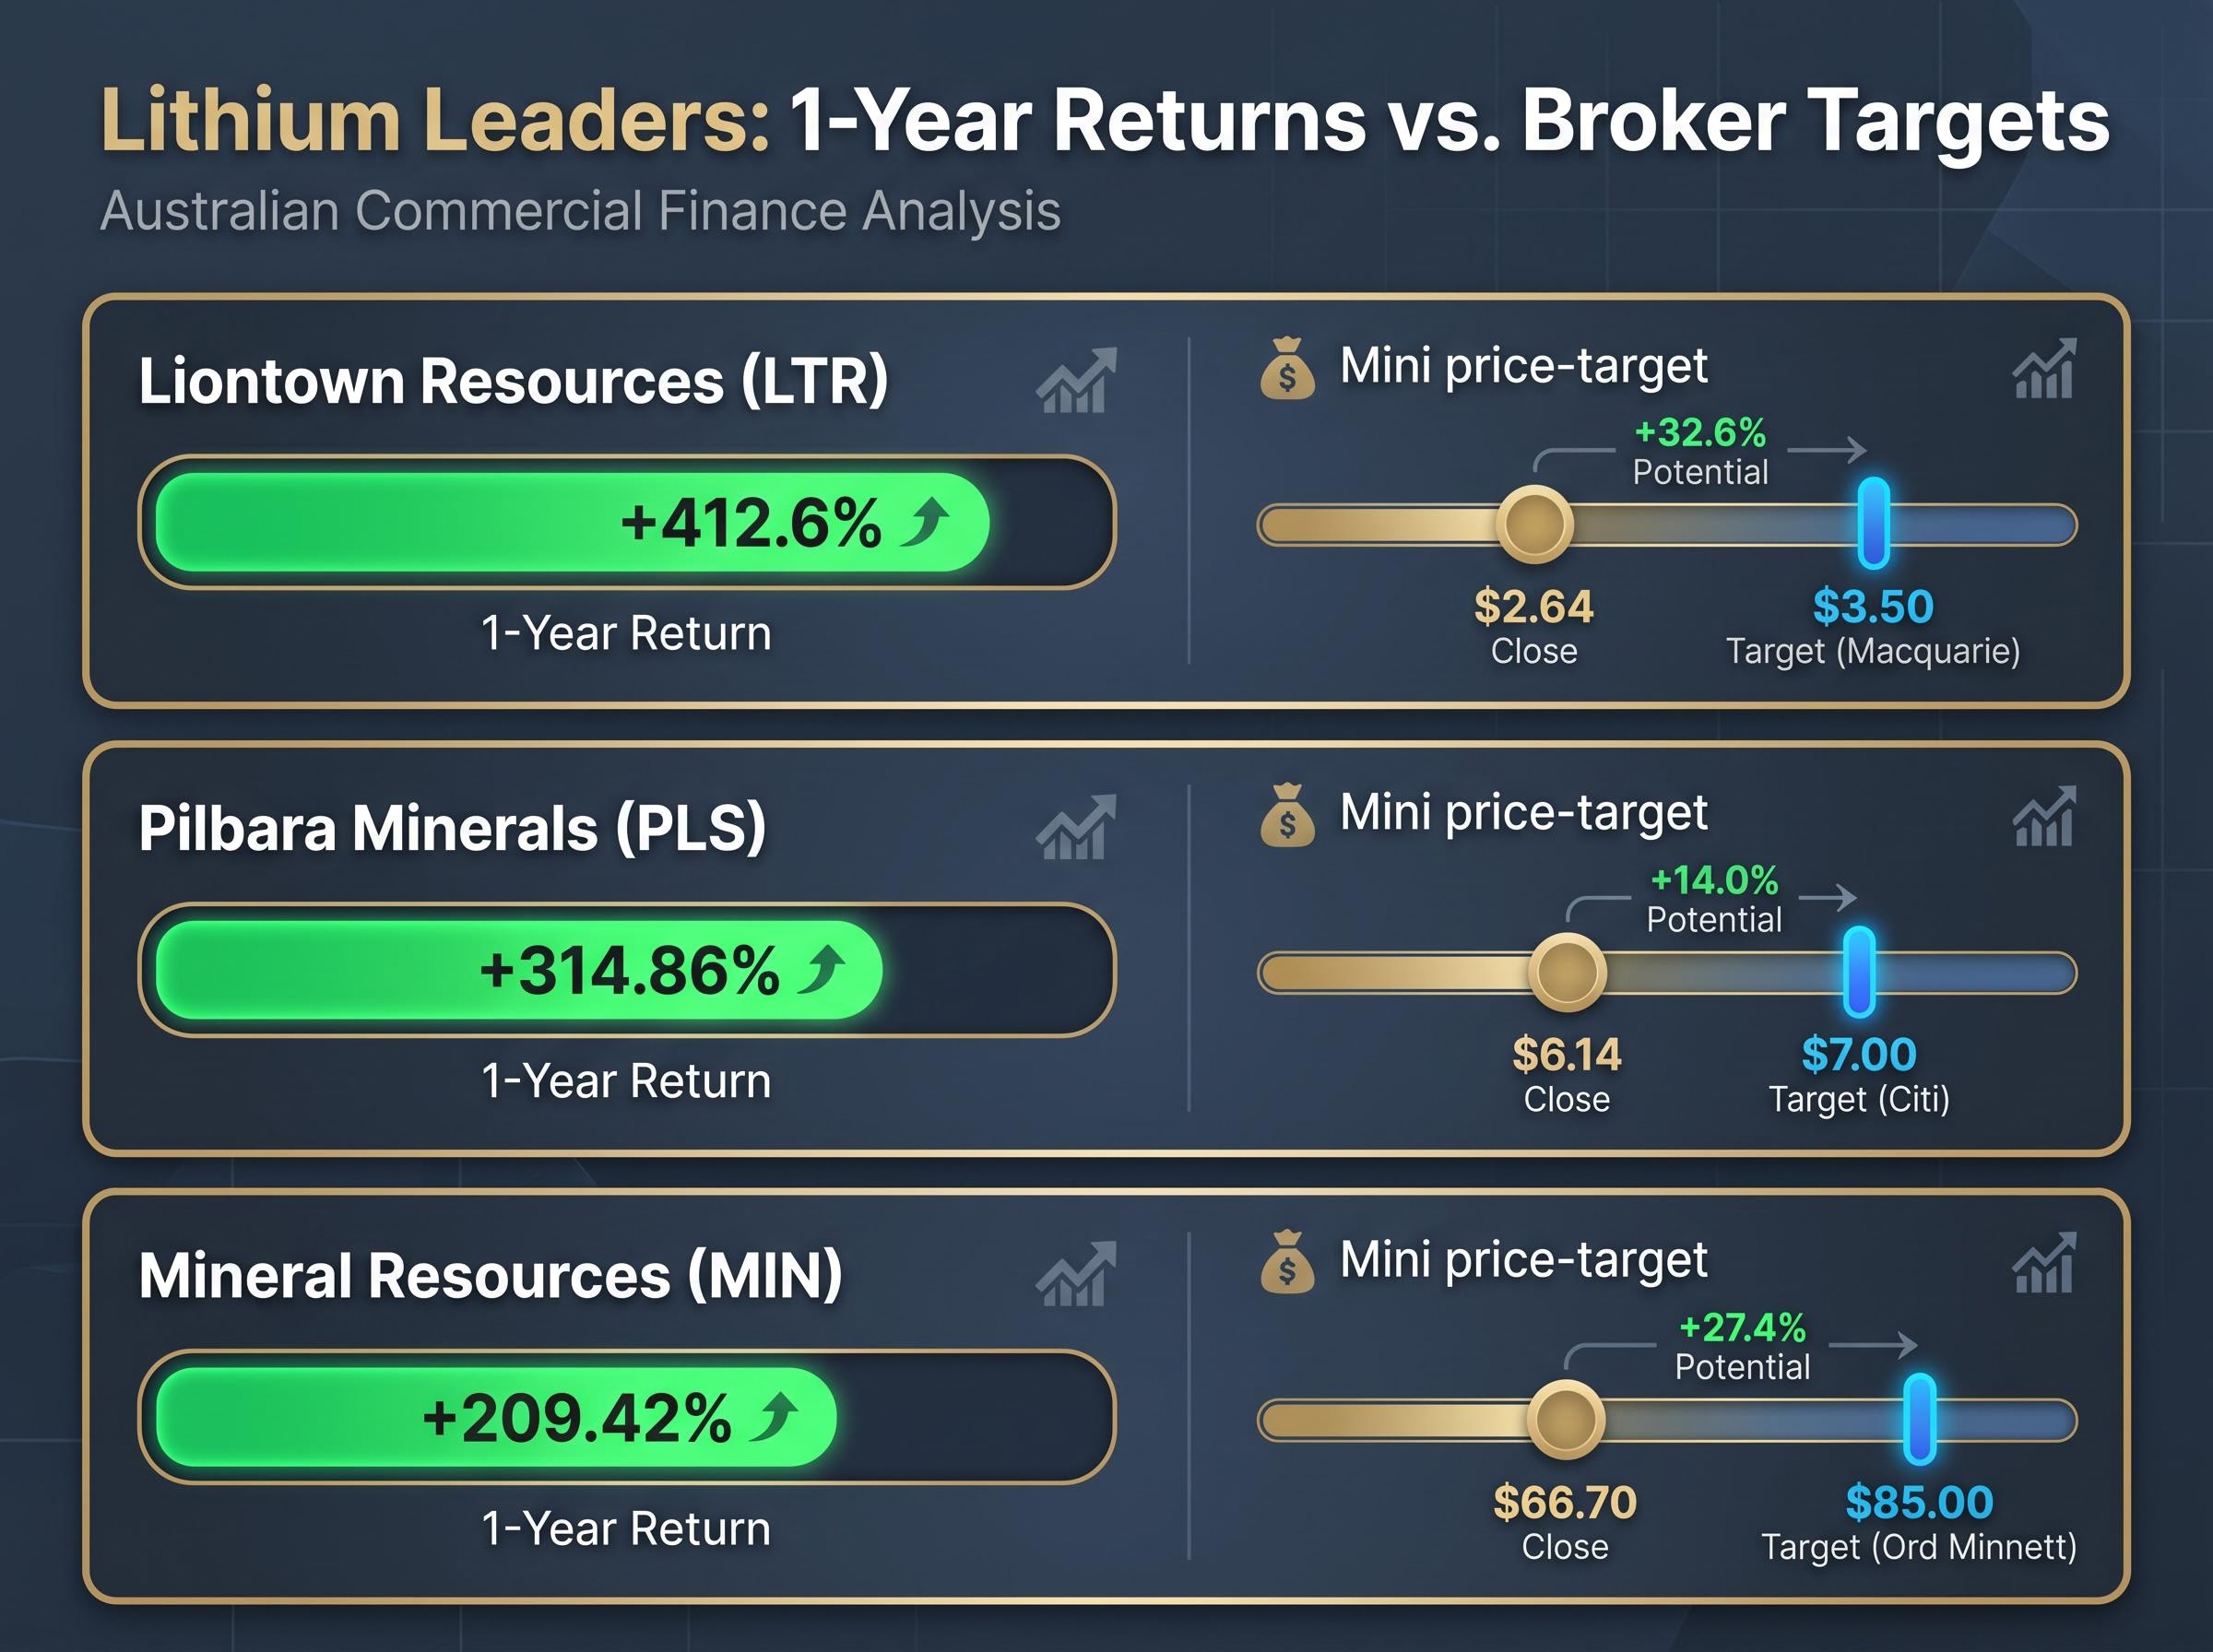
The three lead lithium and mining names carry broker targets meaningfully above their current share prices, which suggests the market has not yet fully priced the commodity recovery thesis:
These targets sit at a premium to current prices across all three names. Whether the stocks close that gap depends on the same commodity fundamentals that built the rally.
A 52-week high is one of the most commonly screened data points in Australian retail and self-managed super fund investing. It is also one of the most frequently misread.
When a stock reaches its highest price in 12 months, every holder who purchased shares over that period is in profit. That dynamic has specific implications: selling pressure from profit-taking typically increases at annual highs, while buying pressure from breakout-chasing strategies also intensifies. The outcome depends on which force dominates.
The distinction between the two mechanisms producing a new high matters for sustainability:
ASX 200 RSI (14-day): approximately 46 as of 1 May 2026, indicating neutral to slightly bearish momentum on the broader index despite individual stock leadership. The index remains below the 9,230 resistance level that would confirm a bullish breakout, with support at 8,255.
The cases of Predictive Discovery (weekly return -4.7%) and Karoon Energy (weekly return -3.1%) illustrate the nuance. Both reached annual highs intraweek but closed lower, a pattern that can signal distribution, where larger holders sell into the strength of the new high. Investors using 52-week high screens as a starting point for momentum analysis should treat this pattern as a prompt for further investigation rather than automatic confirmation.
Passive flows and ASX price discovery have become increasingly entangled as ETF assets approach A$200 billion, with pod shops and quant funds amplifying intraweek moves at a level that can produce the kind of distribution pattern visible in Predictive Discovery and Karoon Energy, where stocks reach intraweek highs on institutional selling into ETF rebalancing flows before closing the week lower.
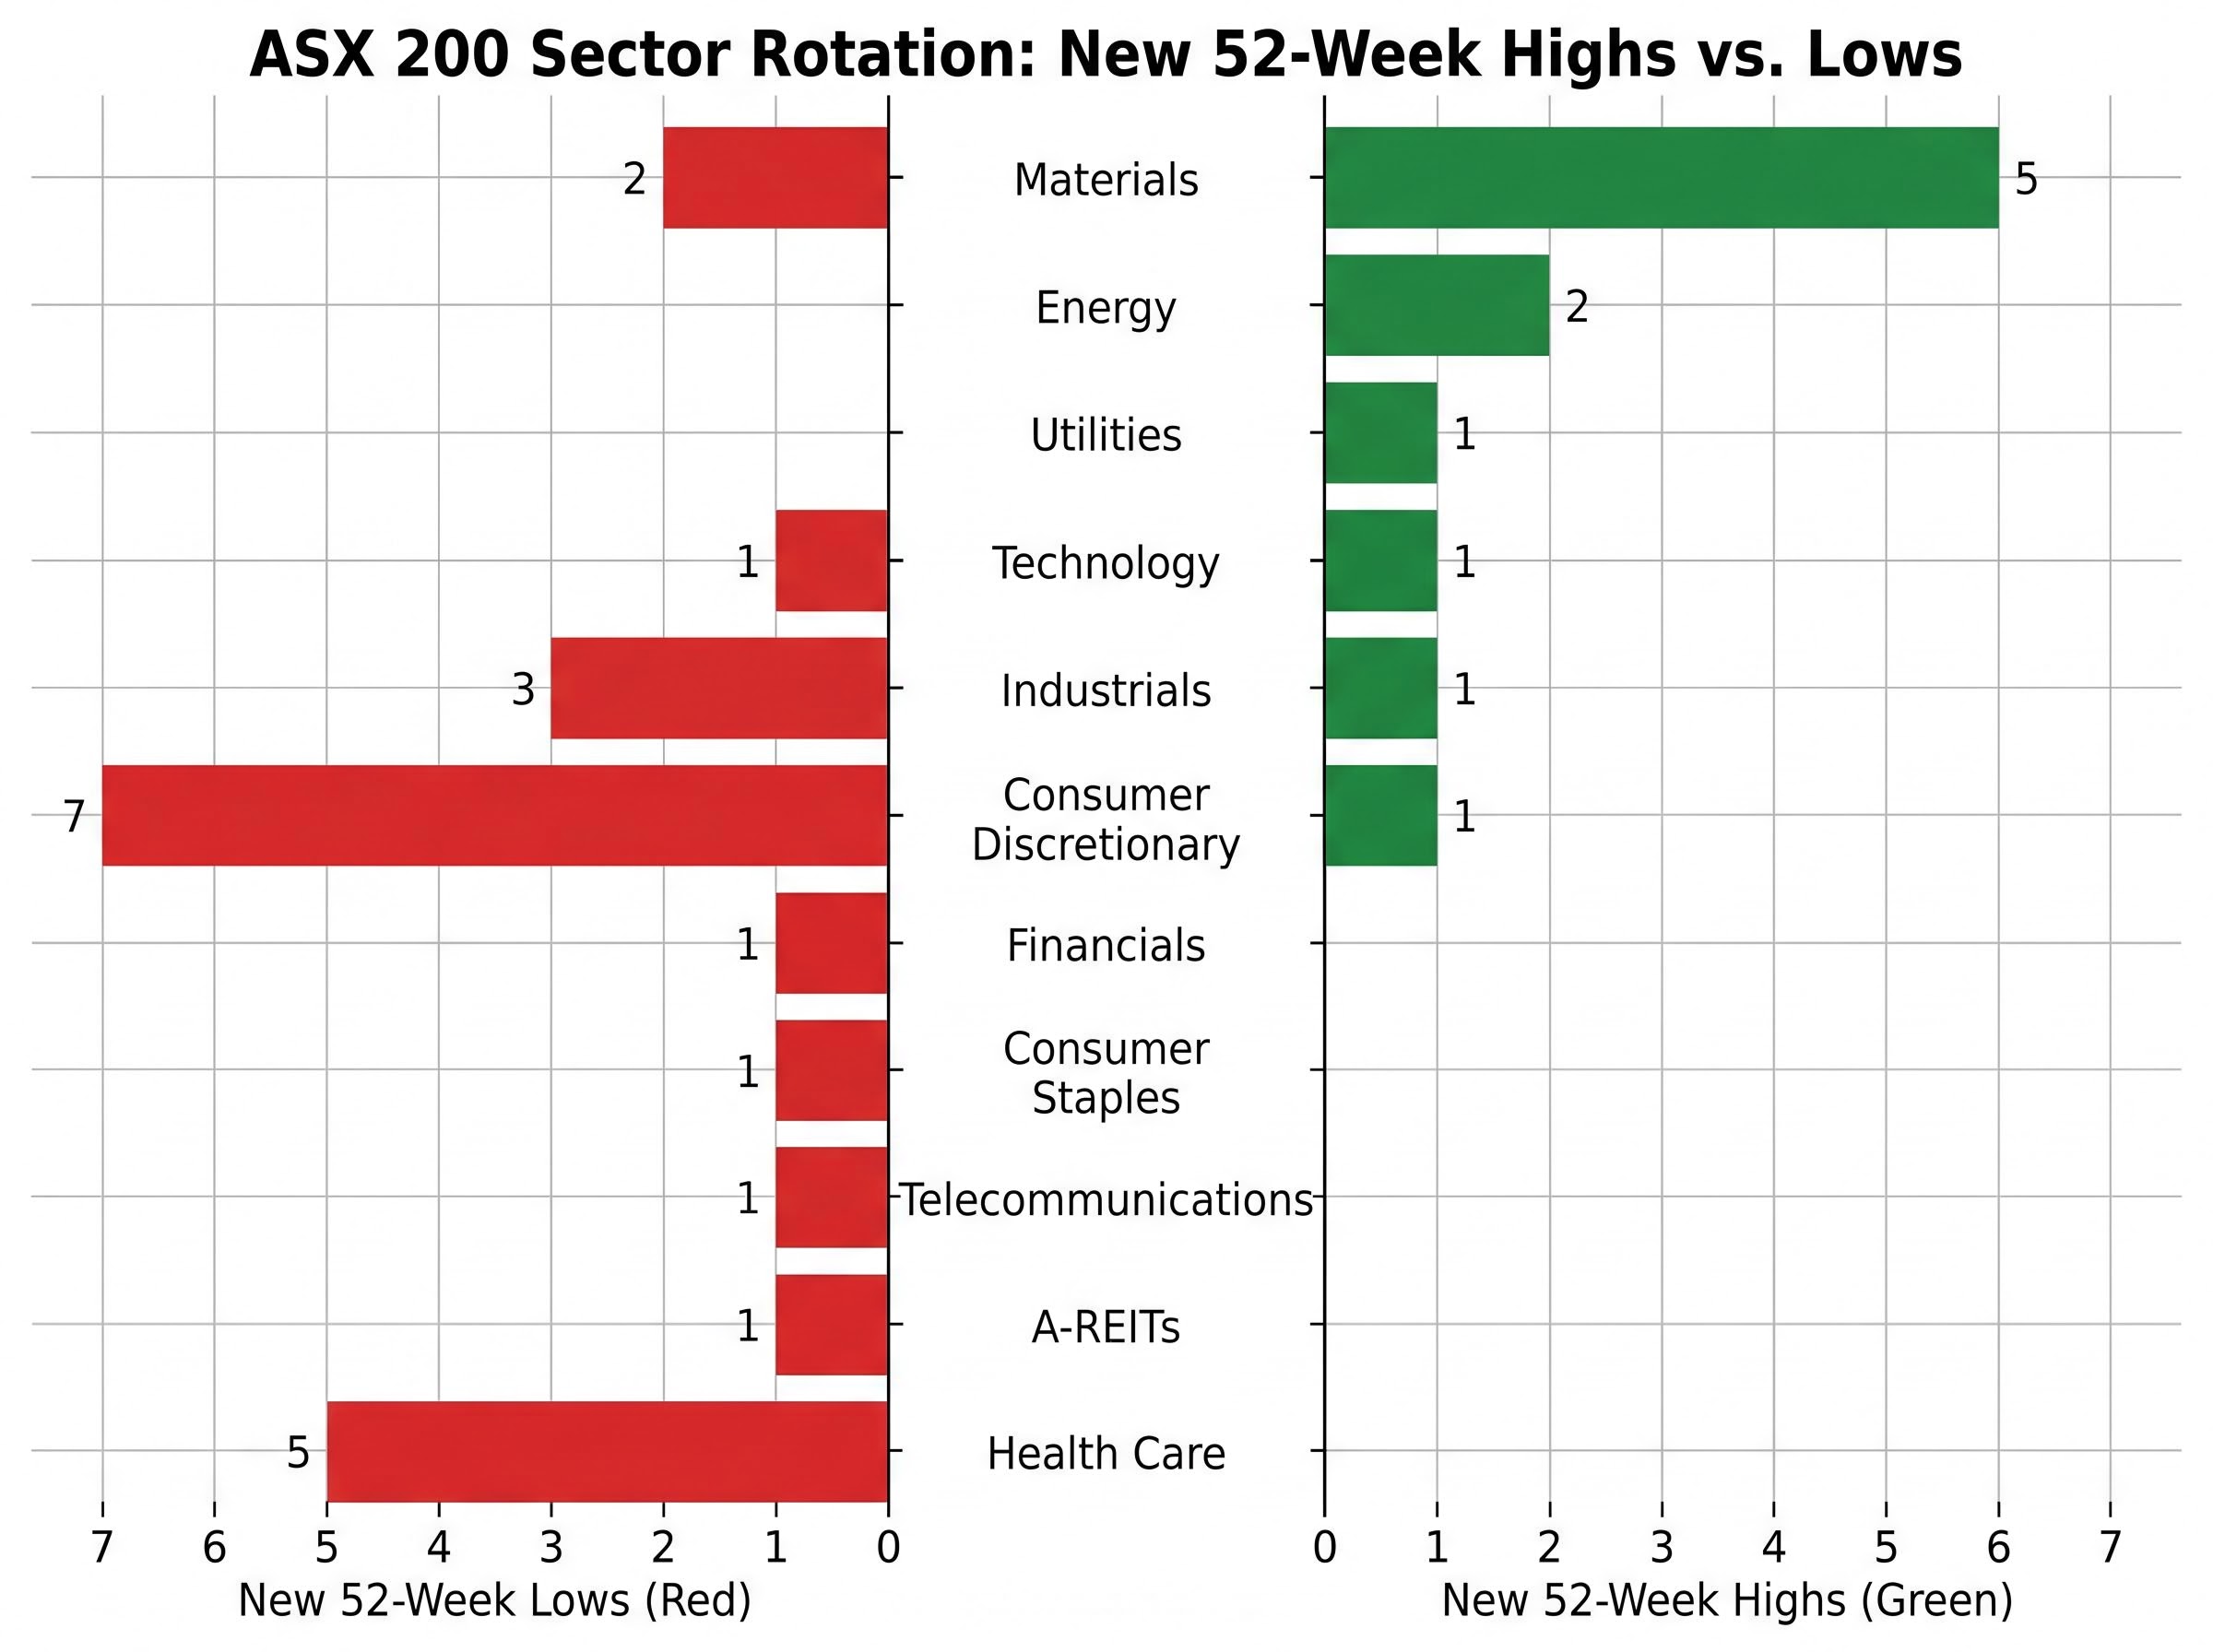
The distribution of new 52-week highs and lows across sectors maps the rotation with unusual clarity.
| Sector | New 52-Week Highs | New 52-Week Lows |
|---|---|---|
| Materials | 5 | 2 |
| Energy | 2 | 0 |
| Consumer Discretionary | 1 | 7 |
| Industrials | 1 | 3 |
| Utilities | 1 | 0 |
| Technology | 1 | 1 |
| Health Care | 0 | 5 |
| Financials | 0 | 1 |
| Consumer Staples | 0 | 1 |
| Telecommunications | 0 | 1 |
| A-REITs | 0 | 1 |
Energy produced two new highs and zero new lows. Health Care produced zero highs and five lows. Consumer Discretionary’s ratio of one high to seven lows is the week’s starkest sector-level signal.
Australia’s consumer price index rose to 4.6% in March 2026, up from 3.7% in the prior reading, pushing rate hike expectations higher ahead of the next central bank meeting. Rising inflation weighs directly on bank valuations through margin compression concerns and supports the commodities-as-inflation-hedge narrative that is channelling capital into Materials and Energy.
The ABS CPI data for March 2026 confirms the headline rate reached 4.6%, up from 3.7% in the prior reading, the official statistical basis for the rate hike expectations now pressuring domestic consumer and financial sector valuations.
On the energy side, Brent crude peaked at approximately $119-$126 per barrel in late April, driven by supply disruption fears. Thermal coal benefited as buyers sought alternatives to constrained LNG supply. Whitehaven Coal posted a +70.89% one-year return, while the S&P/ASX 200 Energy Index (XEJ) returned +48.96% over the same 12-month period.
The ASX energy sector repricing that followed Brent crude’s surge above $116 per barrel in late April created a direct transmission channel from oil markets into Australian inflation expectations, with RBC flagging headline CPI could peak at 5-6% if prices remain elevated, compressing equity multiples across rate-sensitive sectors at the same time it lifted Woodside, Santos, and Karoon.
A mild defensive tilt toward A-REITs (+1.05%) and Consumer Staples (+1.13%) on 1 May suggests cautious positioning without panic. The rotation is deliberate, not distressed.
Twenty-two ASX 200 constituents hit fresh 52-week lows in the week ending 1 May 2026, roughly 11% of the index at the lower bound of its one-year range in a single week. Against 11 new highs, the two-to-one ratio of lows to highs confirms deteriorating breadth beneath a flat headline number.
April 2026 consumer confidence posted its largest monthly decline since the COVID-19 pandemic period, providing the macro backdrop for the worst-affected sector.
Consumer Discretionary accounted for seven of the 22 new lows, the heaviest concentration of any sector. The declines are severe: Temple & Webster (TPW) is down 67.9% over one year, IDP Education (IEL) down 65.2%, Flight Centre (FLT) down 19.5%, and Harvey Norman (HVN) down 15.1%. These are not shallow pullbacks from recent highs; they are sustained declines reflecting weakened consumer spending conditions.
Health Care’s five new lows tell a different story. The scale of the annual declines raises structural rather than cyclical concerns:
For investors considering value plays in beaten-down sectors, the distinction between cyclical lows and structural lows is the relevant question. Consumer Discretionary names may recover with consumer confidence; Health Care names carrying multi-year growth downgrades face a longer path.
Capital rotation toward global index products is running in parallel with the domestic sector rotation this week’s data captures, with younger investors systematically moving from ASX stock selection into international ETFs targeting technology and healthcare, the same sectors that are producing the week’s worst domestic performers as offshore capital exits them.
Cleanaway Waste Management reduced guidance during the period, attributing the cut to Middle East-related factors affecting operations. The revision removed near-term earnings visibility at a point where the stock was already under pressure.
Orora (ORA) received a material Saverglass earnings downgrade for FY26, driven by lower volumes and an adverse product mix shift. The downgrade shifted consensus expectations meaningfully lower.
Iress (IRE) guided in late April that FY26 revenue is expected to land at the bottom of its $520-$528 million guidance range, announced on 23 April 2026.
The week’s data synthesises into a single rotation thesis. Institutional capital is moving out of domestic consumer exposure and growth-sensitive Health Care into commodity-linked and inflation-resistant names. The 52-week high and low distribution is the clearest weekly confirmation of that shift.
The durability of the rotation depends on three variables investors should monitor:
ASX 200 technical summary: RSI (14-day) at approximately 46 (neutral), with the 9,230 resistance level unbroken. The broader index has not confirmed the rotation with a bullish breakout.
The ASX 200’s year-to-date return remains approximately flat, with a one-year return of roughly +5.5%. The index-level RSI at 46 and the unbroken 9,230 resistance level mean the broader market has not confirmed the rotation with a directional move. For now, the divergence is a sector-level trade rather than a broad market signal. Investors who understand the rotation thesis and its conditions can position deliberately rather than chasing individual stock momentum without the macro scaffolding that supports it.
For investors wanting to build an actionable response to the macro backdrop shaping the rotation, our dedicated guide to ASX sector positioning around RBA decisions maps which sectors have historically moved first and fastest in easing cycles, why bank stocks are typically weaker short-term beneficiaries than REITs and infrastructure, and how the deposit-to-equity rotation creates a structural bid for dividend-paying names among SMSF investors.
Within a flat and range-bound index, 11 stocks reached annual highs and 22 reached annual lows in a single week. The divergence maps almost perfectly onto commodity exposure versus domestic consumer and growth sensitivity.
The three lithium names at the centre of the week’s signal are not noise. Liontown at +412.6%, Pilbara Minerals at +314.86%, and Mineral Resources at +209.42% over one year represent the market’s verdict on where commodity fundamentals currently sit. The question for the weeks ahead is whether the ASX 200 can clear 9,230 resistance with the same sector mix leading, or whether the rotation stalls at the index level even as individual stocks continue making highs.
+412.6%: Liontown Resources’ one-year return as of 1 May 2026, the largest annual gain among all ASX 200 constituents reaching fresh 52-week highs during the week.
This article is for informational purposes only and should not be considered financial advice. Investors should conduct their own research and consult with financial professionals before making investment decisions. Past performance does not guarantee future results. Financial projections are subject to market conditions and various risk factors.
A 52-week high means a stock is trading at its highest price in the past 12 months, indicating that every investor who bought shares over that period is in profit. It can signal either a fundamental re-rating or a technical momentum breakout, and distinguishing between the two is critical for assessing whether the move is sustainable.
Eleven ASX 200 stocks hit new 52-week highs in the week ending 1 May 2026, including Liontown Resources (+412.6%), Pilbara Minerals (+314.86%), Mineral Resources (+209.42%), Codan (+166.3%), and APA Group (+25.6%), among others spanning Materials, Energy, Technology, Industrials, Utilities, and Consumer Discretionary.
Lithium carbonate spot prices averaged approximately $15,000 per tonne in April 2026, up 5% month-on-month, supported by 2.1 million EV unit sales in China during Q1 2026. This demand-led commodity recovery drove institutional buying into lithium names like Liontown Resources, Pilbara Minerals, and Mineral Resources.
Consumer Discretionary and Health Care are producing the most new 52-week lows on the ASX, with Consumer Discretionary accounting for seven of the 22 new lows in the week ending 1 May 2026 and Health Care accounting for five, with names like Cochlear down 63.1% and CSL down 50.2% over one year.
When new 52-week lows significantly outnumber new highs, it signals deteriorating market breadth even if the index itself appears flat. In the week ending 1 May 2026, the two-to-one ratio of lows (22) to highs (11) confirmed a sector rotation already underway beneath a broadly flat ASX 200 headline return.