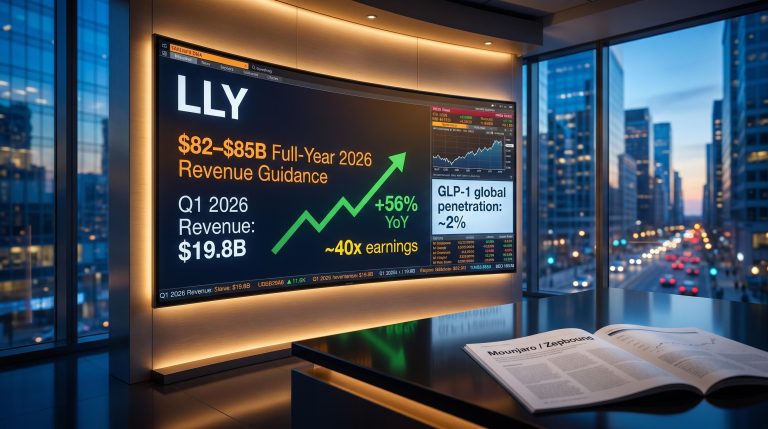
Eli Lilly at 40x Earnings: Expensive Stock, Underpenetrated Market
31 mins ago

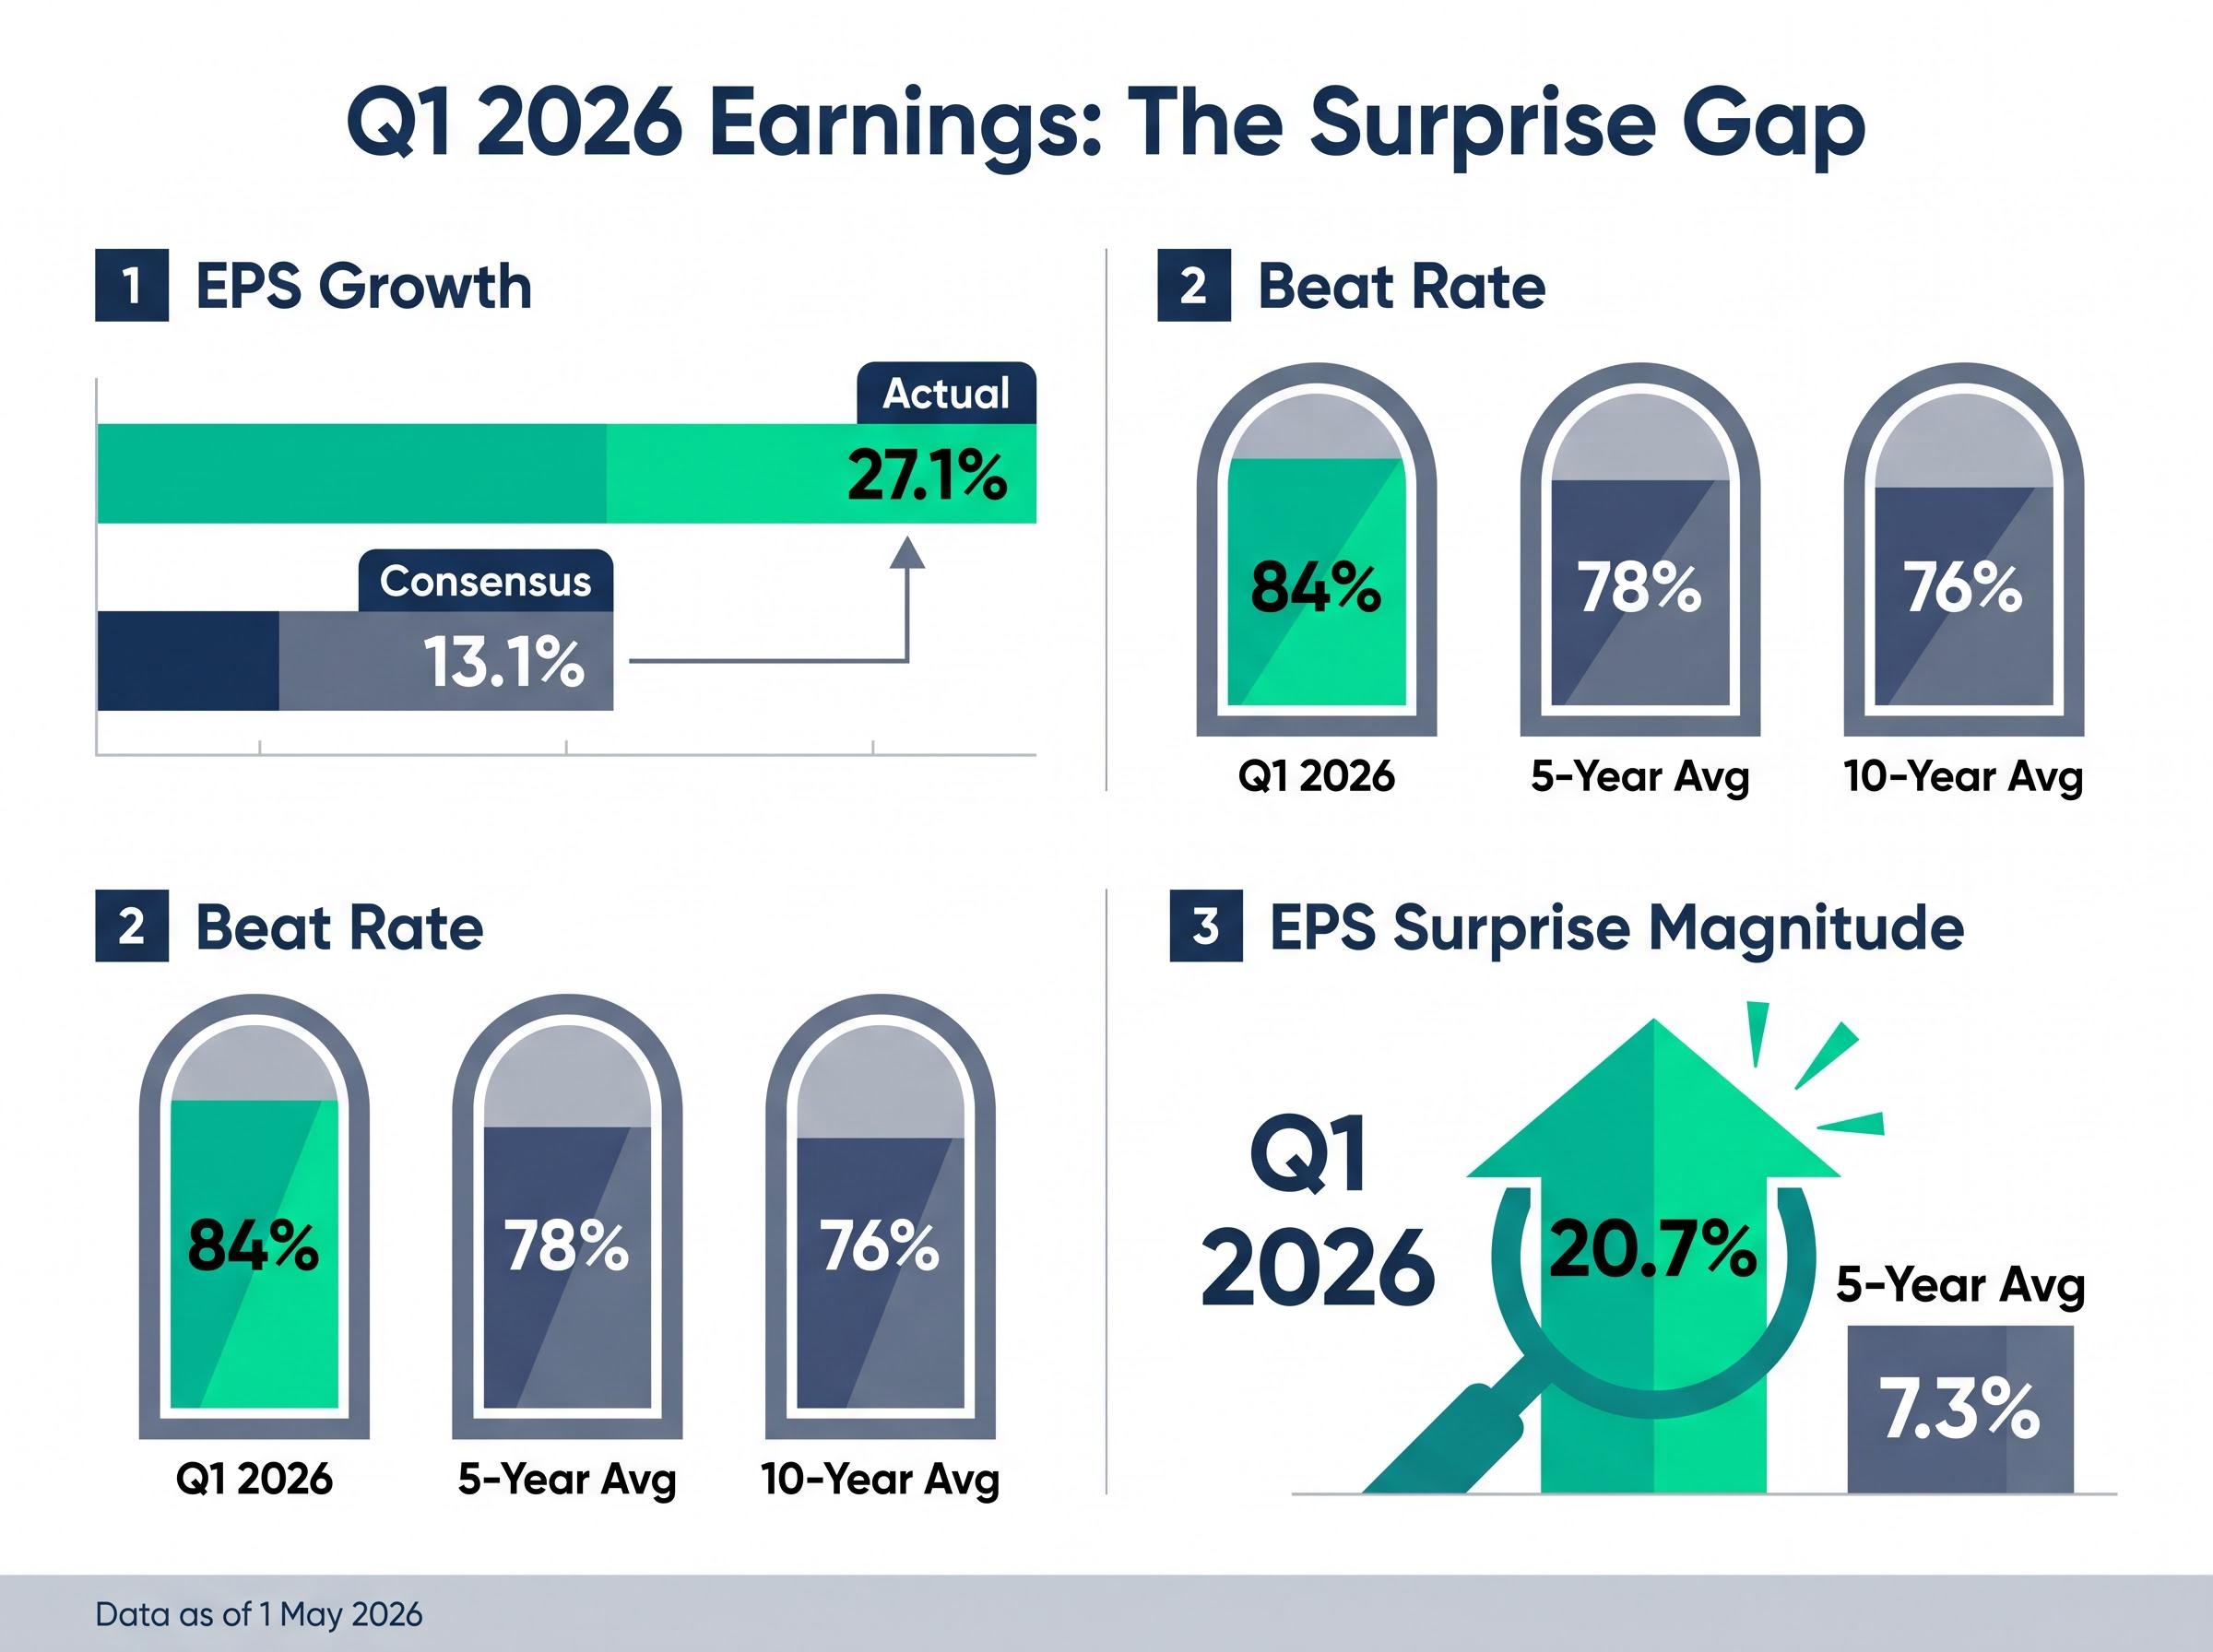
With 63% of S&P 500 companies having reported first-quarter results as of 1 May 2026, the earnings season has delivered a blended EPS growth rate of 27.1%, more than double the 13.1% consensus estimate that stood at quarter-end. The beat rate of 84% sits above both the five-year average of 78% and the ten-year average of 76%. The aggregate earnings surprise of 20.7% is nearly three times the five-year norm of 7.3%. These are not marginal improvements over expectations. They represent the widest positive divergence from initial estimates in years, driven by AI revenue acceleration, cloud momentum, and consumer resilience. The question now facing investors is whether those forces are durable enough to justify the valuations and capital commitments attached to them. This analysis maps what drove the blowout, which sectors and companies are genuinely winning, where the debates are sharpest, and what the forward earnings trajectory implies for positioning through the rest of 2026.
Start with what FactSet reported on 1 May 2026: blended S&P 500 EPS growth of 27.1%, against a quarter-end consensus of 13.1%. That is not a typical upside surprise. It is a gap wide enough to force a recalculation of the full-year earnings base.
The headline metrics tell the story in sequence:
FactSet’s S&P 500 Earnings Season Update, published on 1 May 2026, is the primary data source for the blended EPS growth rate, beat rate, and aggregate surprise figures cited throughout this analysis, with historical five-year and ten-year averages drawn from the same report.
The aggregate Q1 2026 EPS surprise of 20.7% above estimates compares to a five-year average of 7.3%, the single comparison that best captures the exceptionalism of this earnings season.
According to Seaport Research, non-technology companies delivered their strongest positive surprises since Q4 2024. Revenue beat rates confirm this is top-line strength, not margin engineering alone. A Q1 this strong resets the earnings base from which forward growth is calculated, and that recalculation changes the math on full-year EPS trajectories.
The week that produced these results was the single most concentrated reporting period of the season, with companies representing roughly 44% of S&P 500 market cap reporting simultaneously; the forward guidance signals from that window, particularly across AI infrastructure, pharma pipelines, and consumer goods margins, were always going to carry more weight than the backward-looking quarterly numbers themselves.
Nine of eleven S&P 500 sectors reported year-over-year earnings growth in Q1, with seven posting double-digit gains. Breadth is real. But the distribution is uneven enough that a sector-level reading tells a materially different story from the aggregate headline.
| Sector | YoY EPS Growth | Notable Driver |
|---|---|---|
| Communication Services | Strong double-digit growth | Alphabet cloud and advertising acceleration |
| Information Technology | Approximately 50% | AI monetisation and cloud momentum |
| Consumer Discretionary | Double-digit growth | Amazon earnings surprise |
| Health Care | YoY decline | Sector-specific headwinds |
| Energy | YoY decline (reported) | Hedge timing effects on net income |
Information Technology sector EPS growth ran at approximately 50%, against approximately 30% for the broader index. The Magnificent Seven, excluding Nvidia, are on track for Q1 earnings growth of 57%, versus an 18% estimate at the start of the season. Communication Services, Consumer Discretionary, and Materials round out the leaders, but IT and Comms are operating in a different category of outperformance.
Exxon reported adjusted EPS of $1.16 against a consensus of $1.00, a 16% beat. Chevron posted adjusted EPS of $1.41 versus $0.95 consensus, a 48% beat. Both companies exceeded expectations on an adjusted basis.
The reported numbers told a different story. Exxon’s net income declined 45% year-over-year, driven by approximately $4.7 billion in combined hedge charges. Chevron’s net income fell 36%, with a $2.9 billion financial hedge charge. Exxon CEO Darren Woods flagged that Middle East production exposure (approximately 15% of output) creates Q2 downside risk if the Strait of Hormuz remains closed, with a potential output reduction of 750,000 barrels per day. The distinction between adjusted and reported earnings is one investors reading headline numbers need to register.
Alphabet delivered the single most striking result of Q1 2026: revenue of $109.9 billion (up 22% year-over-year), with EPS of $5.11 against an analyst estimate of $2.63. Google Cloud grew 63% year-over-year, and its order backlog approximately doubled.
Alphabet reported EPS of $5.11 against a $2.63 consensus estimate, a near-doubling of expectations that stands as the starkest single-company illustration of Q1’s surprise magnitude.
Microsoft beat Q1 expectations but saw shares fall approximately 3% post-result. The stock is down 14% year-to-date, making it the weakest Magnificent Seven performer. The Street’s scepticism centres on forward estimate sustainability given Microsoft’s OpenAI-anchored strategy and cloud growth comparisons against Alphabet’s acceleration.
| Metric | Alphabet | Microsoft |
|---|---|---|
| Q1 EPS vs. estimate | $5.11 vs. $2.63 | Beat (shares fell ~4%) |
| Revenue growth | 22% YoY | Positive, but scrutinised |
| Cloud growth | 63% YoY | Below Alphabet comparison |
| 2026 capex guidance | $180-190 billion | $190 billion |
| YTD stock performance | Up ~23% | Down ~14% |
Alphabet shares rose approximately 10% post-results and are up 23% year-to-date, the best Magnificent Seven performance. The single-day market cap divergence between Alphabet and Meta reached $566 billion. The market is no longer treating all hyperscalers as equivalent AI beneficiaries. It is differentiating on monetisation evidence, and that distinction has direct implications for investors holding broad technology exposure.
Combined 2026 capital expenditure guidance from the four largest hyperscalers has surpassed $700 billion in aggregate. The individual commitments, ranked by scale:
The $700 billion AI infrastructure investment cycle is already reshaping the semiconductor supply chain in structural rather than cyclical ways: approximately 75% of that capital is directed toward physical hardware and data center construction, and hyperscaler capex has reached approximately 2% of US GDP, a scale at which the spending itself becomes a macroeconomic variable rather than simply a corporate allocation decision.
According to MarketWatch, critics have characterised this combined spend as “the greatest capital misallocation in history,” pointing to unproven return timelines and uncertain monetisation paths.
The bull case rests on Q1 evidence. AI-driven revenue acceleration at Alphabet, Meta, and Amazon provides early return-on-invested-capital validation. Google Cloud’s order backlog approximately doubled. AWS backlog rose around 50%. The argument is that monetisation is arriving ahead of the conservative timelines embedded in capex guidance.
The bear case gained ammunition when reports indicated OpenAI missed internal weekly user and revenue targets, triggering sharp declines in SoftBank and Oracle. Whether this cycle produces high-ROIC outcomes or becomes an oversupply problem is the dominant variable in the 2026 technology earnings story.
Amazon’s internally developed chips have reached a revenue run rate exceeding $20 billion, presenting a direct competitive challenge to Nvidia’s position in AI infrastructure. Nvidia shares fell 8.4% over four trading sessions as market participants reassessed the durability of its dominance.
This is structural pressure, not cyclical. Hyperscaler vertical integration in chips reduces dependence on third-party GPU suppliers over time, and the $20 billion run rate suggests the substitution is already commercially significant.
The Q1 beat has not been treated as a one-quarter anomaly by consensus forecasters. Full-year 2026 S&P 500 EPS growth is now estimated at 21.3%, with above-20% growth projected across every remaining quarter.
| Period | Estimated EPS Growth |
|---|---|
| Q2 2026 | 21.3% |
| Q3 2026 | 23.0% |
| Q4 2026 | 20.6% |
| Full Year 2026 | 21.3% |
A forward P/E of approximately 19.8x means strong earnings are partially priced in, but not fully. Valuation re-rating from here requires either multiple expansion or continued upside surprises. GDP growth projected at 2.2% for 2026 supports an above-trend earnings environment, though the Fed’s hawkish posture introduces rate sensitivity that could compress multiples if inflation data deteriorates.
Beneath the aggregate numbers, capital is already rotating:
The rotation into small-cap, value, and “old economy” sectors including Industrials, Consumer Staples, and Materials suggests investors are broadening their earnings exposure beyond mega-cap technology.
The April 2026 market breadth reading complicates any straightforward bullish interpretation of the index gain: only 23% of S&P 500 constituents outperformed the benchmark during a month when the index itself posted a 98th-percentile return, the fourth-lowest participation rate in nearly four decades of data.
An 84% beat rate and 20.7% aggregate surprise invite a reasonable question: if companies consistently beat estimates by this margin, what does the beat actually mean?
The mechanics are well understood. Companies guide conservatively. Analysts embed that guidance into models. Actual results reflect operational reality the guidance was designed to understate. The system produces upside surprises by design, and the five-year average surprise of 7.3% (ten-year average of 7.1%, per FactSet) reflects the structural baseline of that conservatism.
The Q1 2026 aggregate earnings surprise of 20.7% is nearly three times the five-year average of 7.3%, the defining metric of this season’s exceptionalism.
What separates Q1 2026 is degree. A 20.7% aggregate surprise is not the system working normally. It is the system absorbing a positive shock. When capex guidance conservatively models revenue return timelines, the first evidence of monetisation arriving ahead of schedule produces disproportionately large positive surprises. Alphabet’s EPS of $5.11 versus a $2.63 estimate is the clearest illustration: the conservative AI capex model met accelerating cloud revenue, and the gap was enormous.
Investors who understand this mechanism are better positioned to assess whether a beat reflects genuine outperformance or simply the unwinding of artificially low guidance. In a season where surprises are nearly three times the historical norm, that distinction carries financial weight.
Berkshire Hathaway reported Q1 operating earnings up 18% to $11.35 billion, with cash and equivalents reaching a record $397.4 billion. New CEO Greg Abel has indicated no appetite for large acquisitions at current valuations.
Warren Buffett has characterised the current environment as exhibiting excessive speculative behaviour. Berkshire’s position represents one independent data point suggesting a historically disciplined capital allocator sees limited margin of safety in current equity prices, even against a strong earnings backdrop.
Q1 2026 was an objectively exceptional earnings season by every standard metric. The beat rate, the surprise magnitude, the revenue quality, and the sector breadth all confirm it. The debates it leaves unresolved, however, are not smaller than the results that preceded them.
The inflationary picture has sharpened since quarter-end:
The ISM Manufacturing PMI Prices Index registered 84.6 in April 2026, its highest reading since April 2022, confirming that input cost pressures are running at a level historically associated with Fed tightening cycles rather than the easing environment that current forward earnings multiples assume.
ISM Prices Paid at 84.6, the highest since April 2022, captures the inflationary pressure sitting beneath the optimistic earnings narrative.
Real PCE growth of 2.1% year-on-year through March 2026 confirms consumer resilience but not momentum acceleration. The forward P/E of 19.8x leaves limited room for error if any of the outstanding variables disappoint.
The questions Q2 must answer are specific. Can AI monetisation sustain the cloud growth rates that drove Q1 surprises? Will the sector rotation into small-caps and value hold if earnings breadth narrows? Does a 19.8x forward multiple accommodate the risk that inflation forces the Fed to delay easing further?
A strong earnings quarter is a foundation, not a ceiling. The positioning questions it raises are more consequential than the headline beat rate.
This article is for informational purposes only and should not be considered financial advice. Investors should conduct their own research and consult with financial professionals before making investment decisions. Past performance does not guarantee future results. Financial projections are subject to market conditions and various risk factors.
The Q1 2026 earnings season beat rate stands at 84%, above the five-year average of 78% and the ten-year average of 76%, with an aggregate EPS surprise of 20.7%, nearly three times the five-year norm of 7.3%.
Information Technology led with approximately 50% EPS growth driven by AI monetisation and cloud momentum, while Communication Services and Consumer Discretionary also posted strong double-digit gains; Health Care and Energy were the two sectors that reported year-over-year declines.
The four largest hyperscalers, Microsoft, Alphabet, Meta, and Amazon, have collectively committed over $700 billion in 2026 capital expenditure, with Microsoft guiding $190 billion, Alphabet $180-190 billion, and Meta $125-145 billion.
Following the Q1 blowout, full-year 2026 S&P 500 EPS growth is now estimated at 21.3%, with above-20% growth projected in every remaining quarter of the year.
Key risks include ISM Prices Paid jumping to 84.6 in April 2026 (the highest since April 2022), Brent crude above $105 per barrel, Federal Reserve hawkishness on inflation, and a forward P/E of approximately 19.8x that leaves limited margin for error if any of these variables deteriorate.