Gold Surges Toward US$4,200 as JPMorgan Eyes US$4,500 by Q4
8 mins ago

VGS gained 5.3% in April 2026, more than three times the return of the Australian share market over the same period. The fund that delivered that result, however, is not quite what its “international shares” label implies.
Australian investors directed $17.3 billion into global equity exchange-traded funds (ETFs) in 2025 alone, and VGS was one of the primary beneficiaries. The April rebound followed a 4.38% decline in March 2026, making it a recovery story as much as a performance one. For investors evaluating VGS now, the timing raises a live question: what exactly did they (or would they) own during that volatile stretch?
The Australian ETF market reached $330 billion in assets under management by end-2025, a figure that reflects nearly five times the market size recorded in 2020, with 411,000 new investors entering the market in 2025 alone as low-cost index products displaced actively managed funds in mainstream retail portfolios.
What follows contextualises the April performance within the March drawdown, explains the structural concentration that shapes the fund’s returns, examines its 3, 5, and 10-year track record, and lays out the considerations Australian investors should weigh before treating this ETF as genuine global diversification.
The headline is compelling. VGS opened April 2026 at $141.15 per unit and closed the month at $148.63, delivering a total return of 5.3%. By comparison, VAS, the Vanguard Australian Shares ETF, returned 1.46% over the same period.
That outperformance, though, reads differently when set beside the prior month. In March 2026, VGS fell 4.38%. An investor who held through both months saw a partial recovery rather than a clean gain. The net position across March and April remained marginally positive, but the drawdown-and-rebound pattern is worth more attention than the April number alone.
The broader conditions that supported April’s rebound were external to the fund itself. US equity markets reached record highs on the back of strong Big Tech earnings, and risk sentiment improved materially.
The VIX fell to 16.93 in late April 2026, a nearly 10% single-session drop signalling a meaningful shift in risk appetite.
That shift in volatility was the tailwind. The question is whether investors recognised the March loss and April gain as two halves of the same sequence, or whether the April figure alone shaped their assessment.
The fund’s official description is reassuring. VGS tracks the MSCI World ex-Australia Index, providing exposure to more than 3,500 individual securities across 20-plus developed economies. For an investor searching for a single ETF to cover “international shares,” the breadth appears genuine.
The portfolio’s actual composition tells a different story. US-listed stocks are reported to account for more than 72% of the total portfolio, though this specific geographic weighting could not be independently verified against Vanguard’s official March 2026 factsheet and should be treated as approximate. What is confirmed is the concentration at the top of the holdings list.
ASIC’s Regulatory Guide RG 282 sets out the disclosure and issuer obligations that apply to exchange-traded products listed on the ASX, establishing the transparency standards investors can rely on when evaluating product-level information such as index methodology, portfolio composition, and fee structures.
| Holding | Approximate weighting | Country of listing |
|---|---|---|
| Nvidia | 5.38% | United States |
| Apple | Top holding (combined with Nvidia: >10%) | United States |
| Microsoft | Top holding | United States |
| Amazon | Top holding | United States |
Together, these four names carry a combined weighting approaching 16% of the entire fund. The remaining geographic exposure includes:
Passive index concentration risk is not unique to VGS; by April 2026 the Magnificent Seven group represented nearly 33.7% of the S&P 500, meaning that any cap-weighted international index with significant US exposure carries the same structural tilt toward a small number of companies whose AI capital expenditure commitments now function as a macro-level market driver.
The annual management fee sits at 0.18%, which is competitive for the exposure provided. But competitive pricing does not change the structural reality: an investor who buys VGS is making a large, concentrated bet on US large-cap equities wrapped in the language of global diversification.
Because US mega-cap technology dominates the fund’s weighting, VGS returns track closely with the S&P 500 and Nasdaq. The April 2026 alignment illustrates this directly: Alphabet surged on strong AI capital expenditure results, Qualcomm rallied, and the broader US tech sector carried global indices higher.
The April 2026 rally in Alphabet and Qualcomm that helped carry VGS higher was driven partly by earnings results that validated near-term AI infrastructure spending, but hyperscaler capital expenditure commitments projected at $610-650 billion collectively in 2026 are increasingly scrutinised for software monetisation timelines and supply chain bottlenecks that could reverse the same sentiment in future quarters.
This correlation works in both directions. The same concentration that powered the fund’s strong long-term returns is the reason it fell 4.38% in March 2026 when US tech sold off. For investors, the implication is straightforward: VGS behaves more like a US technology allocation than a geographically balanced international portfolio.
Short-term drawdowns attract attention. Compounding over a decade tends to resolve them, and VGS’s long-term track record makes this case clearly.
| Time horizon | Annualised total return (to 31 March 2026) |
|---|---|
| 3 years | 16.08% |
| 5 years | 12.76% |
| 10 years | 13.26% |
The three-year figure of 16.08% reflects the period that captured the strongest phase of US technology-led growth, including the AI infrastructure spending cycle that lifted Nvidia and peers. The five-year number, at 12.76%, includes the pandemic volatility of 2020-2021 and subsequent recovery. The 10-year figure, at 13.26%, smooths across multiple drawdowns and recoveries to show what sustained exposure to this index has delivered.
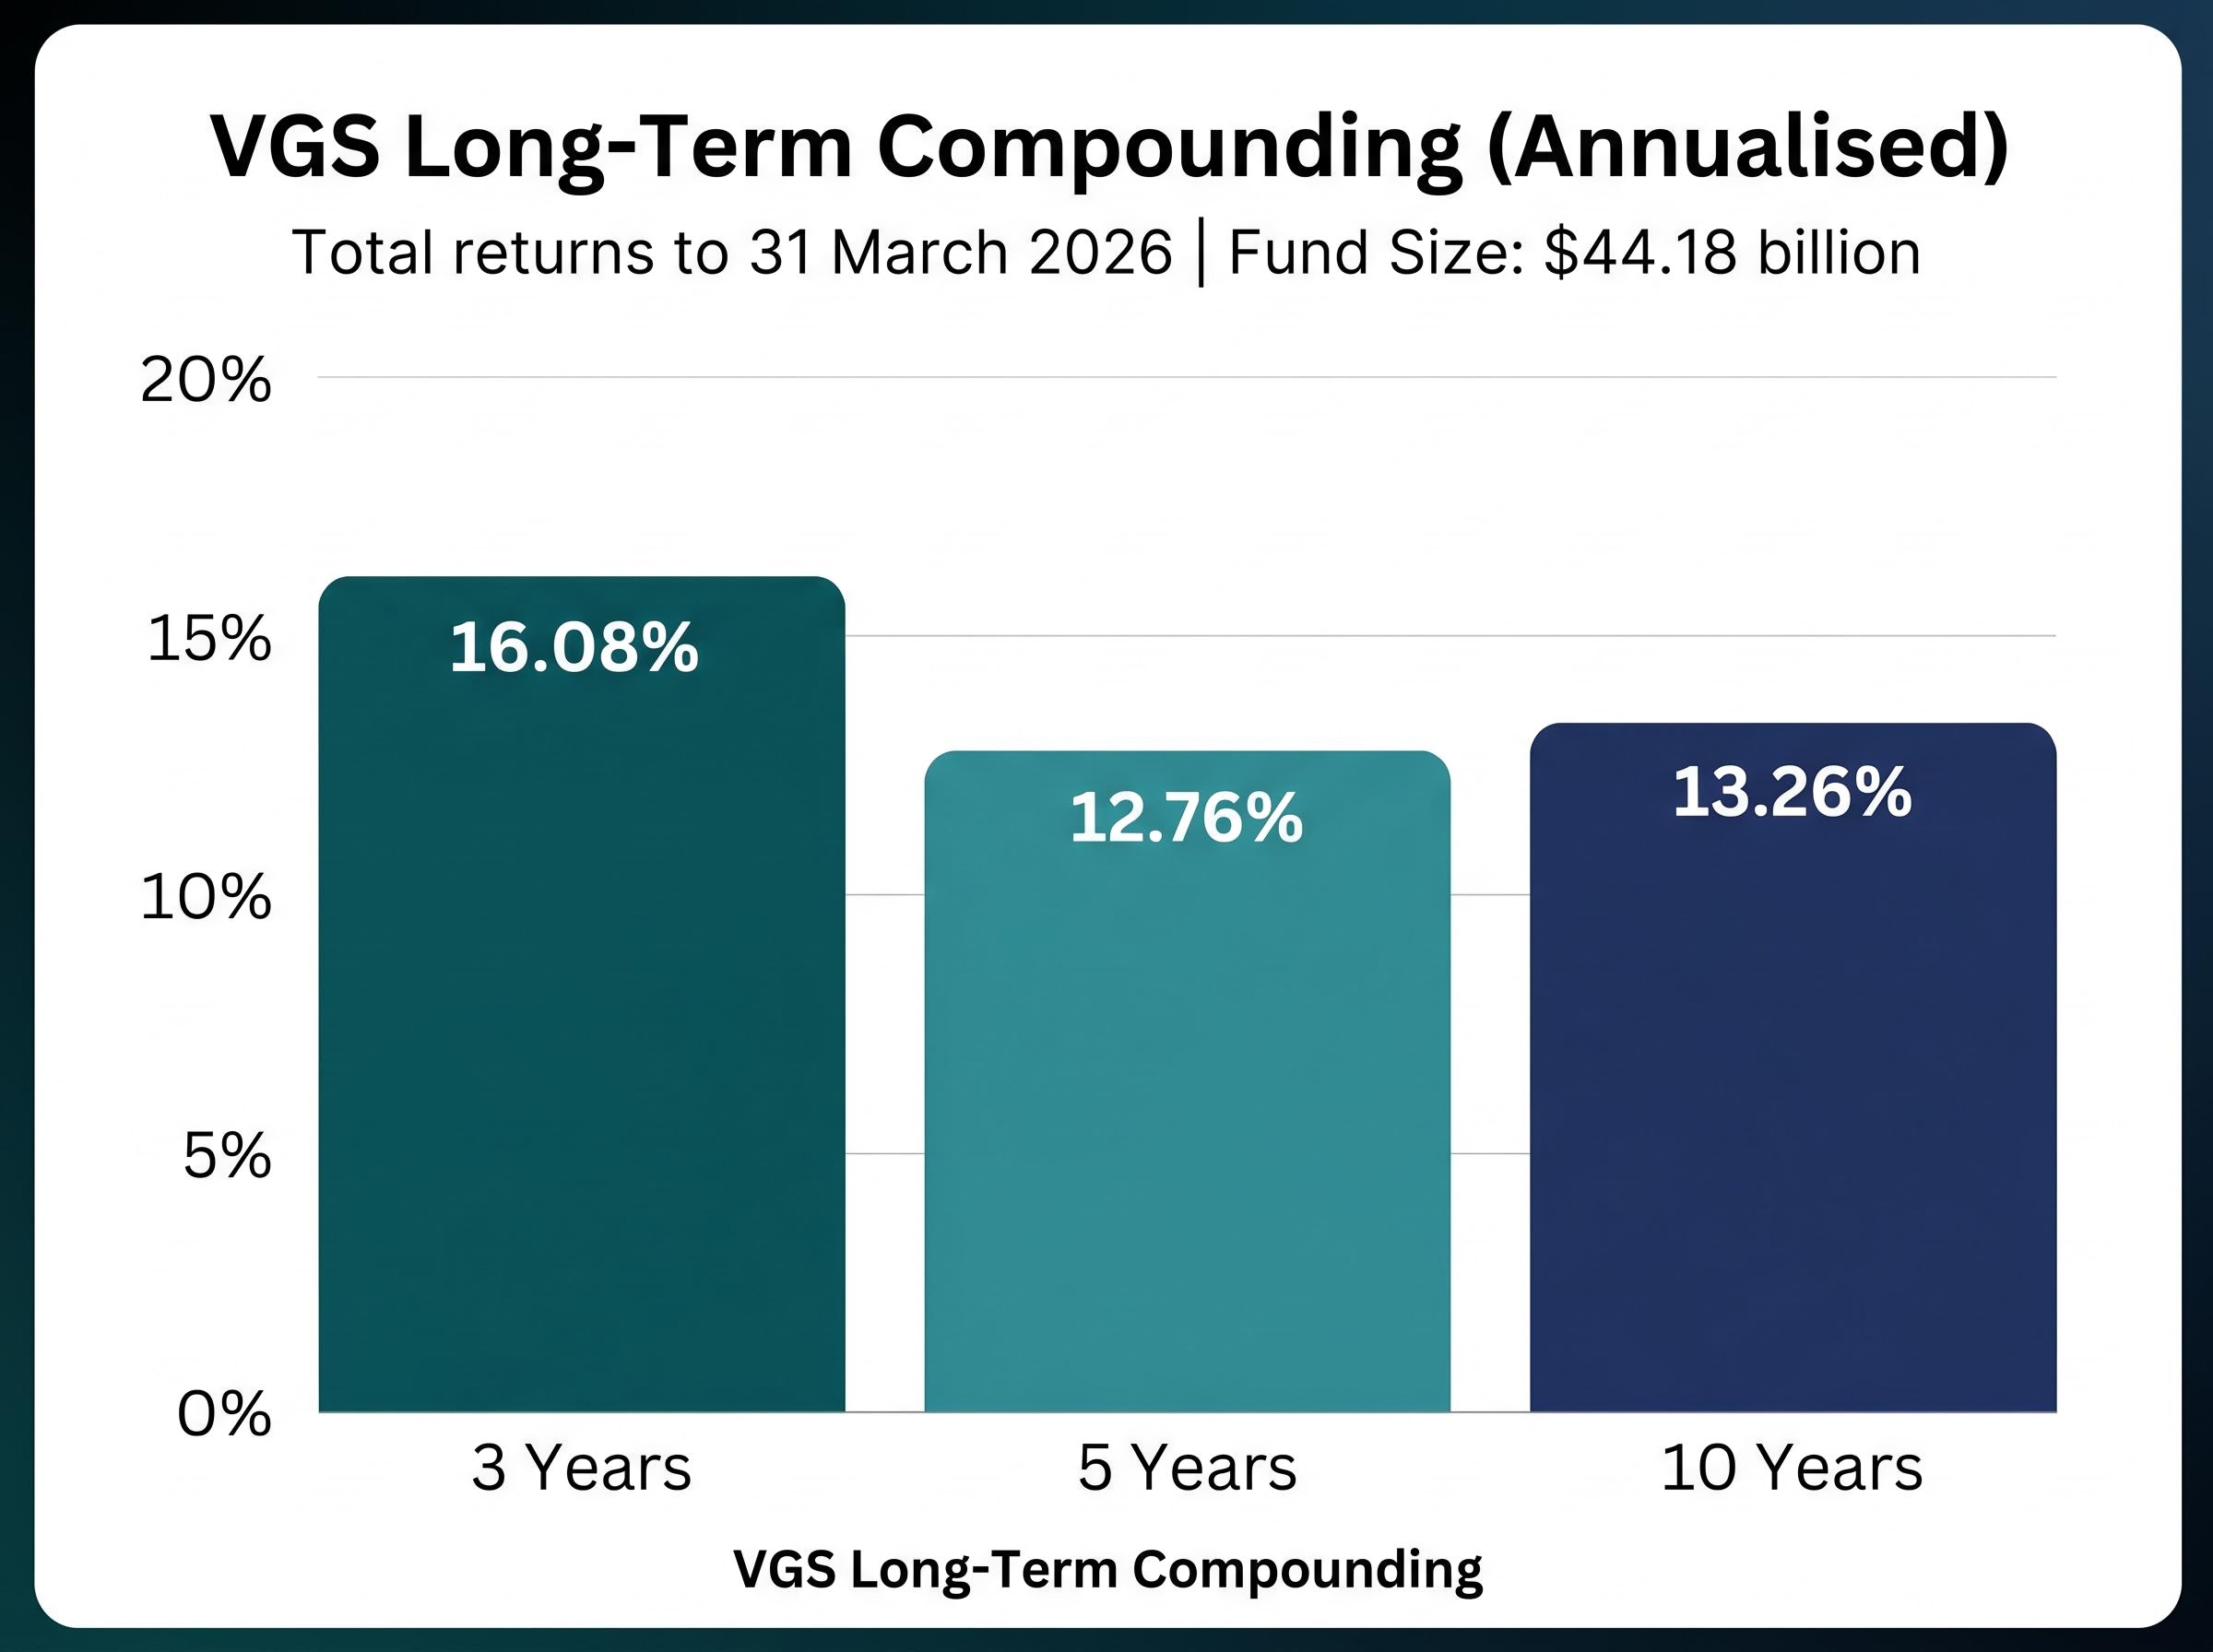
VGS delivered an annualised total return of 13.26% over the decade to 31 March 2026, a figure that reflects the sustained dominance of US technology in global indices.
These are unhedged returns. AUD/USD movements have contributed to, and at times reduced, the figures Australian investors actually received. A weakening Australian dollar over parts of the past decade amplified returns when converted back to AUD; periods of AUD strength worked in the opposite direction.
The fund’s scale reflects investor conviction in this track record. VGS held approximately $44.18 billion in assets under management as of 31 March 2026, reported but not independently confirmed to the exact figure. That positions it among the largest internationally focused ETFs on the ASX, supported by the broader wave of $17.3 billion in global equity ETF inflows in 2025 and a total Australian ETF market that reached $330 billion by year end.
The performance numbers are one side of the evaluation. The structural considerations are the other, and they deserve weight that matches the return figures rather than sitting as an afterthought.
Three distinct risk dimensions apply:
The VIX decline to 16.93 in late April illustrated how quickly sentiment can shift for funds with this profile. A single earnings miss from a top holding could reverse the same dynamic.
VGAD, the Vanguard MSCI Index International Shares (Hedged) ETF, tracks the same underlying index as VGS but uses currency hedging to neutralise AUD/USD fluctuations. For investors who want to isolate equity market returns from currency movement, VGAD removes one variable from the equation.
Hedging carries a cost, typically reflected in slightly different returns over time compared to the unhedged version. The better choice depends on an investor’s view of the Australian dollar’s direction and the currency exposures already present elsewhere in their portfolio. IVV, the iShares S&P 500 ETF, represents a different trade-off entirely: deliberate, concentrated US-only exposure rather than the broader developed-market index VGS tracks.
With 2025 delivering a record $53 billion in Australian ETF inflows and 62 new ETF listings, the range of available alternatives has never been wider.
The analytical threads converge on a single point. VGS performs well when US large-cap technology leads global equity markets, and it struggles when that sector faces headwinds. The 5.3% April rebound and the 13.26% 10-year annualised return are both products of the same structural concentration.
That concentration is not a flaw; it is a feature that investors should recognise and accept deliberately. At approximately $44.18 billion in assets under management and a management fee of 0.18%, VGS offers cost-efficient, liquid access to the growth trajectory of the world’s largest companies. It does not, however, offer the geographic diversification its name implies.
Before sizing a position, three questions deserve clear answers:
Investors who conclude that VGS’s US tech concentration is too high for their full international allocation often apply a core-and-satellite portfolio framework, reserving a diversified broad-index ETF as the core position while using targeted satellite holdings in individual stocks or sector ETFs to adjust specific geographic or thematic exposures without abandoning the cost efficiency of passive indexing.
VGS remains one of the most efficient vehicles on the ASX for accessing the long-term growth of US large-cap technology and broader developed-market equities through a single, low-cost holding. Its track record over a decade supports that case with evidence rather than promise.
The distinction that matters is between what VGS is labelled and what it delivers in practice. As US tech earnings cycles, tariff policy shifts, and AI valuations continue to drive the fund’s short-term movements, the investors best positioned to hold it are those who bought it with those dynamics already priced into their expectations.
The April 2026 rebound offered a timely reminder. For some investors, it confirmed VGS’s role in their portfolio. For others, it may have revealed a concentration they had not fully considered. Both responses are reasonable. Only one is informed.
This article is for informational purposes only and should not be considered financial advice. Investors should conduct their own research and consult with financial professionals before making investment decisions. Past performance does not guarantee future results.
VGS is the Vanguard MSCI Index International Shares ETF listed on the ASX, which tracks the MSCI World ex-Australia Index across more than 3,500 securities in 20-plus developed economies. Despite its broad label, over 72% of the portfolio is concentrated in US-listed stocks, with the top four holdings including Nvidia, Apple, Microsoft, and Amazon approaching 16% of the fund.
VGS gained 5.3% in April 2026, rising from $141.15 to $148.63 per unit, driven by strong US Big Tech earnings and a drop in the VIX to 16.93. However, this followed a 4.38% decline in March 2026, meaning investors who held through both months experienced a partial recovery rather than a clean gain.
VGS delivered annualised total returns of 16.08% over 3 years, 12.76% over 5 years, and 13.26% over 10 years to 31 March 2026. These are unhedged returns, meaning AUD/USD currency movements have contributed to, and at times reduced, the figures Australian investors actually received.
VGS and VGAD both track the MSCI World ex-Australia Index, but VGS is fully unhedged while VGAD uses currency hedging to neutralise AUD/USD fluctuations. Investors who want to isolate equity market returns from currency movement may prefer VGAD, though hedging typically carries a cost reflected in slightly different returns over time.
VGS provides exposure to 20-plus developed economies, but its practical composition is heavily skewed toward US large-cap technology, with more than 72% in US equities and nearly 16% in just four mega-cap tech stocks. Investors should treat VGS as behaving more like a US technology allocation than a geographically balanced international portfolio.