
Eli Lilly at 40x Earnings: Expensive Stock, Underpenetrated Market
1 hr ago

Wall Street’s most closely watched contrarian sentiment gauge held flat for a second consecutive month in April, sitting 1.9 percentage points from triggering a sell signal and implying a 13% S&P 500 return over the next 12 months. The number, on its own, reads as a green light. The market that produced it tells a more complicated story: the S&P 500 closed 30 April 2026 at 7,209.01 after gaining more than 10% in a single month, yet only 23% of its constituents outperformed the index, one of the narrowest participation rates in nearly a century of recorded data. Bank of America strategists Victoria Roloff and Savita Subramanian published the April Sell Side Indicator reading the same day, and the juxtaposition of a still-neutral sentiment gauge against a historically concentrated rally makes this reading unusually instructive. What follows covers what the SSI is, what 55.6% actually signals, why the breadth data complicates the bullish headline, and what BofA is telling investors to do with the information right now.
The SSI tracks the average recommended equity weighting by Wall Street strategists in balanced fund portfolios, a dataset BofA has maintained since 1987. It works as a contrarian indicator. When strategists collectively recommend low equity allocations, their bearish consensus is treated as a buy signal. When they recommend high allocations, the bullish consensus becomes a warning.
The thresholds are derived from the historical distribution of readings going back nearly four decades. A reading below 51.2% (approximately one standard deviation below the long-run average) triggers a buy signal. A reading above 57.5% (approximately one standard deviation above) triggers a sell signal. Everything in between is neutral.
BofA’s Sell Side Indicator methodology is grounded in four decades of strategist allocation data, with the buy and sell thresholds derived from the historical distribution of readings rather than arbitrary fixed points, giving the signal zones their statistical legitimacy.
The signal zones and their historical return implications break down as follows:
When the SSI has flashed a buy signal, the S&P 500 has averaged roughly 15% over the following 12 months. When it has flashed a sell signal, that average has dropped to approximately 2%. The gap between the two outcomes is what gives the indicator its contrarian weight.
The indicator is most powerful at extremes. Understanding where those extremes sit is what turns the current 55.6% reading from an isolated data point into a positioning signal.
The April 2026 SSI came in at 55.6%, unchanged from March and 30 basis points higher than where it started the year. Twelve months ago, following the Liberation Day sell-off, the reading had dipped to approximately 54.5% before recovering. The slow, steady drift upward over the past two years is the trend that matters.
Two distances define the current reading’s significance. The SSI sits 1.9 percentage points below the 57.5% sell signal threshold and 4.4 percentage points above the 51.2% buy signal threshold. The asymmetry is clear: the indicator is more than twice as close to a warning as it is to an all-clear.
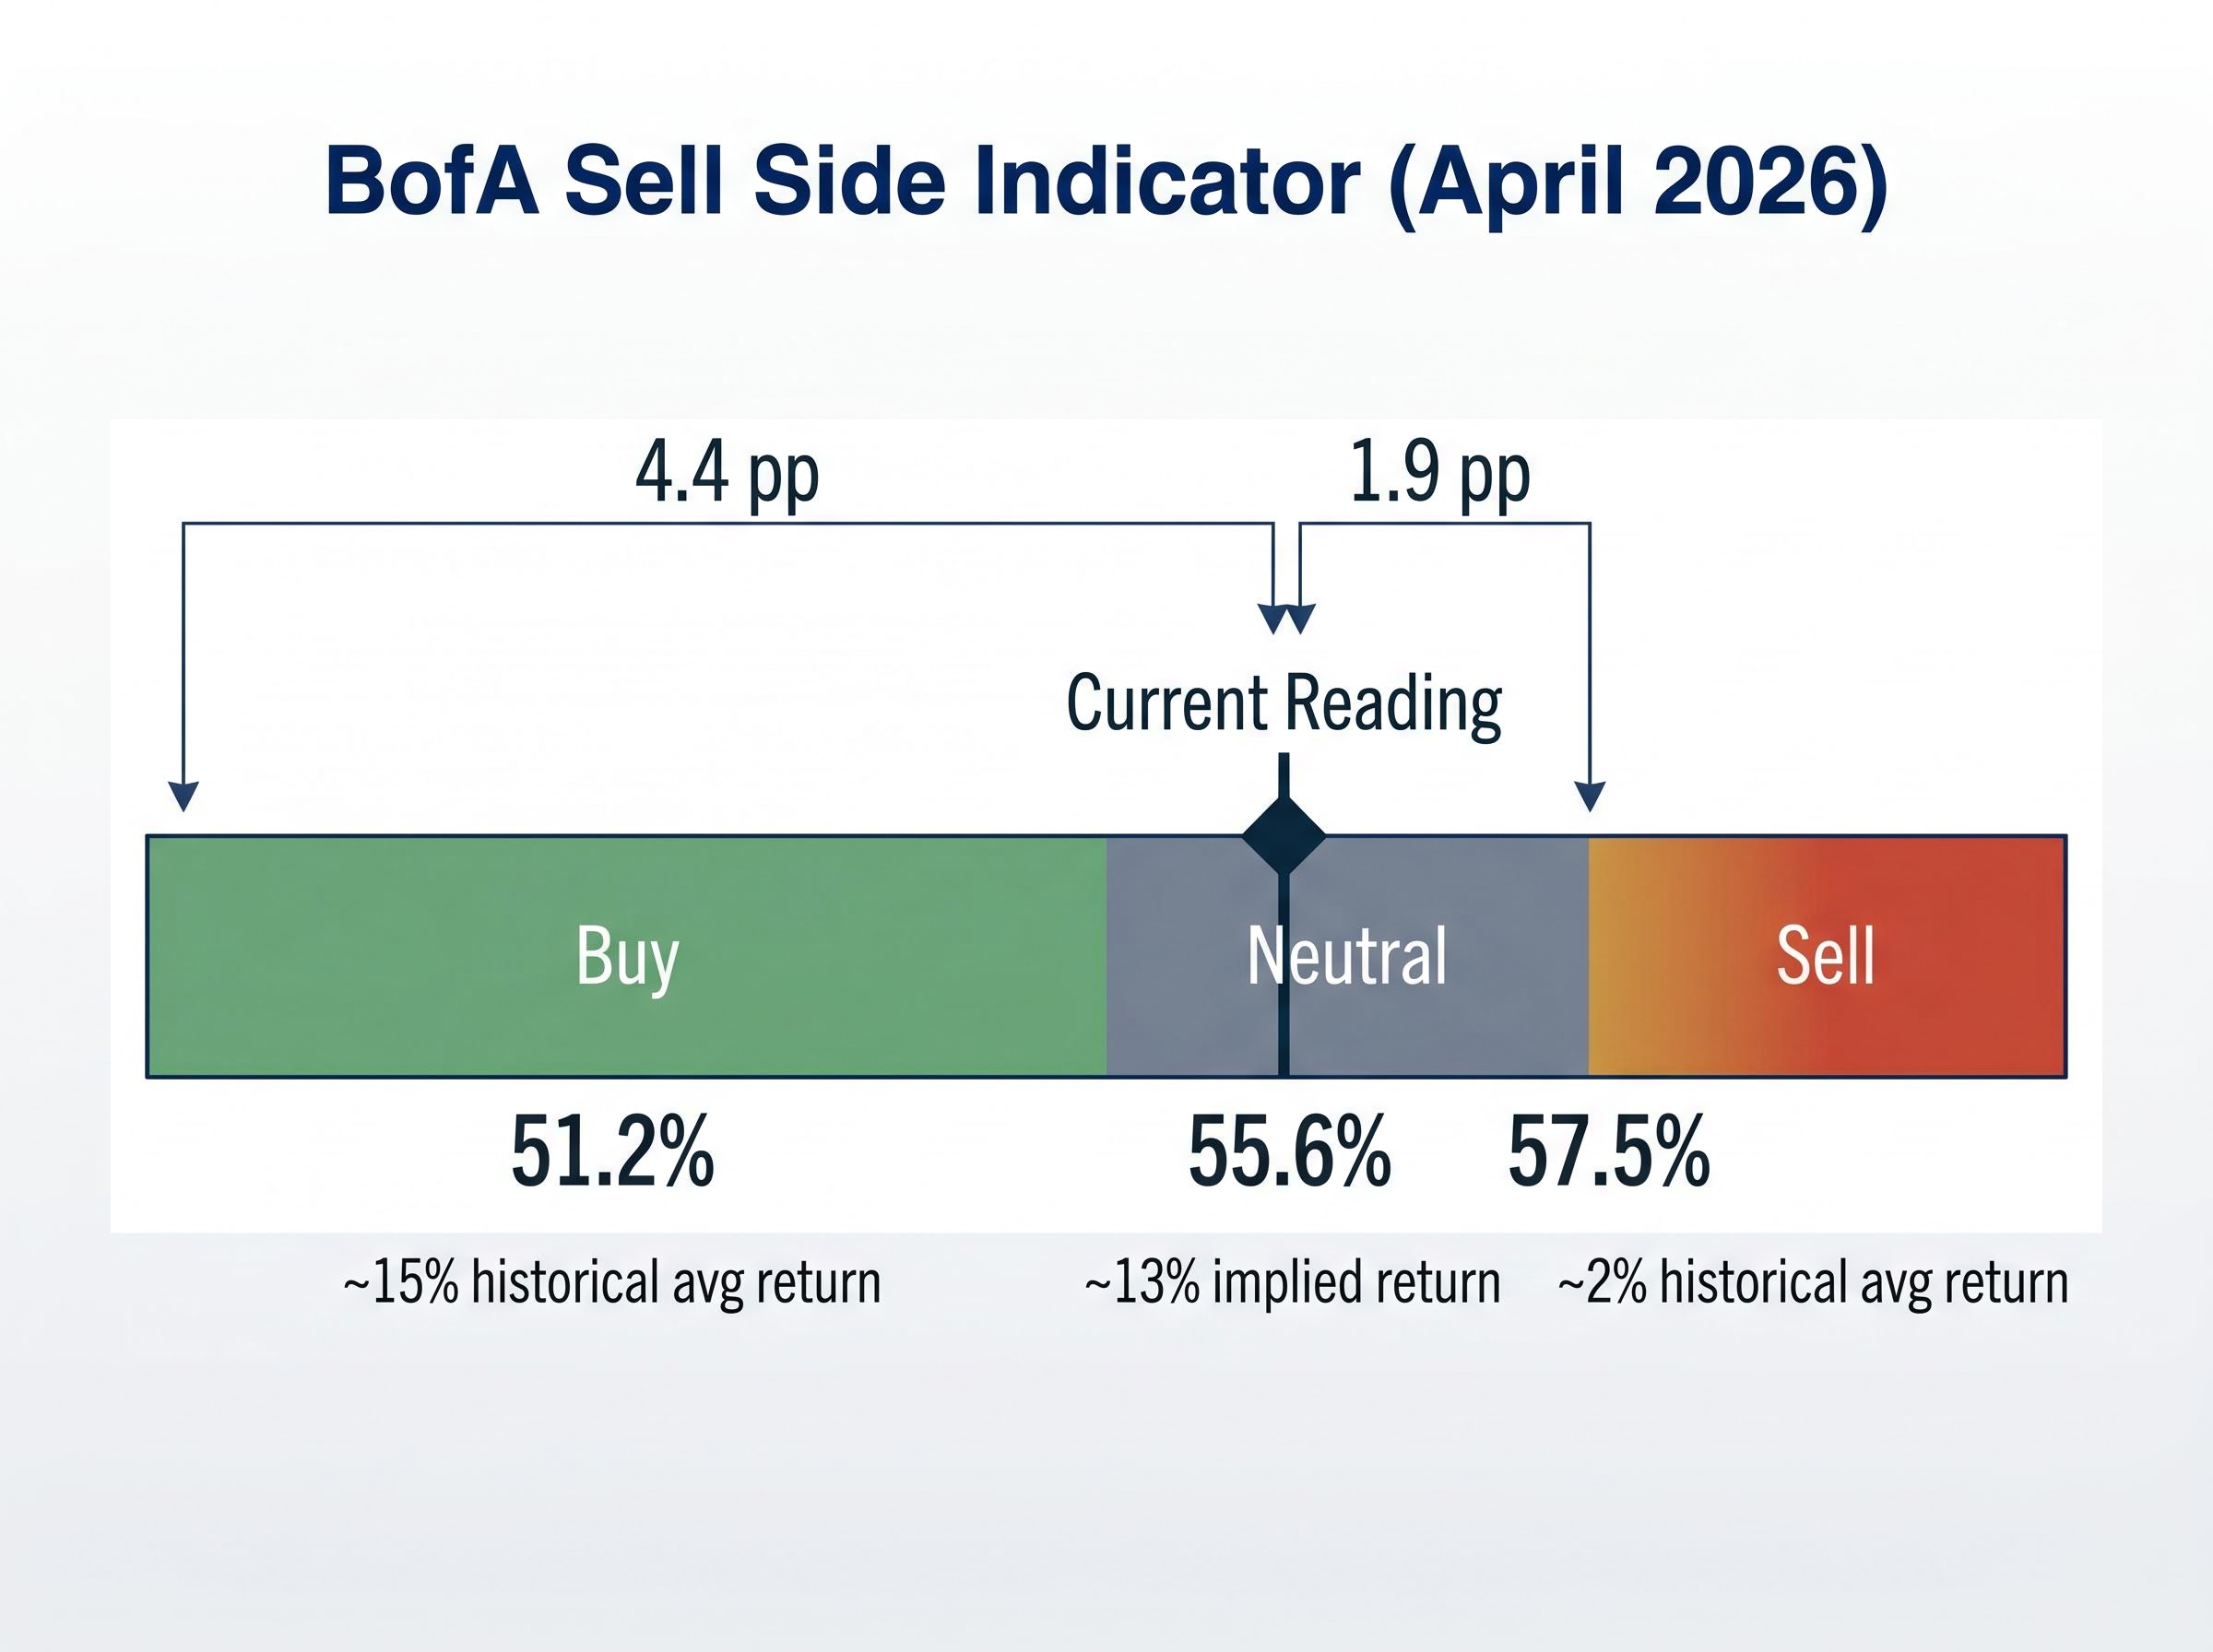
For context, prior market peaks have historically coincided with SSI readings exceeding 59%, well above the current level. BofA’s April 30 note described the 13% implied 12-month return as the “most bullish” of the five inputs in its S&P 500 target calculation.
| SSI Reading | Signal Zone | Distance to Sell (57.5%) | Distance to Buy (51.2%) | Implied 12-Month Return |
|---|---|---|---|---|
| 55.6% (April 2026) | Neutral | 1.9 pp | 4.4 pp | ~13% |
| 51.2% (Buy threshold) | Buy | 6.3 pp | 0 pp | ~15% (historical avg) |
| 57.5% (Sell threshold) | Sell | 0 pp | 6.3 pp | ~2% (historical avg) |
BofA described the 13% implied return as the “most bullish” of the five inputs in its S&P 500 target calculation.
The 1.9-point gap to a sell signal warrants attention. The SSI has been drifting gradually upward for approximately two years; what matters now is how much room remains before the contrarian green light turns amber.
The April rally was exceptional by any historical standard. The S&P 500’s monthly gain of more than 10% placed the return at the 98th percentile of all monthly performances since 1928. Optimism around a potential ceasefire and a strong first-quarter earnings season, in which 84% of reporting companies beat estimates, powered the move.
The S&P 500’s April 30 close above 7,200 was driven in large part by Alphabet’s 81% year-over-year jump in Q1 net income and Apple’s record EPS print, a narrow group of earnings catalysts that helps explain why index-level strength and constituent-level participation diverged so sharply in the same session.
Then the participation data arrived. Only 23% of S&P 500 constituents outperformed the index in April, the fourth-lowest monthly breadth reading in BofA’s dataset since 1986. The equally weighted index trailed the cap-weighted benchmark by 5 percentage points. A double-digit monthly return carried by fewer than one in four stocks is not a broad-based advance; it is a concentrated bet on a narrow slice of the market.
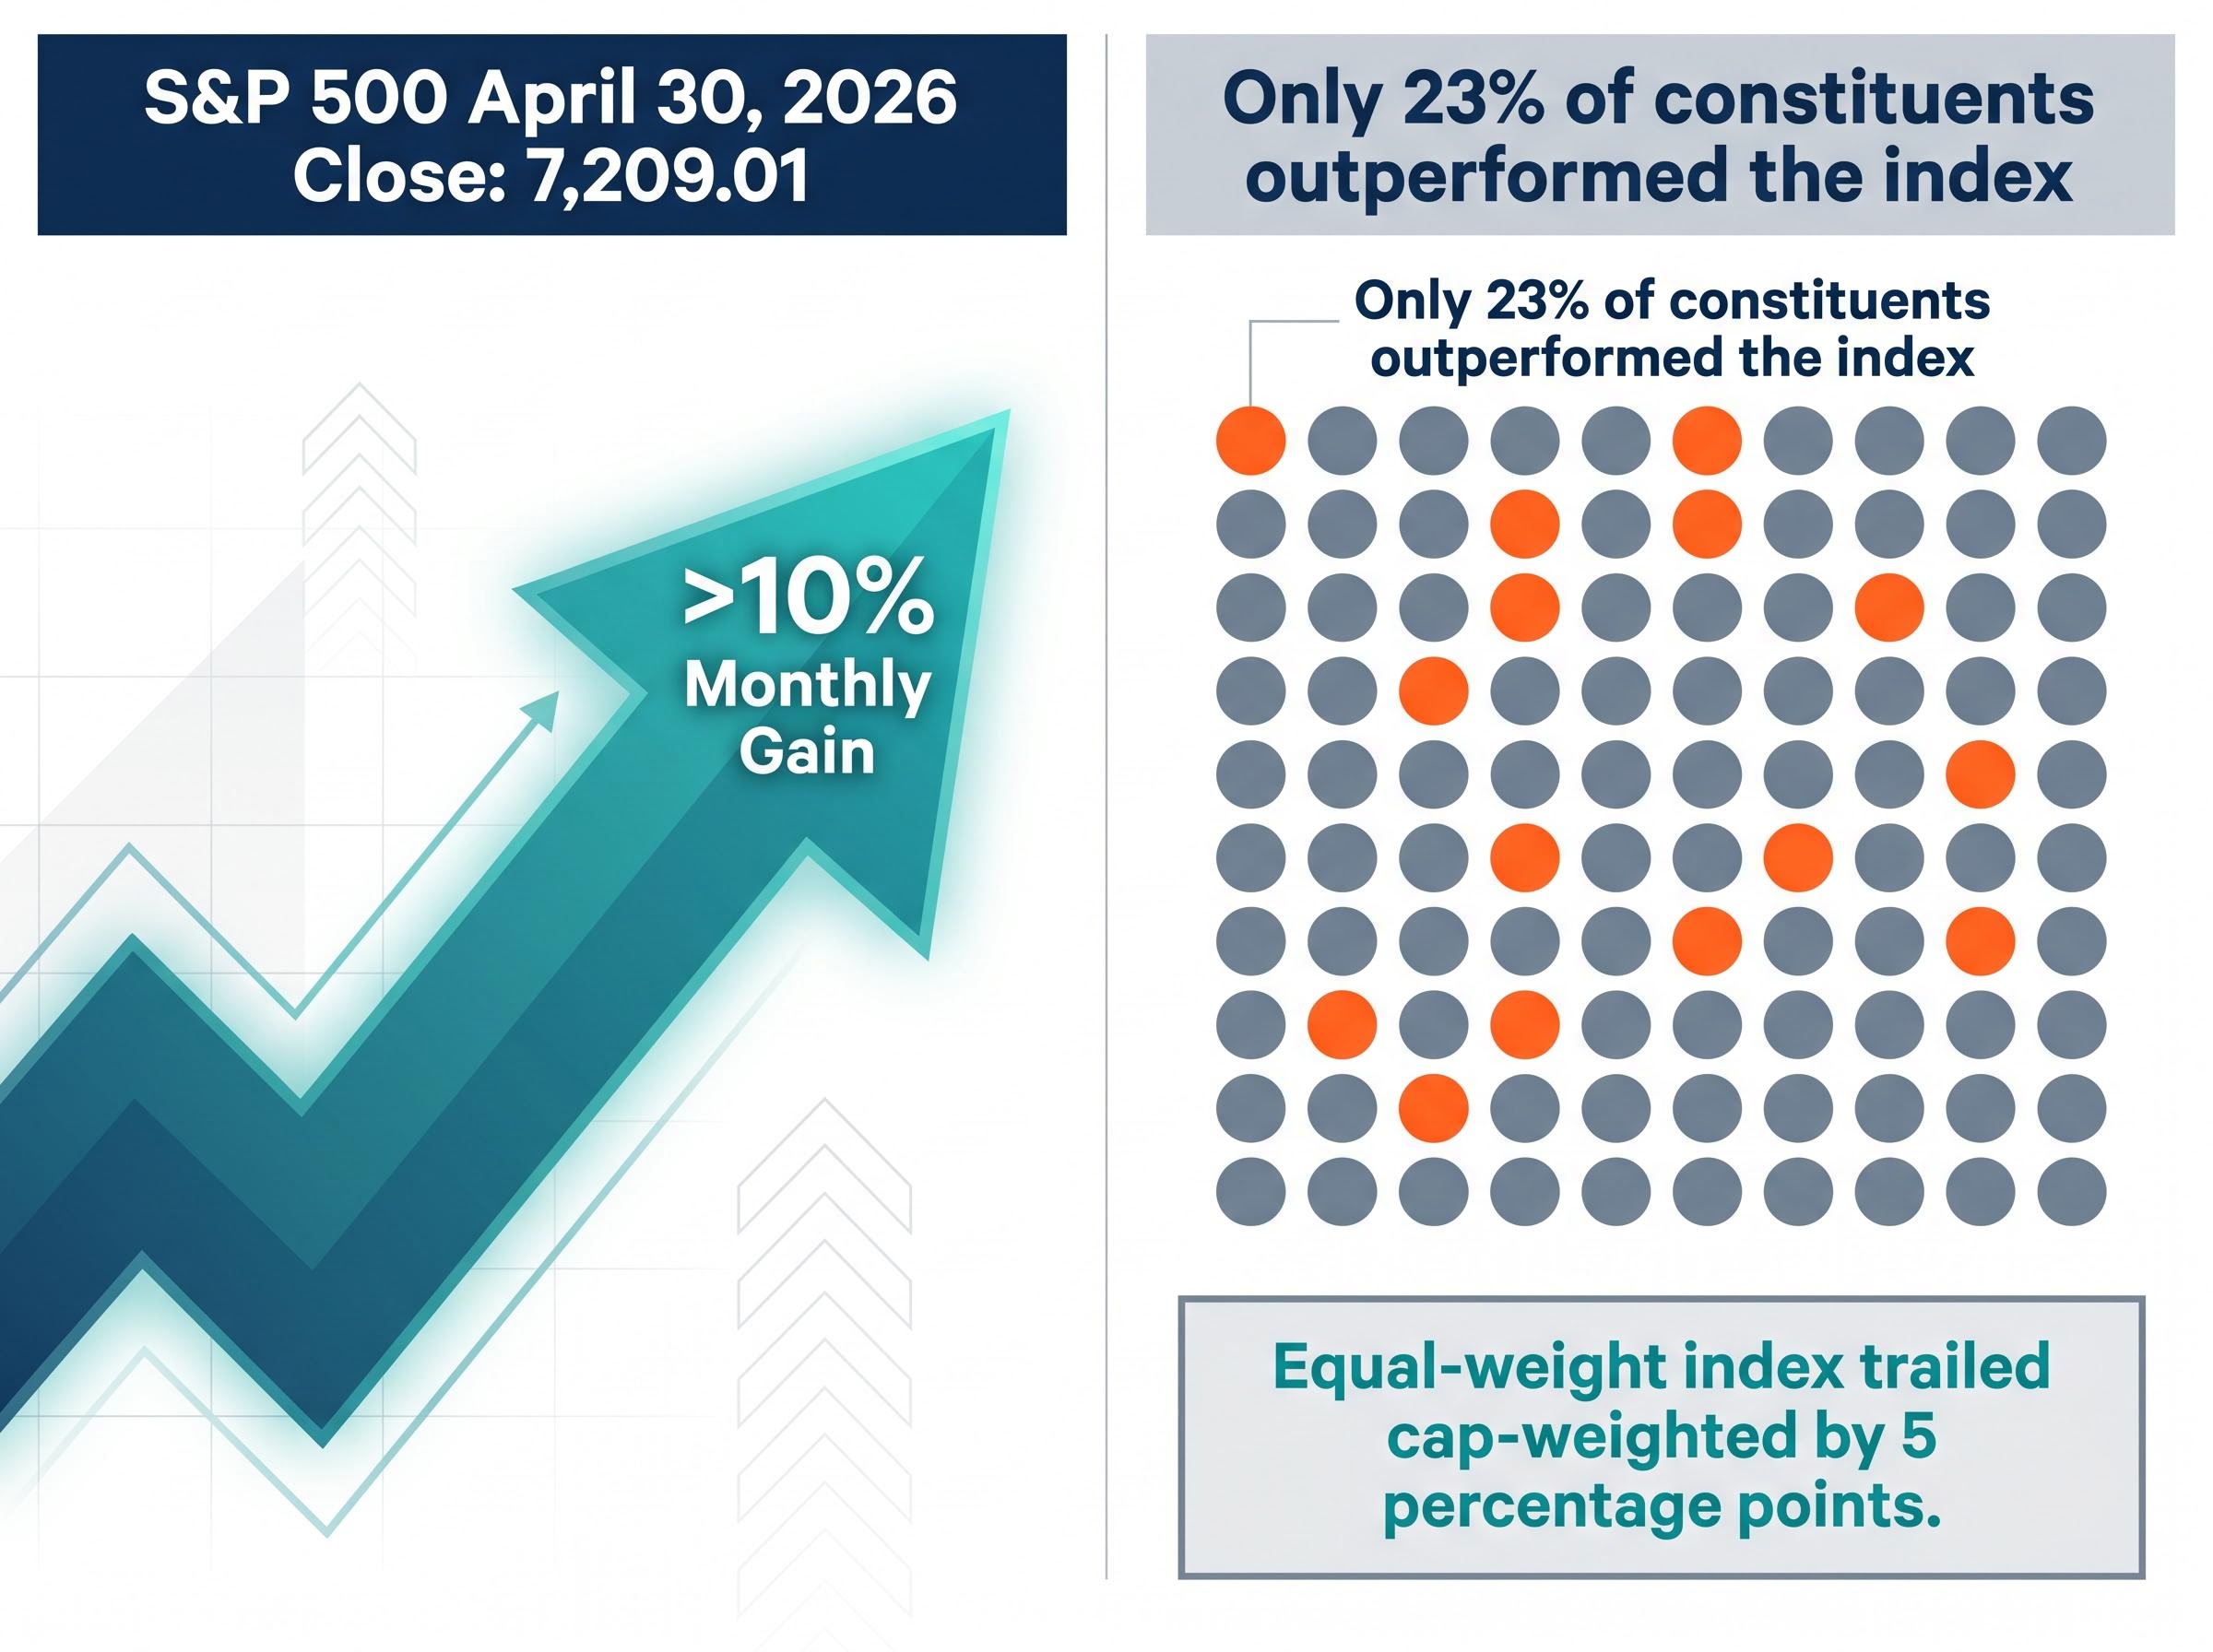
BofA’s Subramanian flagged a 5-8% correction risk if participation remains below 30% heading into May. The breadth data is the single most important caveat to the SSI’s bullish-neutral reading: a 13% forward return projection built on a historically narrow foundation carries higher concentration risk than the headline number implies.
Goldman Sachs’s equity team argued that the current concentration is a structural feature of an AI-driven market cycle, not a signal of fragility. In this framing, breadth will widen naturally as the Federal Reserve begins easing policy. Goldman’s year-end S&P 500 target of 6,200 (set before the April surge) reflects a more moderate view of the index’s trajectory, but the team maintained that rotation into broader sectors would sustain the rally’s foundation.
Evercore ISI’s Julian Emanuel took a similar line, characterising April’s narrow breadth as a “healthy shakeout precursor,” a temporary concentration that clears the way for broader participation rather than marking a top.
Three risk categories sit between the SSI’s implied 13% return and its realisation, each operating on a different time horizon:
The year-end target overshoot adds a structural dimension to the trade policy and Fed risks: when the S&P 500 fulfils its full-year price target in April, the path of least resistance for Wall Street strategists is to raise allocations, and each incremental raise nudges the SSI closer to its 57.5% sell signal threshold.
BofA characterised these factors as “monitorable risks” rather than base-case derailers of the 13% return projection.
Each risk operates on a distinct transmission mechanism. Treating them as a single undifferentiated headwind misreads the probability-weighted path to the SSI’s implied return.
The SSI does not exist in isolation. Three independent sentiment frameworks, measured across institutional, retail, and cross-asset dimensions, offer corroboration and one notable divergence.
| Indicator | Current Reading | Zone | SSI Alignment | Key Takeaway |
|---|---|---|---|---|
| BofA SSI | 55.6% | Neutral | Baseline | ~13% implied 12-month return |
| CNN Fear & Greed Index | 68 | Greed | Corroborates | Elevated risk appetite, not extreme |
| AAII Sentiment Survey | Bulls: 38.1%; Bears: 39.7% | Cautious | Slight divergence | Retail caution reinforces contrarian bull case |
| Goldman Sachs Sentiment Gauge | 56.2 | Neutral | Directly corroborates | Goldman notes “room to run” |
The CNN Fear and Greed Index at 68 (Greed) corroborates the neutral-to-bullish SSI read without reaching extreme territory. Goldman’s sentiment gauge at 56.2 is the most direct institutional match for the SSI’s flatness.
The AAII data is the outlier worth noting: bears slightly outnumber bulls at 39.7% versus 38.1%. In the contrarian framework underpinning the SSI, retail caution has historically acted as a tailwind rather than a headwind. BofA’s buyside equity allocation rose to approximately 62% in April, up from 60% in March, consistent with gradual positioning increases rather than aggressive risk-taking.
The retail sentiment divergence captured in the AAII data reflects a broader pattern visible across April 2026: institutional strategists were flagging correction risk while individual investors maintained bullish expectations of 46.0%, a gap that contrarian frameworks like the SSI are specifically designed to weight against the consensus rather than with it.
Michael Hartnett, Chief Investment Strategist at Bank of America, agreed with the 13% upside framing but flagged euphoria risk if the SSI approaches the 57.5% sell signal threshold, noting that “positioning is not stretched yet.”
BofA’s April 30 note translated the neutral SSI into a specific portfolio construction argument: selective individual stock exposure rather than broad index-level buying at current elevated levels. The reasoning centres on worsening equity supply and demand dynamics that BofA flagged as a structural headwind to broad index valuations.
The SSI’s position reinforces this framing. At 55.6%, meaningful buffer remains before a sell signal, but the easiest contrarian gains (buy-signal territory near 51.2%) are well behind this cycle. BofA characterised the 13% implied return as “healthy” but pointed investors toward stock selection as the primary opportunity.
Morgan Stanley’s Mike Wilson offered the most direct counterposition, calling for a 5-7% pullback if market breadth fails to widen beyond the current 23% participation rate. A JPMorgan desk note argued that rotation into value and small caps is required to sustain the rally at index level.
The SSI would approach its 57.5% sell signal threshold if Wall Street strategists collectively raise recommended equity allocations by another 1.9 percentage points, a shift that could materialise within two to three quarters at the current pace of drift. Historically, readings above that threshold have preceded average 12-month returns of just 2%.
At 55.6%, the Sell Side Indicator sits in a zone that has historically preceded approximately 13% forward returns. The signal is not flashing alarm, and the distance from a sell signal provides a buffer. The path to that return, however, is narrower than the headline suggests: a 23% breadth reading, geopolitical and trade policy risks, and a Federal Reserve holding rates steady all constrain the route.
The indicator’s value is precisely that it does not rely on market momentum or consensus narrative. The current neutral read reflects a Wall Street that is neither capitulating nor euphoric. What would change the picture: an SSI drift toward or above 57.5%, a sustained failure of breadth below 30%, or a material shock from any of the identified macro risk categories.
The converging warning signals that accompany the current SSI reading extend well beyond the breadth data: gasoline at $4.25 per gallon has historically preceded average S&P 500 declines of 11% over the following six months, and Goldman Sachs and JPMorgan both assign 30-35% recession probability over the next 12 months, a combination that sharpens the significance of a sell signal threshold sitting just 1.9 percentage points away.
This article is for informational purposes only and should not be considered financial advice. Investors should conduct their own research and consult with financial professionals before making investment decisions. Past performance does not guarantee future results. Financial projections are subject to market conditions and various risk factors.
The Bank of America Sell Side Indicator (SSI) tracks the average recommended equity weighting by Wall Street strategists in balanced fund portfolios, a dataset BofA has maintained since 1987. It functions as a contrarian gauge: low strategist allocations signal a buying opportunity, while high allocations signal caution.
A reading of 55.6% places the SSI in neutral territory, implying an approximate 13% S&P 500 return over the next 12 months based on historical patterns. However, the indicator sits just 1.9 percentage points below the 57.5% sell signal threshold, meaning the buffer before a warning is relatively thin.
The SSI triggers a sell signal when it rises above 57.5%, approximately one standard deviation above its long-run average, a level that has historically preceded average 12-month S&P 500 returns of just 2%. At the current pace of drift, BofA strategists suggest this threshold could be reached within two to three quarters.
Although the S&P 500 gained more than 10% in April 2026, only 23% of its constituents outperformed the index, the fourth-lowest monthly breadth reading since 1986. BofA's Savita Subramanian flagged a 5-8% correction risk if participation remains below 30% heading into May.
BofA recommends selective individual stock exposure rather than broad index-level buying at record levels, citing deteriorating equity supply and demand dynamics. The firm characterises the 13% implied return as healthy but argues stock selection is the primary opportunity at current valuations.