BofA Forecasts $2.7 Trillion Semiconductor Market by 2030
17 mins ago

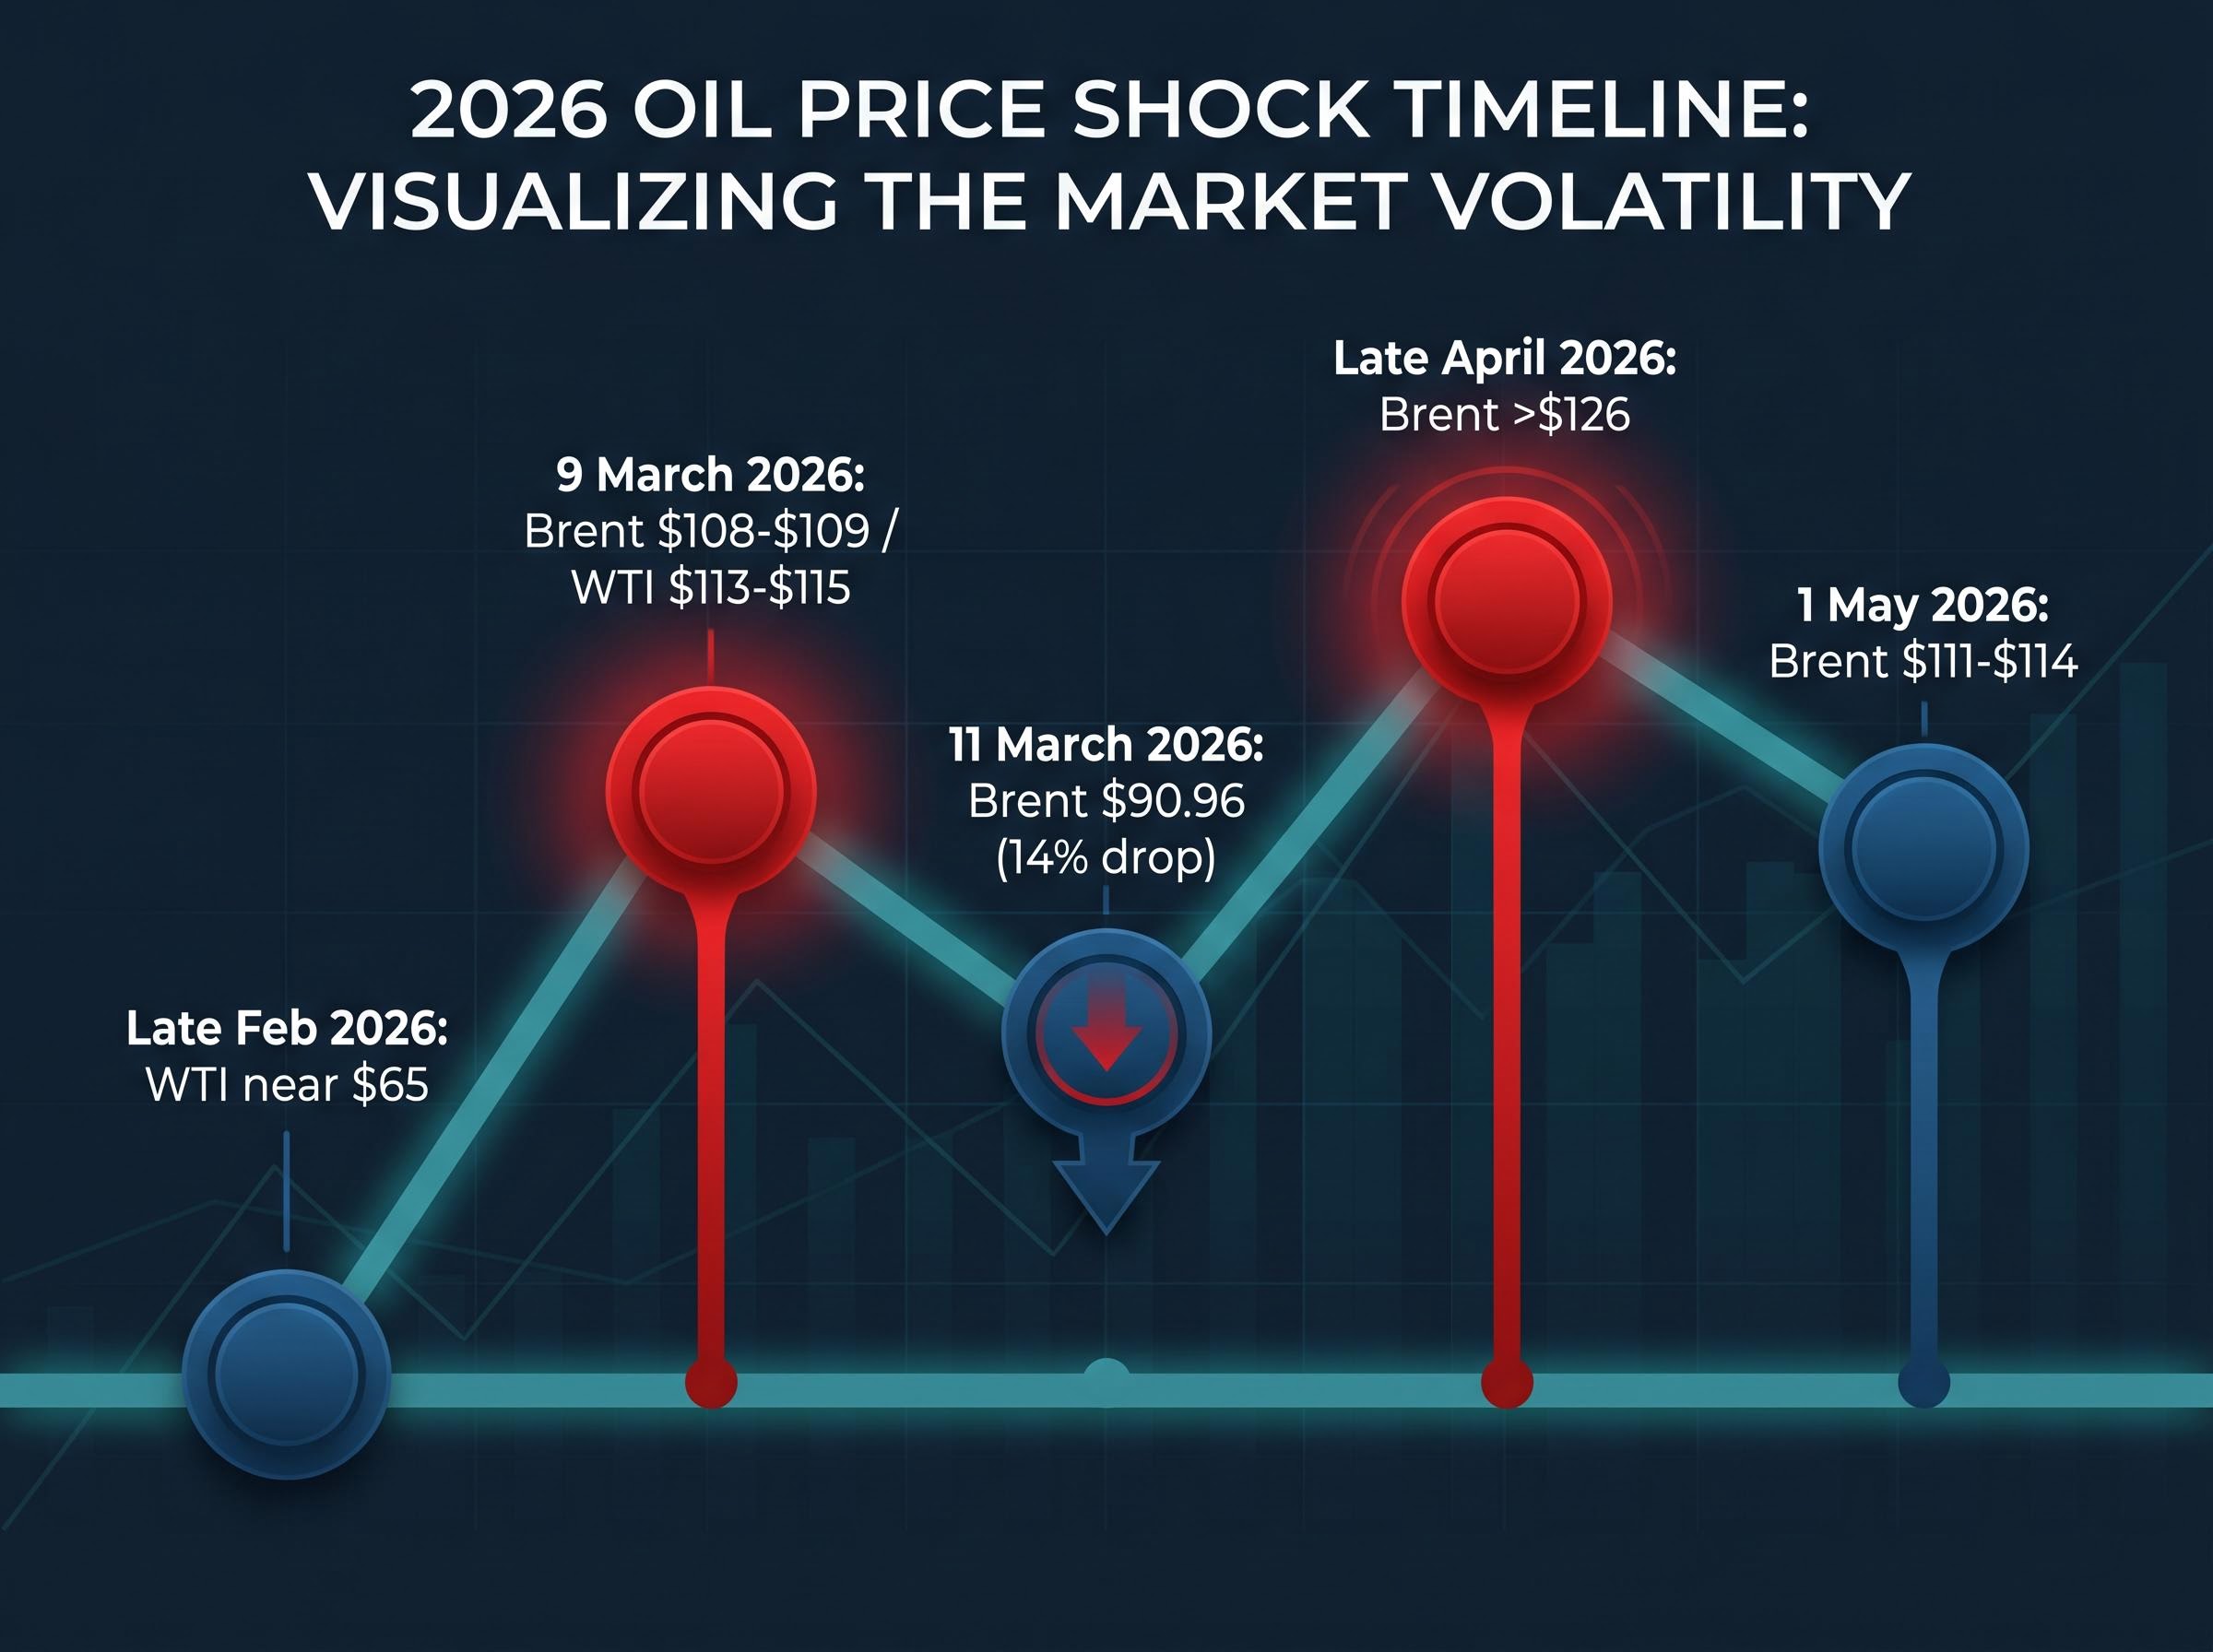
Brent crude has more than doubled since late February 2026, touching $126 per barrel in late April, and two of the three major U.S. equity indexes have entered correction territory. The last three times oil crossed $100 a barrel, equity investors faced years of below-average returns. The U.S.-Israel strikes on 28 February 2026 that killed Iran’s Supreme Leader set off retaliatory missile strikes, a near-total shutdown of the Strait of Hormuz, and a cascade of market dislocations that remain unresolved as of 1 May 2026. With Hormuz traffic at roughly 5% of normal and approximately 2,000 ships stranded, the supply shock shows no sign of swift resolution. What follows maps the oil and equity market impact since 28 February, what the three previous $100-plus oil episodes reveal about the 12 months that follow, and what that historical pattern means for a U.S. retail investor’s portfolio today.
The Strait of Hormuz is a narrow waterway between Iran and Oman through which, according to the International Energy Agency, roughly one-third of all globally traded oil passed in 2025. Six major petroleum exporters depend on it: Iran, Iraq, Kuwait, Saudi Arabia, the UAE, and Qatar. Five of the twelve OPEC member nations were directly affected by the military hostilities that followed the 28 February strikes.
When commercial shipping through the strait came to a near-standstill, the bottleneck was not abstract. Gulf storage facilities were at near capacity by early March 2026, and the physical infrastructure to reroute that volume of crude simply does not exist on a short timeline.
Goldman Sachs has projected a global supply deficit of 9.6 million barrels per day under the current Hormuz disruption, a figure that helps explain why the price recovery from the March 11 flash drop was so swift; physical scarcity, not speculative positioning, is the primary driver of where Brent has traded since late February.
Saudi Aramco warned publicly that an extended Hormuz closure would have “catastrophic” consequences for global energy supply.
The speed of the oil price move matched the severity of the disruption. The following timeline captures the key levels:
That 14% single-day drop on 11 March, triggered by a report that was never confirmed, reveals just how brittle supply confidence remains. The market is pricing not just the physical disruption but the uncertainty around every headline that follows.
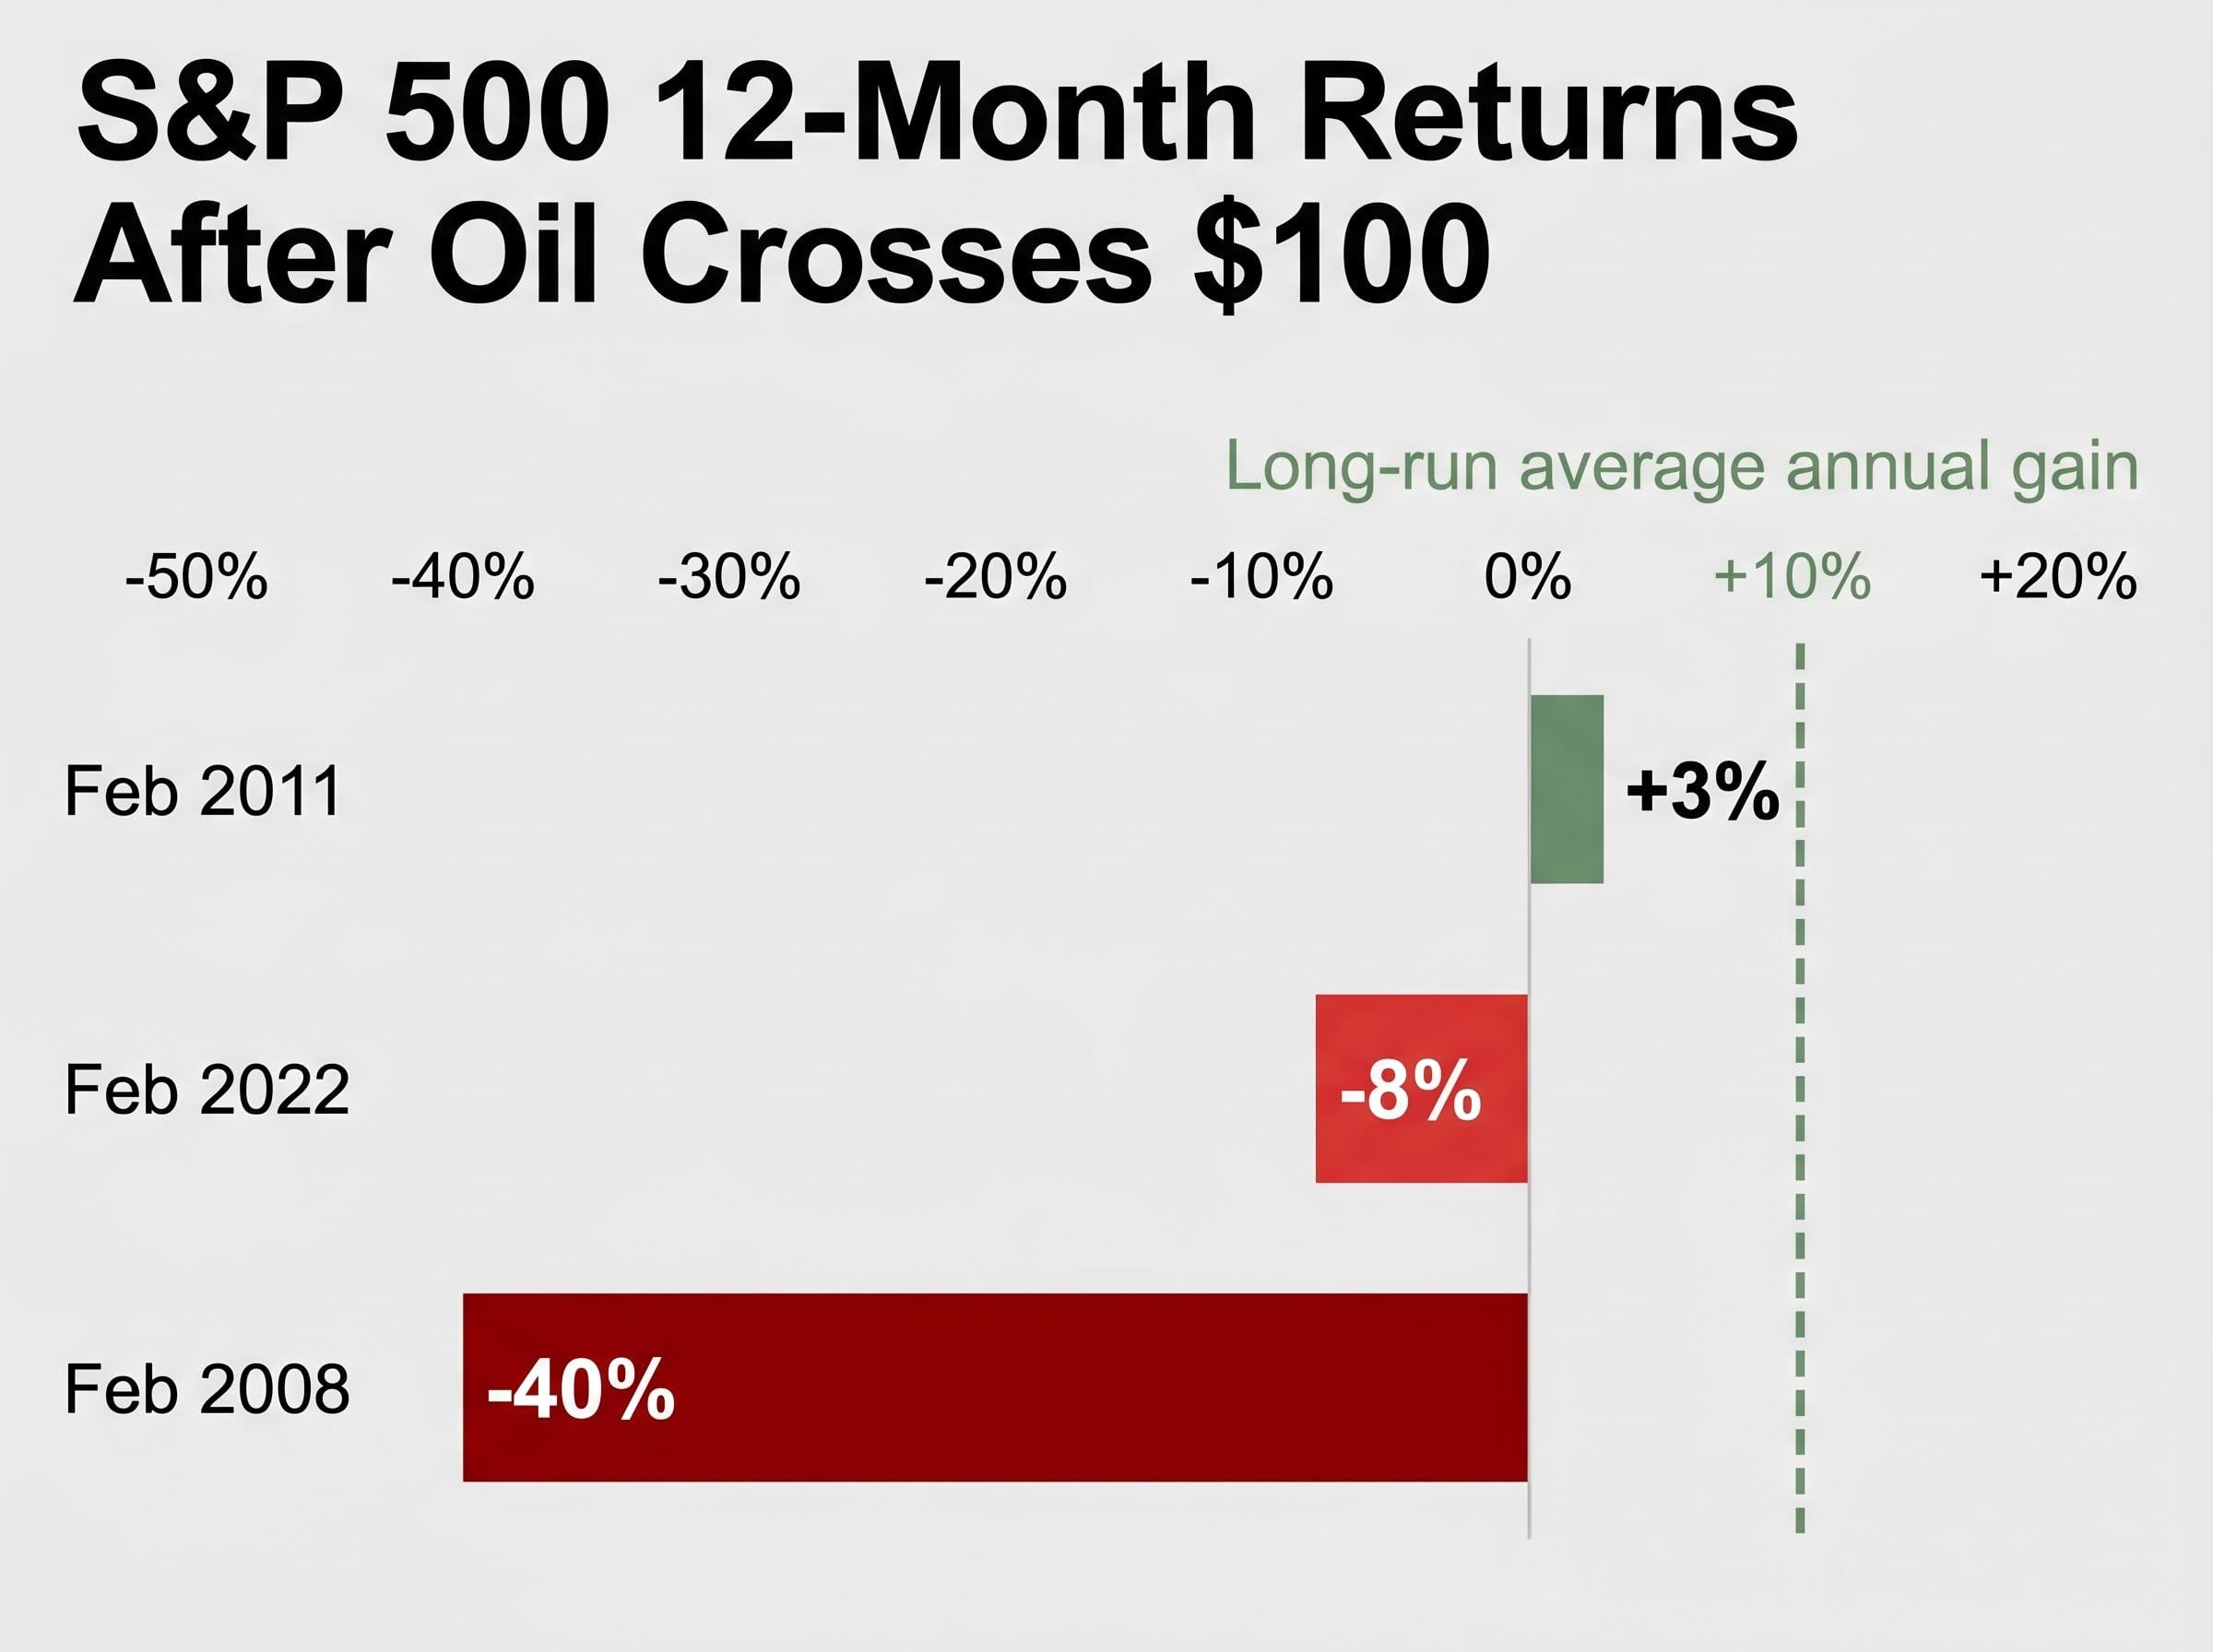
Oil has crossed $100 per barrel three times before the current episode. Each time, the S&P 500 delivered below-average returns over the subsequent 12 months, measured against the index’s long-run average annual gain of approximately 10%. The specific outcomes, however, varied considerably.
| Episode | Oil Trigger | Concurrent Factors | S&P 500 Return (12 months) |
|---|---|---|---|
| February 2008 | Oil crossed $100 amid surging global demand | Global financial crisis, banking sector collapse | Fell more than 40% |
| February 2011 | Oil crossed $100 during Arab Spring supply disruptions | North African political instability; limited U.S. financial contagion | Approximately +3% |
| February 2022 | Oil crossed $100 following Russia-Ukraine supply shock | Elevated inflation, rising interest rates | Approximately -8% |
The common thread is consistent underperformance relative to the 10% long-run average. In the best of the three cases (2011), equities returned less than a third of that average. In the worst (2008), the market suffered its deepest drawdown in a generation.
The 2008 episode is partially confounded by the global financial crisis, which drove the bulk of the 40% decline regardless of oil prices. The 2011 and 2022 cases are cleaner analogues to the current situation, where the oil shock itself, rather than a separate systemic crisis, was the primary variable compressing returns.
Three data points are not a statistical law. But the consistency of below-average equity returns across three geopolitically distinct episodes is a credible signal that sustained elevated oil prices compress equity performance, irrespective of the specific trigger. The pattern warrants serious attention without overstating its predictive precision.
The 30-year gasoline price history adds a granular retail-level dimension to the same pattern: the S&P 500 has fallen an average of 11% in the six months following weeks when U.S. national average gasoline exceeded $4.00 per gallon, with sustained episodes historically associated with peak-to-trough bear market declines averaging 41%, and the current episode places the historical risk window through approximately October-November 2026.
An oil price spike is not simply a fuel cost increase. It operates as a pressure point that touches corporate margins, consumer spending, and central bank policy simultaneously. Understanding this transmission chain clarifies why a disruption in a strait thousands of kilometres from Wall Street can move the S&P 500.
Three channels carry the shock from the oil market into equities:
Reuters reporting on Fed rate policy in May 2026 captured dissenting voices within the Federal Reserve calling for the central bank to drop its rate-cut bias entirely, with at least one regional Fed president raising the prospect of rate hikes if the oil shock persists and inflation expectations become unanchored.
JPMorgan has flagged the risk of an inflation revival if Brent remains sustained above $100 per barrel, noting that the combination of supply disruption and elevated energy costs creates a challenging environment for both consumers and the Federal Reserve’s policy stance.
With Brent at approximately $111-114 on 1 May 2026, all three channels are active. The question for equity markets is not whether these pressures exist but how long they persist.
The correction data across the three major U.S. indexes tells a story of broad-based but uneven pain.
| Index | Peak-to-Trough Decline | Correction Status |
|---|---|---|
| Dow Jones Industrial Average | Just over 10% (10 February peak to 27 March low) | Yes |
| Nasdaq 100 | Nearly 12% (28 January high to 30 March trough) | Yes |
| S&P 500 | Slightly above 9% (2 February peak to 30 March low) | No (narrowly avoided the 10% threshold) |
The gap between the Nasdaq’s near-12% drop and the S&P 500’s sub-10% decline illustrates how different index compositions absorb oil shocks. Technology-heavy indexes carry companies with higher growth valuations, which are more sensitive to rising discount rates and inflation expectations. Energy-weighted indexes benefit from the same price surge that damages the broader market.
By early April, a partial recovery took hold. The Dow gained more than 3%, the S&P 500 climbed nearly 4%, and the Nasdaq advanced nearly 5%. The catalyst was a series of ceasefire reports, including a claim posted online by the U.S. president. Iranian state media and Al Jazeera directly contradicted the claim. The rebound held anyway, at least temporarily.
Morgan Stanley has characterised the equity shock as temporary, pointing to historical S&P 500 rebound patterns following oil supply disruptions. Post-1990 data shows the index has averaged approximately 12% gains in the first year following major supply shocks.
That the market rallied on an unverified political statement, and held the rally even after the statement was contradicted, reveals how much of the current price action is driven by geopolitical signal rather than fundamental reassessment.
The April recovery that followed an unverified presidential social media post about a ceasefire is a textbook case of geopolitical risk mispricing, where markets price in the most optimistic interpretation of ambiguous signals rather than the probability-weighted range of outcomes, a dynamic that has historically produced sharp reversals when the optimistic scenario fails to materialise.
The institutional consensus is remarkably uniform: stay the course.
Morgan Stanley, JPMorgan, and the broader analyst community have converged on a set of recommendations that prioritise discipline over reaction. The reasoning is straightforward. Markets driven by geopolitical headlines are volatile, and the headlines themselves are unreliable. Trading around them has a well-documented cost.
A 2022 study published in the Journal of Finance, examining Robinhood user trading behaviour between May 2018 and August 2020, found that the most frequently purchased equities on the platform produced an average 20-day return of negative 4.7%.
The Journal of Finance study found that the most popular Robinhood purchases delivered an average 20-day return of -4.7%, providing quantitative evidence that attention-driven, short-term trading systematically destroys value.
For a U.S. retail investor who has watched a 9-12% correction unfold since February, the research-backed case for patience is more actionable than any forecast about where oil prices move next. The recommended actions from institutional strategists include:
Morgan Stanley’s position is explicit: avoid rushed portfolio shifts and recognise that U.S. assets have demonstrated greater resilience than European or Asian equivalents in this environment.
The situation as of 1 May 2026 resists clean resolution. A conditional ceasefire has been extended, but the Strait of Hormuz remains effectively closed at 5% of normal traffic. Brent crude sits at approximately $111-114 per barrel, well above pre-conflict levels. No confirmed diplomatic breakthrough has materialised.
The historical record offers a counterweight to the uncertainty. After each of the three previous $100-plus oil episodes, equity markets eventually recovered. Post-1990 supply shocks have been followed by average S&P 500 gains of approximately 12% in the first year. Morgan Stanley’s assessment that U.S. assets remain more resilient than international equivalents in this environment aligns with that historical pattern.
The geopolitical signals driving this market are volatile. They arrive from social media posts, unverified military reports, and state media contradictions. The strongest edge available to a long-term U.S. investor is not better information about oil prices or ceasefire timelines. It is a commitment to a strategy that does not require either.
Investors who want to understand the specific price levels and catalysts that could force a rapid repricing will find our deep-dive into equity market correction risk, which examines how algorithmic trading models are currently treating the supply shock as a routine dip, the specific crude oil thresholds analysts identify as triggers for forced reassessment, and what a repricing scenario would likely look like across sectors.
This article is for informational purposes only and should not be considered financial advice. Investors should conduct their own research and consult with financial professionals before making investment decisions. Past performance does not guarantee future results. Financial projections are subject to market conditions and various risk factors.
Every time oil has crossed $100 per barrel, the S&P 500 has delivered below-average returns over the following 12 months, ranging from a 3% gain in 2011 to a 40% loss in 2008, compared to the index's long-run average annual return of approximately 10%.
The near-total closure of the Strait of Hormuz, which normally carries roughly one-third of all globally traded oil, created a supply deficit of approximately 9.6 million barrels per day according to Goldman Sachs, driving Brent crude above $126 per barrel and pushing two major U.S. equity indexes into correction territory.
Institutional strategists at Morgan Stanley and JPMorgan recommend maintaining existing positions and continuing regular contributions to passive index funds, noting that trading around volatile geopolitical headlines has a well-documented cost, with attention-driven retail trades producing an average 20-day return of negative 4.7% according to a 2022 Journal of Finance study.
Since late February 2026, the Dow Jones fell just over 10% and the Nasdaq 100 dropped nearly 12% from their respective peaks, while the S&P 500 declined slightly above 9%, narrowly avoiding the official 10% correction threshold.
Elevated oil prices compress corporate profit margins through higher input costs, reduce consumer discretionary spending by raising fuel costs at the pump, and risk forcing the Federal Reserve to maintain or raise interest rates to contain inflation, all of which weigh on equity valuations simultaneously.