
How to Prepare Your Portfolio for a Financial Crisis
48 mins ago

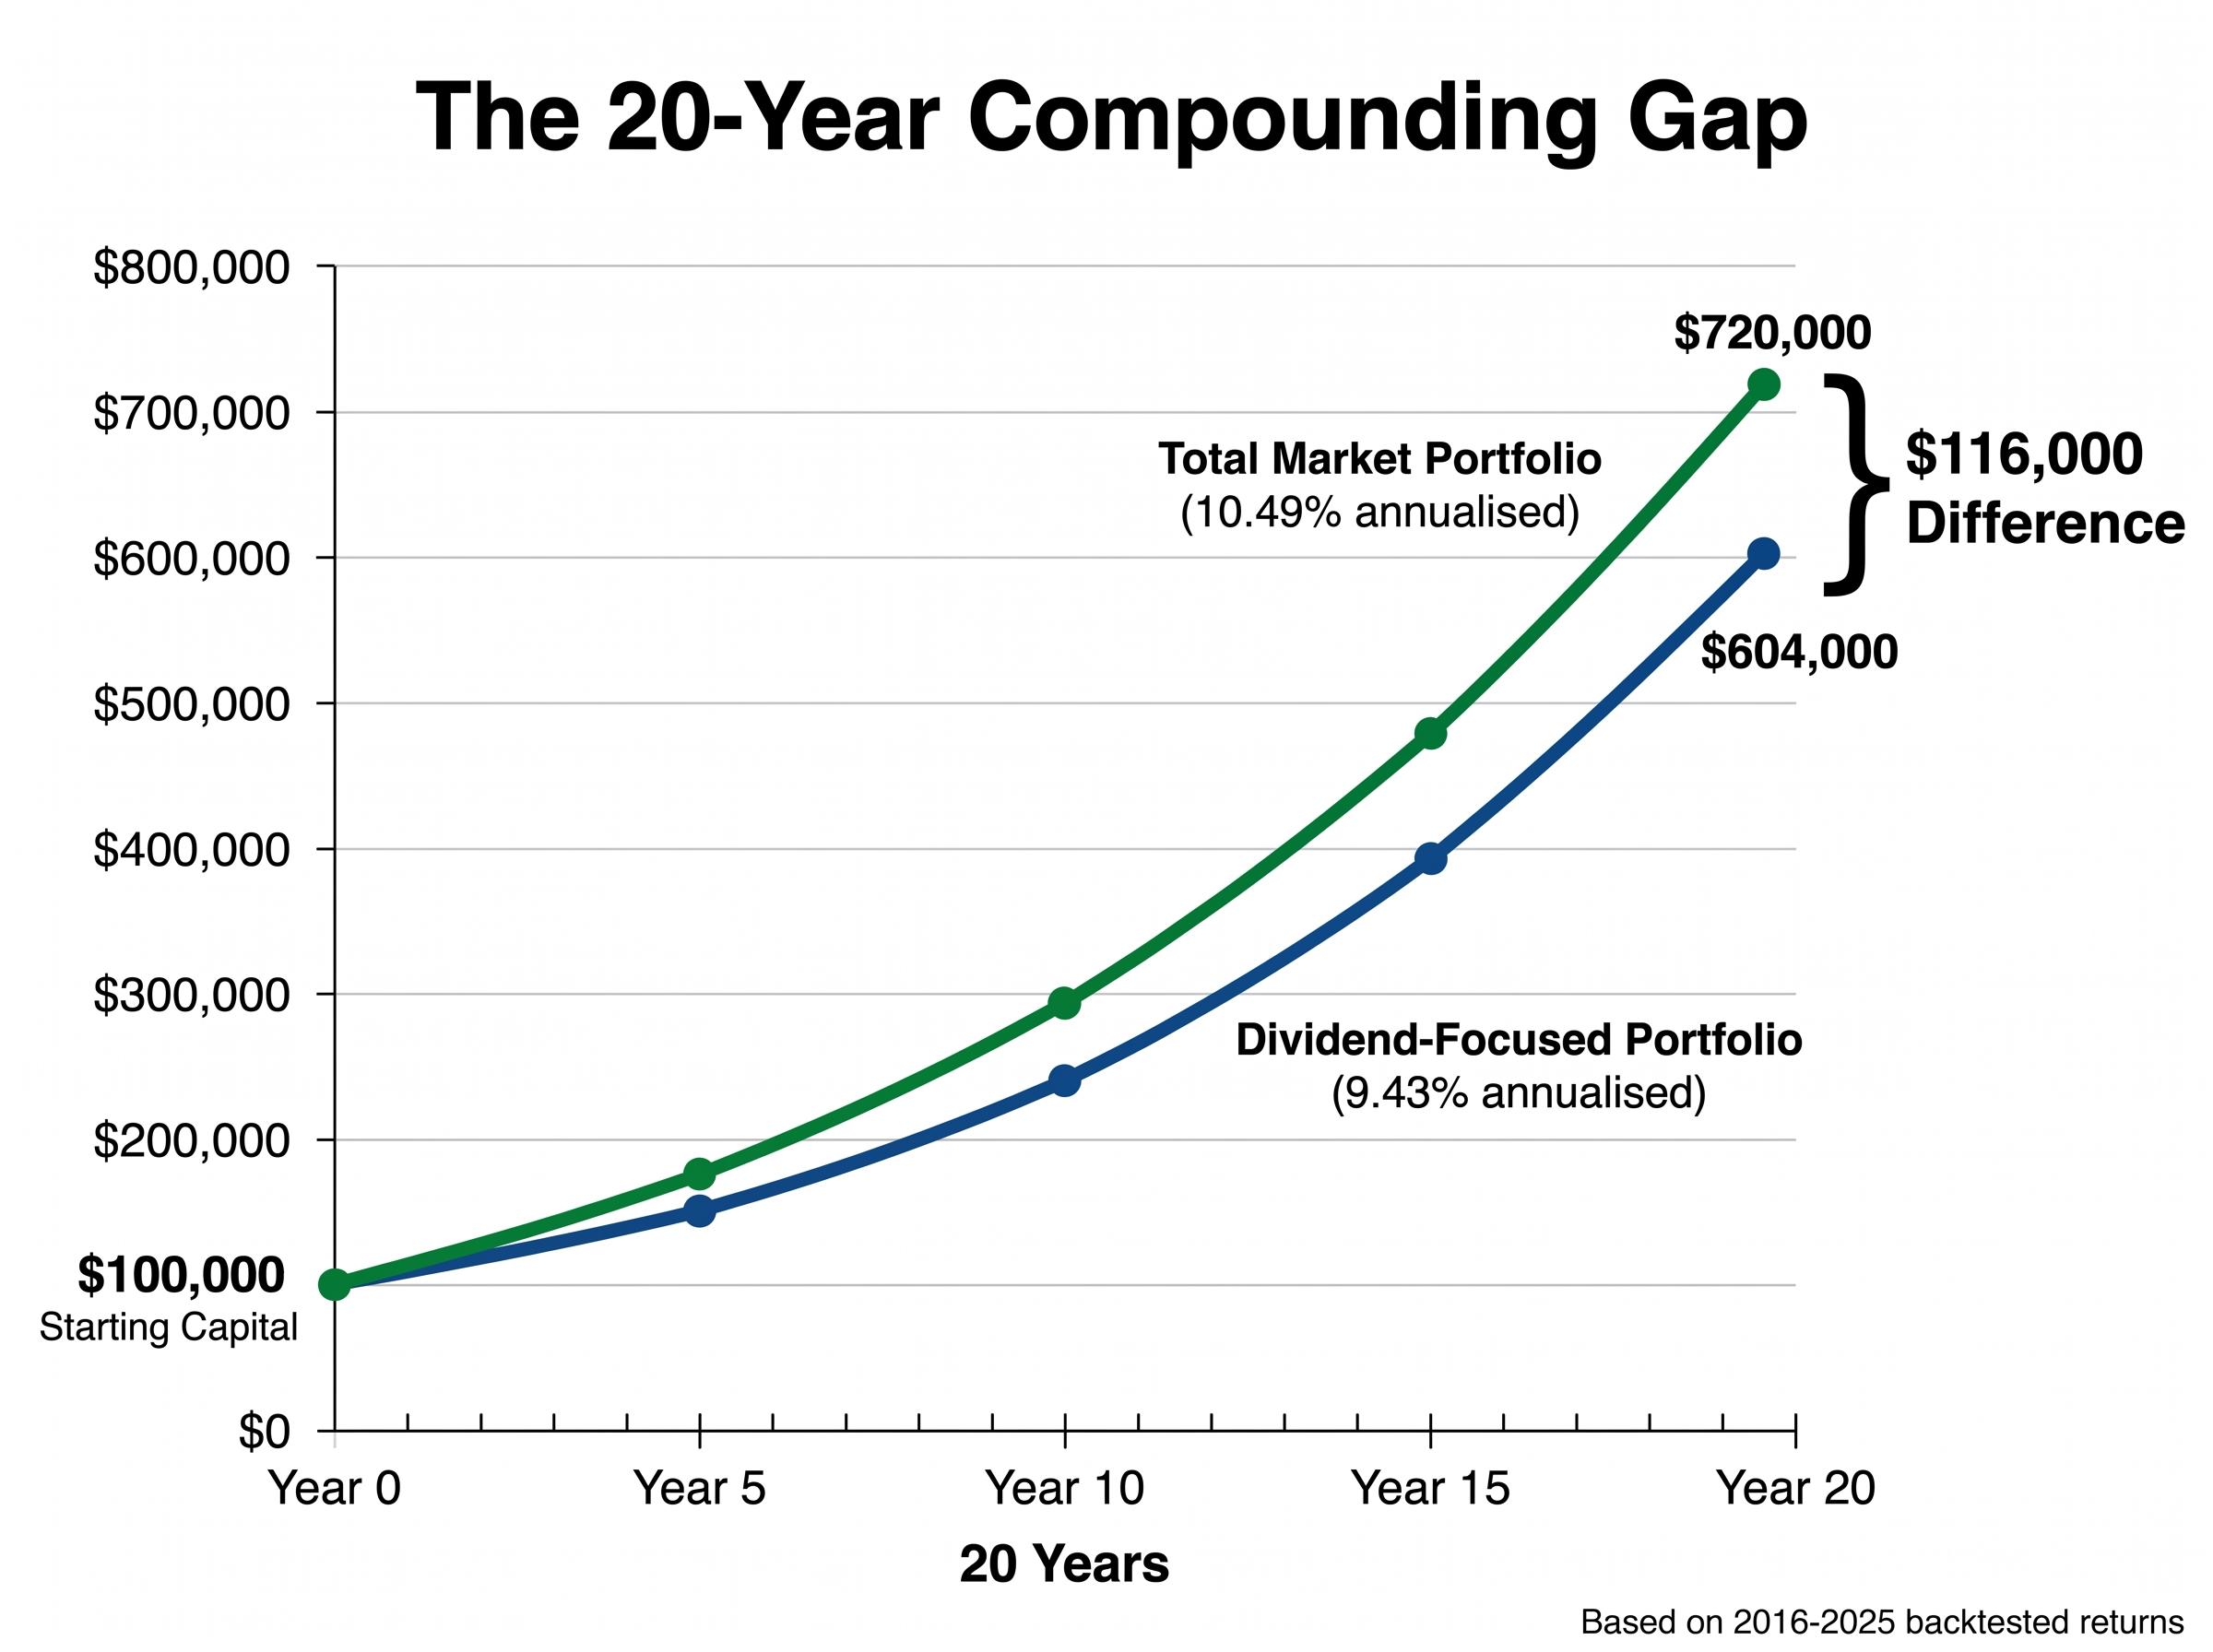
A Vanguard dividend-focused portfolio returned 9.43% annualised from 2016 to 2025. A total market portfolio returned 10.49% over the same period. That 1.06-percentage-point annual gap sounds modest until the maths runs forward across decades, where compounding turns small differences into six-figure divergences on the same starting capital.
In 2026, the dividend versus total return debate carries an added wrinkle. High-yield savings accounts are paying up to 5.00% APY, 10-year Treasuries yield 4.40%, and the S&P 500 Dividend Aristocrats index yields roughly 2.1%. The income case for dividend stocks is under genuine pressure from the rate environment, making the strategic question more consequential than it has been in years.
This guide works through the evidence on both strategies: what the backtested data shows, where dividend investing creates hidden risks, how fixed-income alternatives compare in the current environment, and how the right answer changes depending on where the investor sits in their financial lifecycle.
The cleanest comparison available runs a Vanguard dividend-focused portfolio against a total market portfolio over the same 2016-2025 window, measuring annualised total return in both cases. The distinction matters: total return includes both price appreciation and dividends received, so this is not a case of ignoring income on one side of the ledger. Both figures capture the full wealth outcome.
Annualised return, 2016-2025: Dividend-focused portfolio: 9.43%. Total market portfolio: 10.49%.
That 1.06-percentage-point gap compounds. On a $100,000 starting investment held for 20 years, the dividend-focused return grows to approximately $604,000. The total market return grows to approximately $720,000. Same starting capital, same time horizon, roughly $116,000 in difference, entirely attributable to the annual return gap compounding over time.
The more recent ETF performance data reinforces the pattern. As of May 2026, VTI (Vanguard Total Stock Market ETF) posted a one-year return of approximately 29.96%, compared to SCHD at approximately 26.16% and DVY at approximately 24.08%.
| ETF | Focus | Expense Ratio | 1-Year Return | 3-Year Return |
|---|---|---|---|---|
| VTI | Broad market | Low | ~29.96% | ~20.91% |
| SCHD | Dividend | 0.06% | ~26.16% | ~13.29% |
| VYM | Dividend | — | ~27.45% | — |
| DVY | Dividend | 0.38% | ~24.08% | — |
The total return formula, for reference: Total Return = [(End Price minus Start Price) + Dividends] / Start Price x 100. Both sides of the comparison use this calculation. The difference is not that one strategy ignores dividends; it is that broad market exposure captured more total wealth over this period.
The 9.43% annualised figure that appears on both sides of this comparison is not a coincidence; it reflects the same S&P 500 compounding baseline that anchors the broader evidence on long-term investment strategies, where reinvested dividends and sustained market exposure combine to produce most of the wealth outcome over multi-decade horizons.
Dividend yield is a ratio. When a stock’s price falls, its yield rises, even if the company has not increased its payout by a single cent. A stock trading at $100 with a $4 annual dividend yields 4%. If the price drops to $60 with the same payout, the yield jumps to 6.7%. That elevated yield is not generosity. It is the market pricing in risk.
Three companies with decades-long dividend track records illustrate what happens when investors treat a high yield as a buy signal rather than a warning.
| Company | Consecutive Years of Increases | Cut Outcome | Yield at Time of Concern |
|---|---|---|---|
| 3M | 66 years | Cut in 2024; removed from Dividend Aristocrats | Exceeded 4% |
| AT&T | Decades-long track record | Reduced dividend by 46% in 2022 | Elevated prior to cut |
| Walgreens | 40+ years | Cut after 40+ consecutive years of increases | Elevated prior to cut |
3M maintained 66 consecutive years of dividend increases before cutting in 2024, long enough that an entire generation of income investors treated the payout as permanent. AT&T reduced its dividend by 46% in 2022. Walgreens broke a streak of more than 40 years of annual increases. In each case, the yield looked attractive right up until it wasn’t.
An elevated yield can signal several things, none of them reassuring:
Every dollar paid as a dividend is a dollar not reinvested in the business. Companies with limited growth opportunities are often the ones paying the highest yields. That makes them attractive on a screener and dangerous in a portfolio.
Investors who want a principled framework for assessing whether a specific dividend-paying stock’s payout is sustainable and fairly priced can apply the dividend discount model, which values a share as the present value of its future income stream and exposes the growth-rate assumptions embedded in any current yield figure.
The arithmetic of dividend income is straightforward, but most investors considering the strategy have not run it against their own numbers. The formula: target annual income divided by portfolio yield equals required capital.
At three different yield levels, the capital required to generate $50,000 per year looks like this:
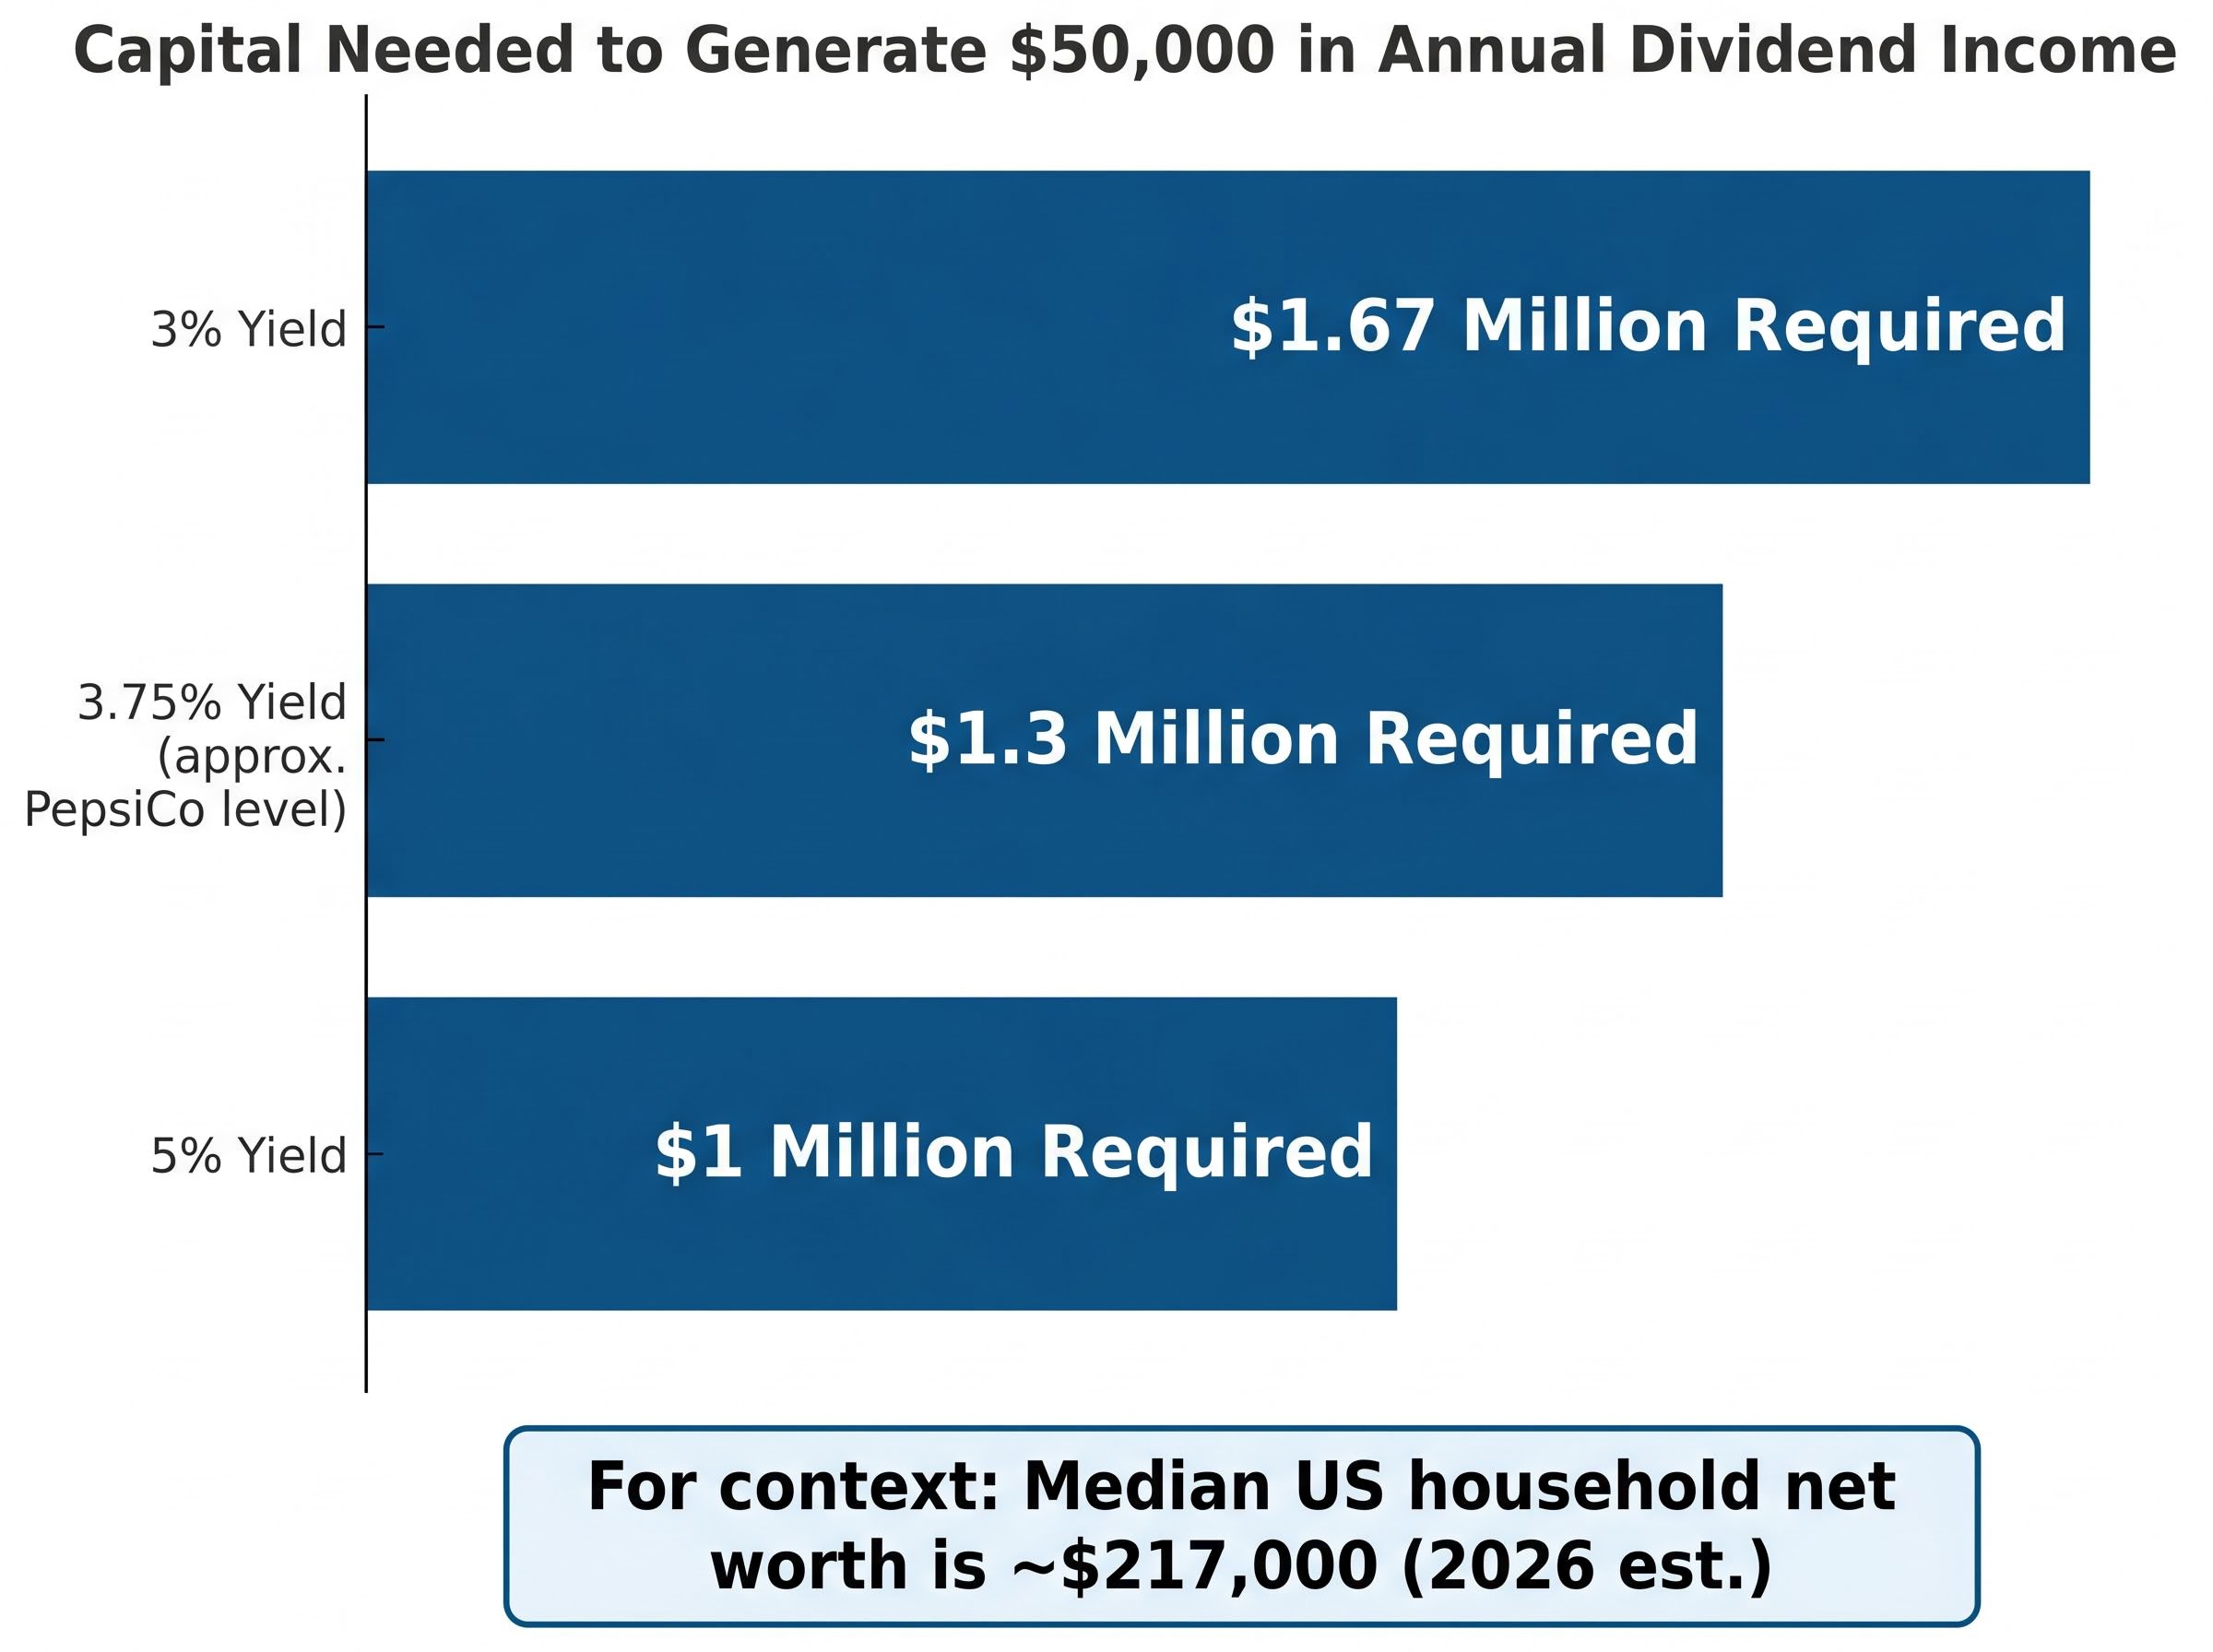
A typical diversified dividend portfolio yields somewhere between 2.5% and 3.5%, which means generating $50,000 in annual income requires approximately $1.4 million to $2 million in invested capital. At the other end of the spectrum, Apple yields approximately 0.39%, meaning an investor would need roughly $12.5 million in Apple shares alone to produce the same income.
The median U.S. household net worth sits at approximately $193,000 according to the 2022 Federal Reserve Survey of Consumer Finances, or an inflation-adjusted estimate of approximately $217,000 in 2026. At a 5% yield on that entire net worth, the annual income comes to roughly $10,850, well below living-expense thresholds for most American households.
The Federal Reserve Survey of Consumer Finances, which tracks U.S. household balance sheets across income and wealth distributions, recorded a 37% surge in real median net worth between 2019 and 2022, making the 2022 figure of approximately $193,000 the most current official benchmark available for gauging how far most households sit from dividend-income self-sufficiency.
The gap between where most investors start and where dividend-only income becomes viable is not a matter of modest adjustments. It is a gap that takes decades of accumulation to close, and the strategy chosen during those accumulation decades determines how quickly that gap narrows.
Dividend-paying stocks cluster in defensive sectors: consumer staples, healthcare, and utilities. This creates an implicit growth drag versus the total market, because it means systematically underweighting the sectors that have contributed most to total market returns.
Technology is the most consequential underweight. Over the 2016-2025 backtest period, the technology sector was the dominant contributor to broad market returns. Dividend-focused portfolios, by design, held less of it, because most high-growth technology companies pay low dividends or none at all. The VTI versus SCHD performance gap is not random variation; it reflects, in part, this structural sector tilt.
The current rate environment puts specific numbers behind what has been an abstract comparison for most of the past decade. As of 1 May 2026, the yield landscape looks like this:
| Instrument | Approximate Yield (May 2026) | Risk Level |
|---|---|---|
| 3-Month Treasury Bill | 3.68% | Near zero (U.S. government-backed) |
| 10-Year Treasury | 4.40% | Low (interest rate sensitivity) |
| Top High-Yield Savings Account | Up to 5.00% APY | Near zero (FDIC-insured) |
| S&P 500 Dividend Aristocrats | ~2.1% | Moderate to high (equity market risk) |
The Dividend Aristocrats yield approximately 2.1% while carrying full equity market risk. A high-yield savings account yields more than double that figure with federal deposit insurance. The 10-year Treasury yields more than double the Aristocrats’ payout with U.S. government backing. The risk-adjusted comparison is not close.
The U.S. Treasury yield curve rates published daily by the Department of the Treasury provide the official source for the 10-year yield figure of 4.40% and the 3-month bill rate of 3.68% used in this comparison, both of which are government-backed obligations carrying near-zero default risk.
iShares published commentary in February 2026 stating that dividend stocks may be an option if rates fall in 2026, positioning them as a source of income and diversification beyond cash and AI-driven market exposure. The institutional case for dividend stocks right now is forward-looking, contingent on a rate environment that has not yet materialised.
Some retail investors are already responding. Discussions across investment communities reflect a shift toward real estate and fixed income among income-seeking investors, drawn by yields that currently exceed what dividend portfolios can offer. This is not a permanent verdict on dividend investing, but it is a specific, time-stamped condition: in May 2026, investors paying equity-level risk for bond-level income deserve to know the alternative yields available to them.
The dividend versus total return question does not have a universal answer because risk capacity and compounding horizon vary by life stage. What follows is a framework structured around those two variables rather than age as a fixed number.
| Age Bracket | Dividend Allocation | Rationale | ETF Examples |
|---|---|---|---|
| Under 35 | 0% | Maximum compounding runway; growth-oriented investments offer higher long-term wealth accumulation | VTI, VTSAX |
| Late 30s | 5-10% | Begin introducing income stability as retirement horizon shortens | SCHD, VYM |
| 40s-50s | 15-50% | Increasing income needs and lower risk tolerance as retirement approaches; range depends on individual circumstances | SCHD, VYM, DVY |
For investors under 35, the compounding horizon is long enough that every dollar allocated to a lower-return income strategy carries a measurable opportunity cost. The 9.43% versus 10.49% gap over a 30-year career produces a larger wealth difference than it does over 10 years. Growth-oriented portfolios, with zero dividend allocation, are typically the stronger accumulation vehicle at this stage.
The accumulation phase decision extends beyond asset allocation into lump-sum versus staged deployment of capital, where the data shows lump-sum investing outperforms dollar-cost averaging in roughly 68-73% of historical periods, a finding that interacts directly with the compounding runway advantage that favours total return strategies for younger investors.
In the late 30s, a 5-10% allocation toward dividend ETFs begins to introduce income stability without materially sacrificing growth exposure. By the 40s and 50s, allocations of 15-20% up to 40-50% may be appropriate depending on proximity to retirement, income needs, and individual risk tolerance.
The tax treatment of dividends adds another layer to the comparison. Qualified dividends (shares held longer than approximately 60 days) are taxed at capital gains rates: 0% on earnings up to $49,450 annually and 15% on earnings from $49,451 to $545,500 under 2026 federal tax brackets. Investors do not choose when dividends arrive; they are taxed in the year they are paid, regardless of whether the investor needs the income.
Total return strategies offer a tax-timing advantage. Investors can generate income by selling a small portion of appreciated shares, sometimes called a “homemade dividend,” controlling both the timing and the amount. This means no forced annual tax event for investors who do not yet need the cash flow.
Roth IRA accounts eliminate the distinction entirely: all growth and dividend income is tax-free. For investors who hold dividend-paying assets, placing them inside a Roth eliminates the annual tax drag that erodes returns in taxable accounts.
The conditions that tilt the balance toward dividend investing versus total return are specific enough to list:
When none of those conditions apply, total return is the stronger default. And most well-constructed portfolios will include dividend-paying components naturally, without optimising for them, because diversified total market funds hold dividend-paying companies by definition. An investor in VTI already owns PepsiCo, Johnson & Johnson, and every other Aristocrat in the index.
Vanguard research paper, “Total Return Investing: An Enduring Solution for Low Yields” (author Colleen Jaconetti), provides a deeper examination of total return frameworks for investors who want to explore the evidence base further.
One concrete decision prompt: if a high-yield savings account or Treasury is currently yielding more than the intended dividend portfolio, that gap deserves explicit acknowledgment in the strategy. In May 2026, the Aristocrats yield 2.1% while top savings accounts pay up to 5.00% and the 10-year Treasury yields 4.40%. That is not a reason to abandon dividend investing permanently, but it is a reason to ask whether the current allocation reflects current conditions.
Over the 2016-2025 period, total return outperformed dividend-focused strategies by approximately 1.06 percentage points annually. The 2026 rate environment adds further pressure, with risk-free and near-risk-free yields exceeding the Dividend Aristocrats’ 2.1% payout.
The legitimate use cases remain. Investors in or near retirement who need predictable cash flow and lower portfolio volatility have a genuine reason to allocate toward dividend-paying holdings, particularly if rates decline from current levels and the fixed-income yield advantage narrows.
For everyone else, the age-based framework in this guide provides a recalibration starting point. Investors who have not recently compared their dividend yield against current risk-free alternatives should do so. The right answer is personal, but the evidence should inform it.
This article is for informational purposes only and should not be considered financial advice. Investors should conduct their own research and consult with financial professionals before making investment decisions. Past performance does not guarantee future results. Financial projections are subject to market conditions and various risk factors.
Dividend investing focuses on selecting stocks that pay regular income distributions, while total return investing prioritises overall wealth growth by capturing both price appreciation and reinvested dividends across the broadest possible market exposure.
Backtested data from 2016-2025 shows a Vanguard dividend-focused portfolio returned 9.43% annualised versus 10.49% for a total market portfolio, a 1.06 percentage point gap that compounds to roughly $116,000 in additional wealth on a $100,000 starting investment held for 20 years.
In May 2026, the S&P 500 Dividend Aristocrats yield approximately 2.1%, while high-yield savings accounts pay up to 5.00% APY and 10-year Treasuries yield 4.40%, meaning investors are currently accepting equity-level risk for a payout well below what risk-free alternatives offer.
At a typical diversified dividend portfolio yield of 2.5% to 3.5%, generating $50,000 per year in income requires approximately $1.4 million to $2 million in invested capital, a threshold far beyond the median U.S. household net worth of approximately $193,000.
The framework in the article suggests prioritising total return during accumulation years and shifting toward dividend allocations of 15% to 50% in your 40s and 50s as retirement approaches, income needs increase, and risk tolerance decreases.


