Fed Holds Rates but Dot Plot Signals a Hike Before Year-End
2 hrs ago

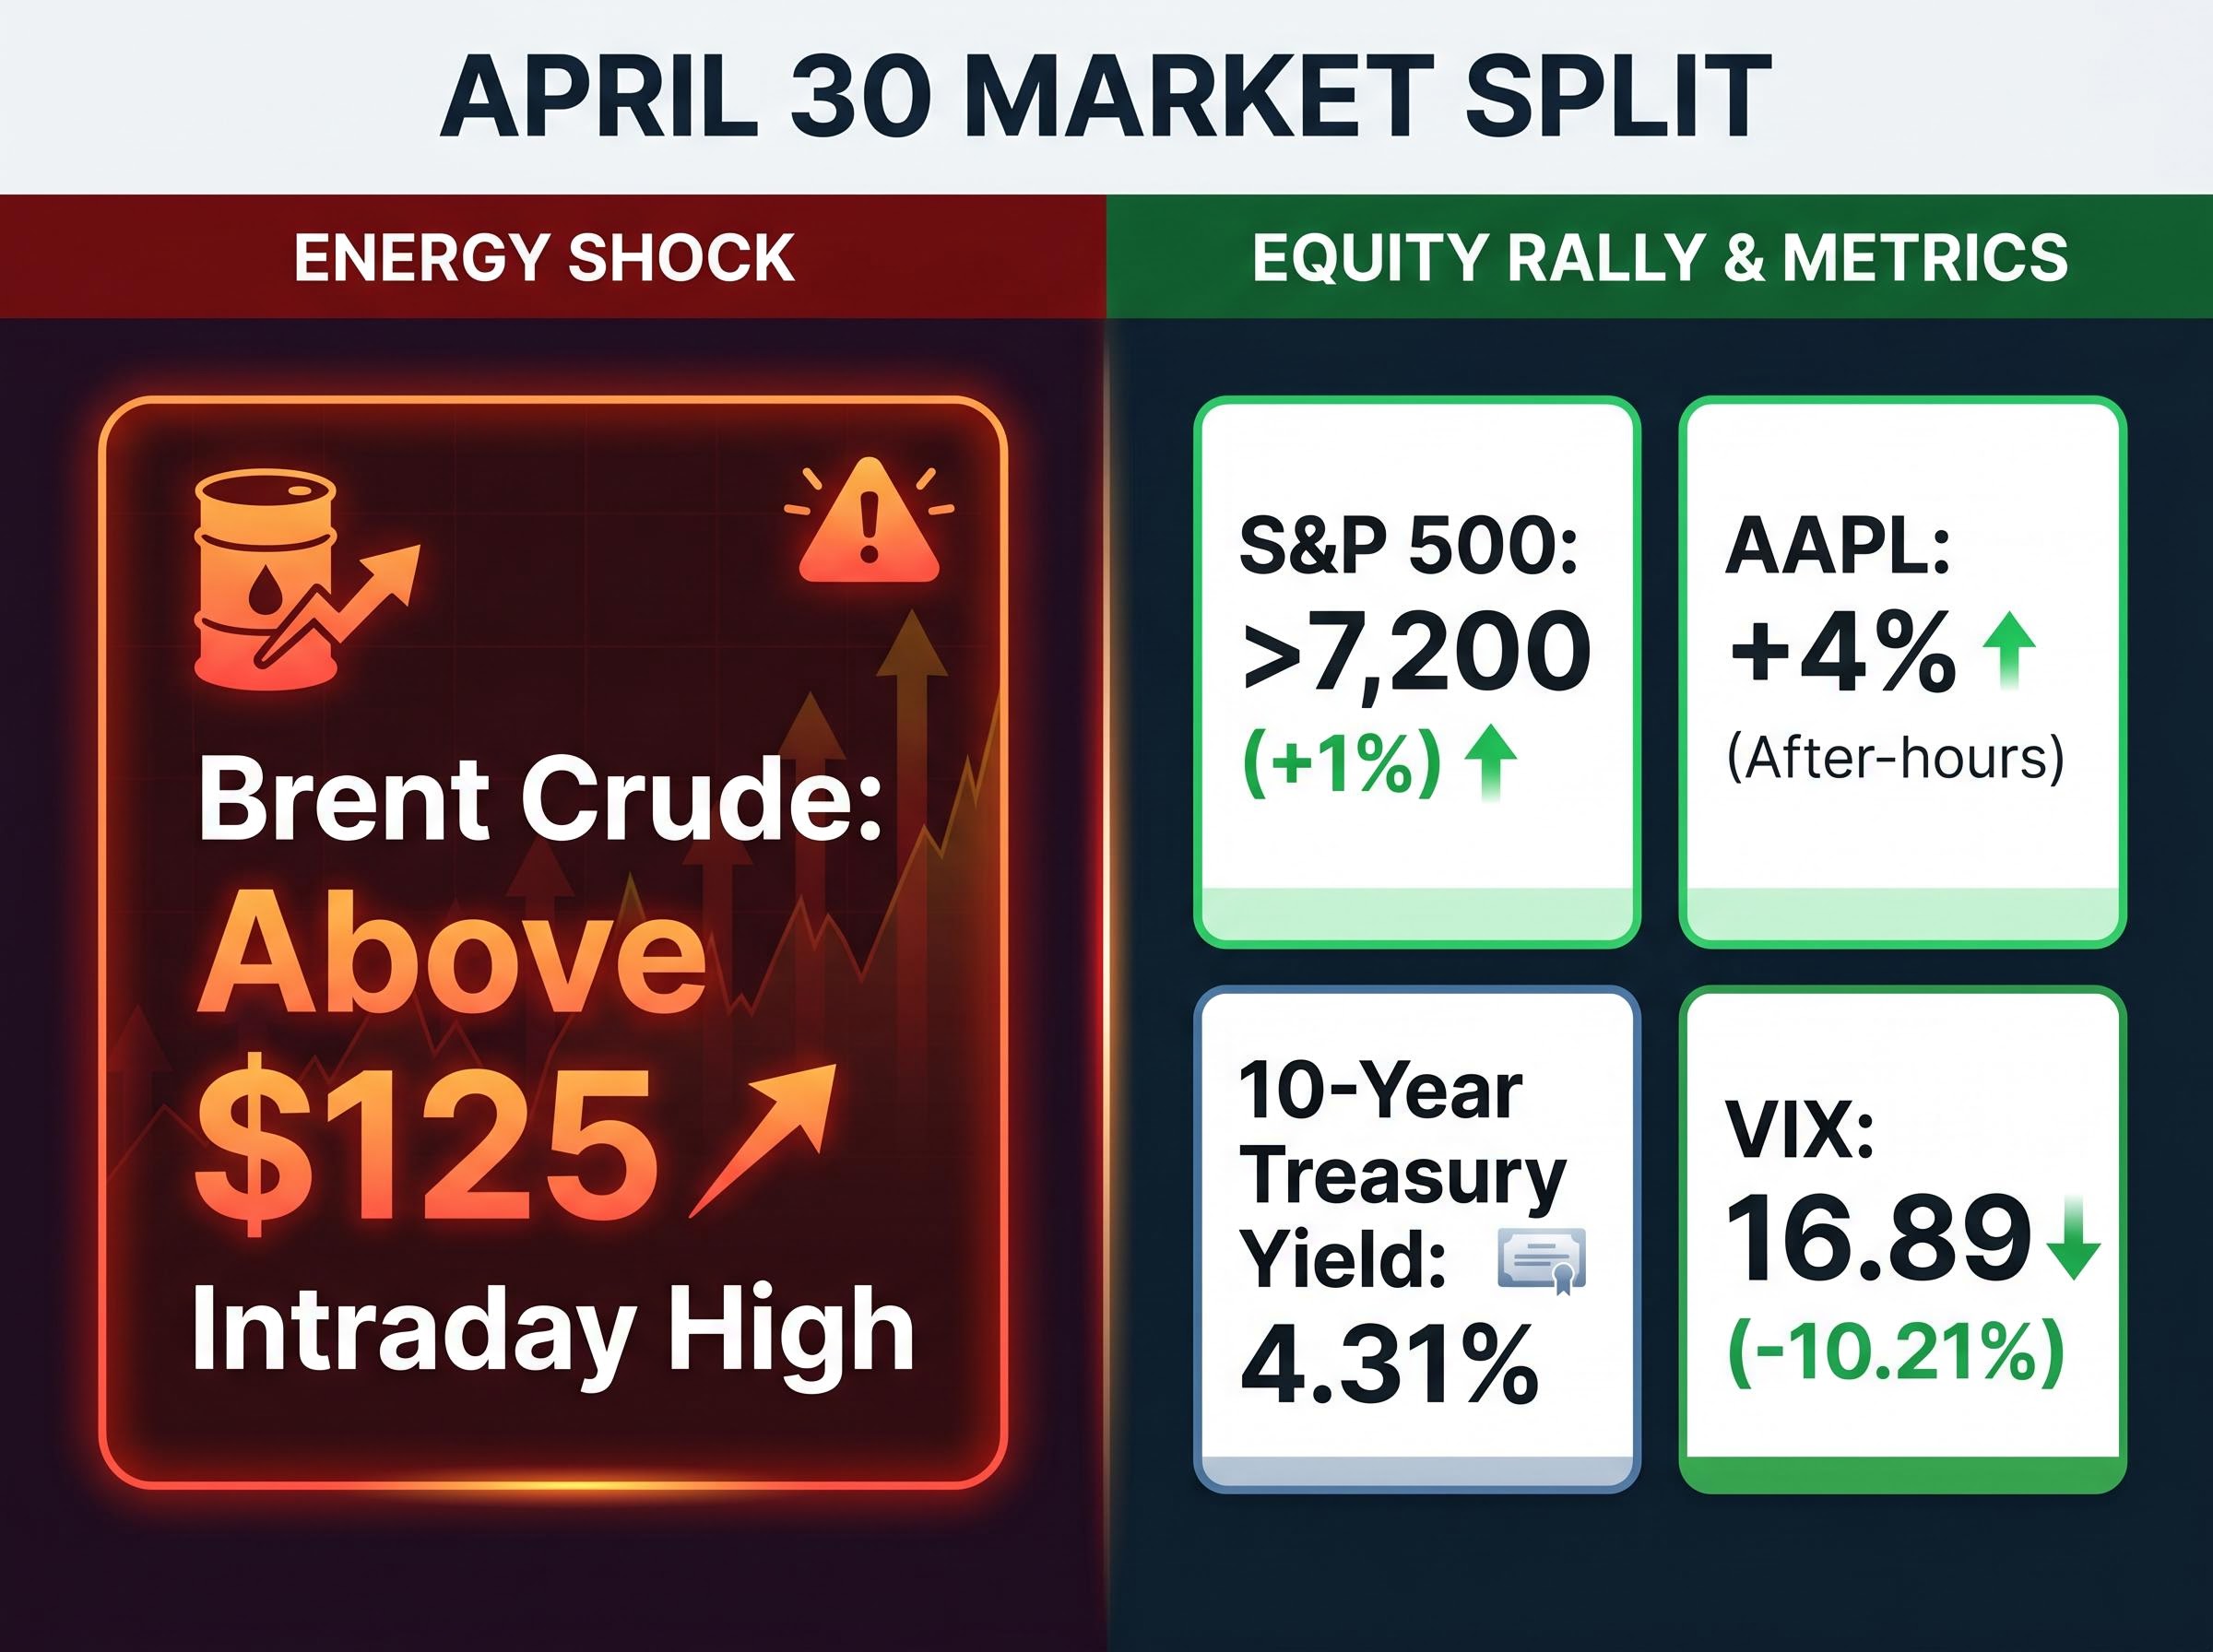
Brent crude surged above $125 per barrel on April 30, 2026, touching its highest level in approximately four years as the Strait of Hormuz recorded near-zero ship transits for a second consecutive week. The strait normally carries 15-20 million barrels of crude per day, representing up to a third of all seaborne oil trade. Its effective closure, following the failure of an April 8 ceasefire and Iran’s rejected mutual blockade proposal on April 30, has placed global energy markets under acute stress. What follows covers the price action itself, the physical supply disruption, the diplomatic deadlock, the financial market response, and what analysts project if the closure continues.
The spike came during Asian trading hours. Brent crude pushed above $125 per barrel on April 30, its highest intraday print in roughly four years, as reports of resumed U.S. military briefings on potential airstrikes reached trading desks. Within hours, the rally unravelled. Profit-taking and a marginally stronger U.S. dollar dragged Brent back to a closing range of $111.01-$115.98, with futures settling at $111.88, up $0.74 (0.67%).
Brent crude surged above $125 per barrel on April 30, its highest price in approximately four years.
The gap between the intraday peak and the close tells its own story. Traders are pricing two contradictory outcomes simultaneously: a prolonged closure that keeps supply offline for months, and a sudden diplomatic breakthrough that collapses the premium overnight. Neither scenario commands consensus.
WTI, the U.S. benchmark, sat at $105.21 as of approximately 1:40 a.m. EDT on May 1, after closing April 30 futures at $105.86, up $0.79 (0.75%). The widening Brent-WTI spread reflects how the disruption is landing: acutely in seaborne markets exposed to Hormuz flows, less directly in U.S. domestic supply. Energy markets have now advanced for five consecutive sessions.
| Metric | Brent Crude | WTI Crude |
|---|---|---|
| April 30 intraday high | Above $125 | Not confirmed |
| April 30 closing price | $111.01-$115.98 | $105.86 |
| May 1 early reading | ~$111.88 | $105.21 |
| Daily change (%) | +0.67% | +0.75% |
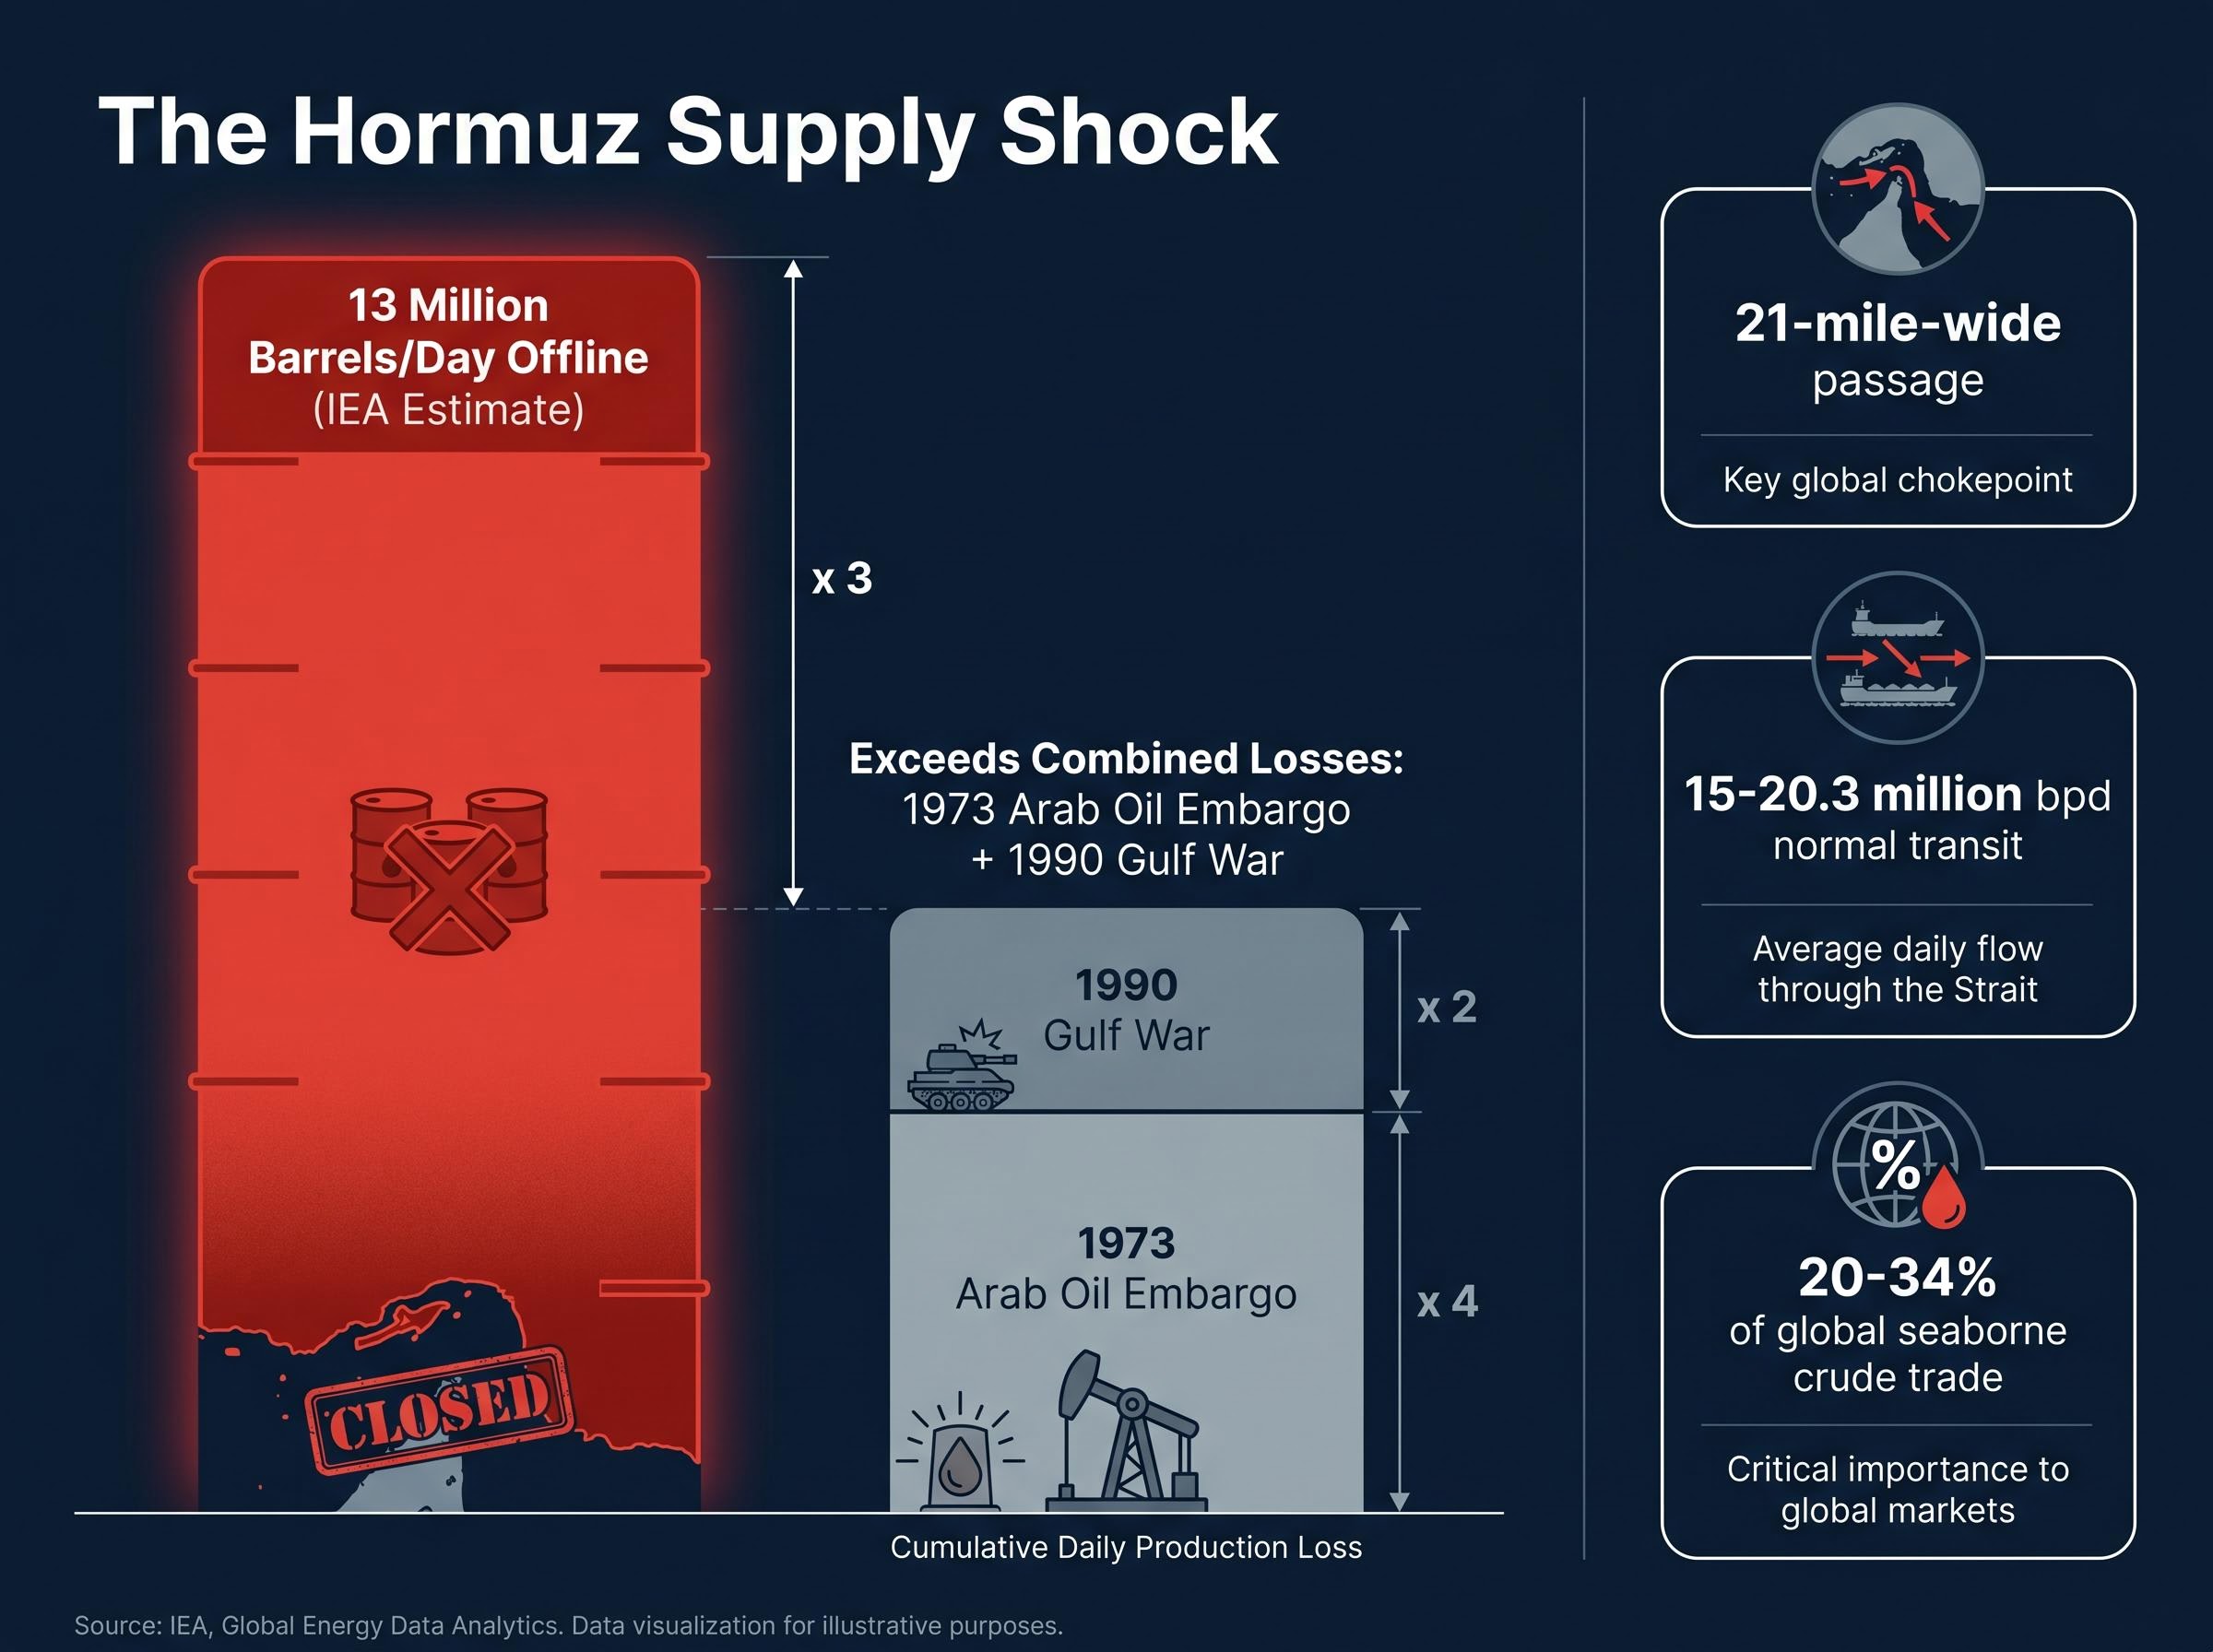
The Strait of Hormuz is a 21-mile-wide passage between Iran and Oman. Under normal conditions, it functions as the single most consequential maritime energy chokepoint on the planet.
The International Energy Agency (IEA) estimates that approximately 13 million barrels per day have been removed from global supply since the dual blockade took hold. Bloomberg’s Hormuz Tracker describes the situation as a “dual blockade” with ship transits at near-total halt, a condition unchanged since the April 8 ceasefire failed to restore meaningful traffic.
“The biggest energy security threat in history.” — Fatih Birol, IEA Executive Director
No modern precedent exists for a disruption of this scale and duration. The 13 million barrels per day offline exceeds the combined supply losses of the 1973 Arab oil embargo and the 1990 Gulf War invasion of Kuwait. Any portfolio with exposure to transport costs, manufactured goods, or energy-linked assets is directly affected by what flows, or does not flow, through this passage.
The global supply deficit mechanics driving the current price level go deeper than the strait closure alone; Goldman Sachs has projected a 9.6 million barrels per day shortfall, Iran faces a 12-22 day storage capacity limit that could cause irreversible well damage if shut-ins are forced, and the UAE’s impending departure from the major petroleum cartel is set to permanently restructure its pricing power.
The IEA Strait of Hormuz energy security analysis places the strait’s normal throughput at roughly 25% of all seaborne oil trade, a figure that underscores why the current dual blockade constitutes a supply shock with no modern parallel in either scale or duration.
The last formal de-escalation attempt came on April 8, when both sides agreed to a ceasefire. It produced no durable political resolution. Ship traffic through the strait remained at near-zero levels in the weeks that followed, and neither government moved to enforce the terms that would have reopened the waterway.
The sequence since then has narrowed, not widened, the path to resolution:
Both parties hold maximalist positions. The United States maintains its naval blockade of Iranian ports and conditions any easing on a comprehensive agreement that extends beyond the strait. Iran has declared the strait permanently closed unless the U.S. lifts its own blockade first.
No third-party mediator has been confirmed. No negotiating channel has been publicly acknowledged. Market analyses and U.S. government briefings explicitly cite the risk of resumed hostilities. The supply disruption, as of this morning, has no visible off-ramp.
A supply-driven oil price increase does not stay in the oil market. It feeds into transport costs, manufacturing inputs, and consumer prices across economies. When crude rises and stays elevated, the cost of moving goods by sea, road, and air rises with it. Those costs pass through supply chains and, eventually, reach households.
Analysts estimate the current disruption could add approximately 0.8 percentage points to inflation globally. If the closure persists, projections indicate prices could remain 20-30% above pre-crisis levels for up to 12 months, with a price floor of $100+ per barrel as long as the strait stays shut.
Sustained disruption could keep prices 20-30% above pre-crisis levels for up to 12 months, according to analyst projections.
The U.S. has deployed several policy responses, though none has arrested the upward price trend.
| Policy Response | Description | Estimated Effect |
|---|---|---|
| SPR releases | Strategic Petroleum Reserve drawdowns to supplement domestic supply | Partial price offset; insufficient to replace Hormuz volumes |
| Sanctions waivers | Waivers on Iranian and Russian oil to increase available supply | Incremental supply addition; limited by logistics and refining capacity |
| Naval blockade continuation | Maintained U.S. blockade of Iranian ports pending broader deal | Restricts Iranian exports; maintains pressure but constrains supply |
The 10-year U.S. Treasury yield stood at 4.31% on April 30, with two-year yields moving higher on the back of the oil surge. An additional 0.8 percentage points of inflation pressure complicates central bank rate decisions, bond pricing, and household purchasing power globally.
Central bank policy divergence is emerging as a second-order consequence of the price surge, with the U.S. Federal Reserve delaying rate cuts while other central banks signal potential tightening, even as powerful disinflationary counter-forces including Chinese manufacturing exports and AI productivity gains work against the immediate price increases.
The S&P 500 closed above 7,200 for the first time on April 30, gaining 1% on the session. The Dow Jones Industrial Average rose 1.6%. Apple (AAPL) climbed approximately 4% in after-hours trading after an earnings beat. U.S. equities set all-time highs on the same day oil prices hit four-year highs.
That is not a contradiction the market has resolved. It is one it has compartmentalised. Strong corporate earnings drove equities higher; the Hormuz crisis drove crude higher. Investors are treating the two as separate risk buckets, at least for now.
The VIX fell 10.21% to 16.89, indicating reduced near-term equity fear even as oil volatility surged. Gold futures edged up marginally, and silver gained 0.87%, consistent with broad commodity strength but not the dramatic safe-haven surge that typically accompanies a full risk-off environment.
A falling VIX alongside surging oil is an unusual signal. It suggests equity markets are not yet treating the Hormuz crisis as a systemic threat to corporate earnings, even as energy markets price in a historic supply shock. The question is how long that compartmentalisation holds if oil stays above $100 and inflation pressures compound.
Safe-haven asset behaviour during the current crisis has defied historical precedent in notable ways; gold reached $4,605.49 per ounce by late April 2026 on panic capital flows, yet long-duration government bonds have underperformed as stagflation fears prevent the traditional flight-to-safety bid that typically accompanies geopolitical shocks of this magnitude.
The forward path splits cleanly into two scenarios:
No one can answer which path materialises, because both parties hold positions that preclude compromise without significant concession.
Investors weighing the two-scenario framework will find our full explainer on oil price transmission into recession, which examines the four simultaneous channels through which sustained crude prices erode the economy, models the Morgan Stanley adverse case of $150-180 per barrel, and traces how every major U.S. recession since 1973 has followed the structural pattern now visible in 2026.
Chevron (CVX) and Exxon Mobil (XOM) report earnings before market open on May 1, and their commentary on supply-side conditions could move energy markets further. The signals worth watching remain specific: any confirmed mediation effort, changes in Bloomberg’s Hormuz Tracker transit counts, and official statements from Washington or Tehran following the resumed military briefings.
“The biggest energy security threat in history.” — Fatih Birol, IEA Executive Director
The Strait of Hormuz closure has produced the sharpest sustained oil price shock in four years, with no diplomatic off-ramp visible as of May 1, 2026. Approximately 13 million barrels per day remain offline. Inflation projections are rising. Two nuclear-adjacent powers are locked in maximalist positions with no confirmed mediator between them.
The most reliable leading indicators of where this crisis heads next are Hormuz traffic data, official statements from both governments, and energy sector earnings. The price of oil is, for the moment, the price of uncertainty.
This article is for informational purposes only and should not be considered financial advice. Investors should conduct their own research and consult with financial professionals before making investment decisions. Forward-looking statements regarding oil prices, inflation impacts, and diplomatic outcomes are speculative and subject to change based on market developments and geopolitical conditions.
—
The oil price spike is being driven by the near-total closure of the Strait of Hormuz, which normally carries 15-20 million barrels of crude per day. A diplomatic deadlock between the United States and Iran, following the failure of an April 8 ceasefire, has kept ship transits at near-zero for two consecutive weeks.
The International Energy Agency estimates that approximately 13 million barrels per day have been removed from global supply since the dual blockade took hold, a volume that exceeds the combined supply losses of the 1973 Arab oil embargo and the 1990 Gulf War invasion of Kuwait.
Analyst projections indicate that if the closure persists, oil prices could remain 20-30% above pre-crisis levels for up to 12 months, with a price floor of $100 or more per barrel as long as the strait stays shut.
Analysts estimate the current disruption could add approximately 0.8 percentage points to global inflation, as higher crude prices feed into transport costs, manufacturing inputs, and consumer prices across supply chains. This also complicates central bank rate decisions, with the U.S. Federal Reserve delaying rate cuts as a result.
The S&P 500 closed above 7,200 for the first time on April 30, 2026, driven by strong corporate earnings including an Apple earnings beat, while investors appear to be treating the Hormuz crisis and equity markets as separate risk buckets. The VIX fell 10.21% on the same day, suggesting equity markets are not yet pricing the closure as a systemic threat to corporate earnings.