The Case Against Thematic ETFs After 2026’s Sector Rotation
6 mins ago

ANZ Group Holdings delivered a 62% surge in statutory profit and a 70% jump in cash profit for the first half of 2026, then watched its shares fall approximately 1% on the same day the broader ASX 200 rose nearly 1%. The results, covering the six months to 31 March 2026 and released on 1 May 2026, arrive at a time when income investors are closely watching the Big Four banks for dividend sustainability and yield competitiveness. ANZ’s 83-cent interim dividend now carries a trailing yield of 4.58%, the highest among Australia’s major banks. What follows is a breakdown of what drove the headline profit numbers, what the dividend announcement means for shareholders and prospective buyers, and why a profit surge did not translate into a share price gain.
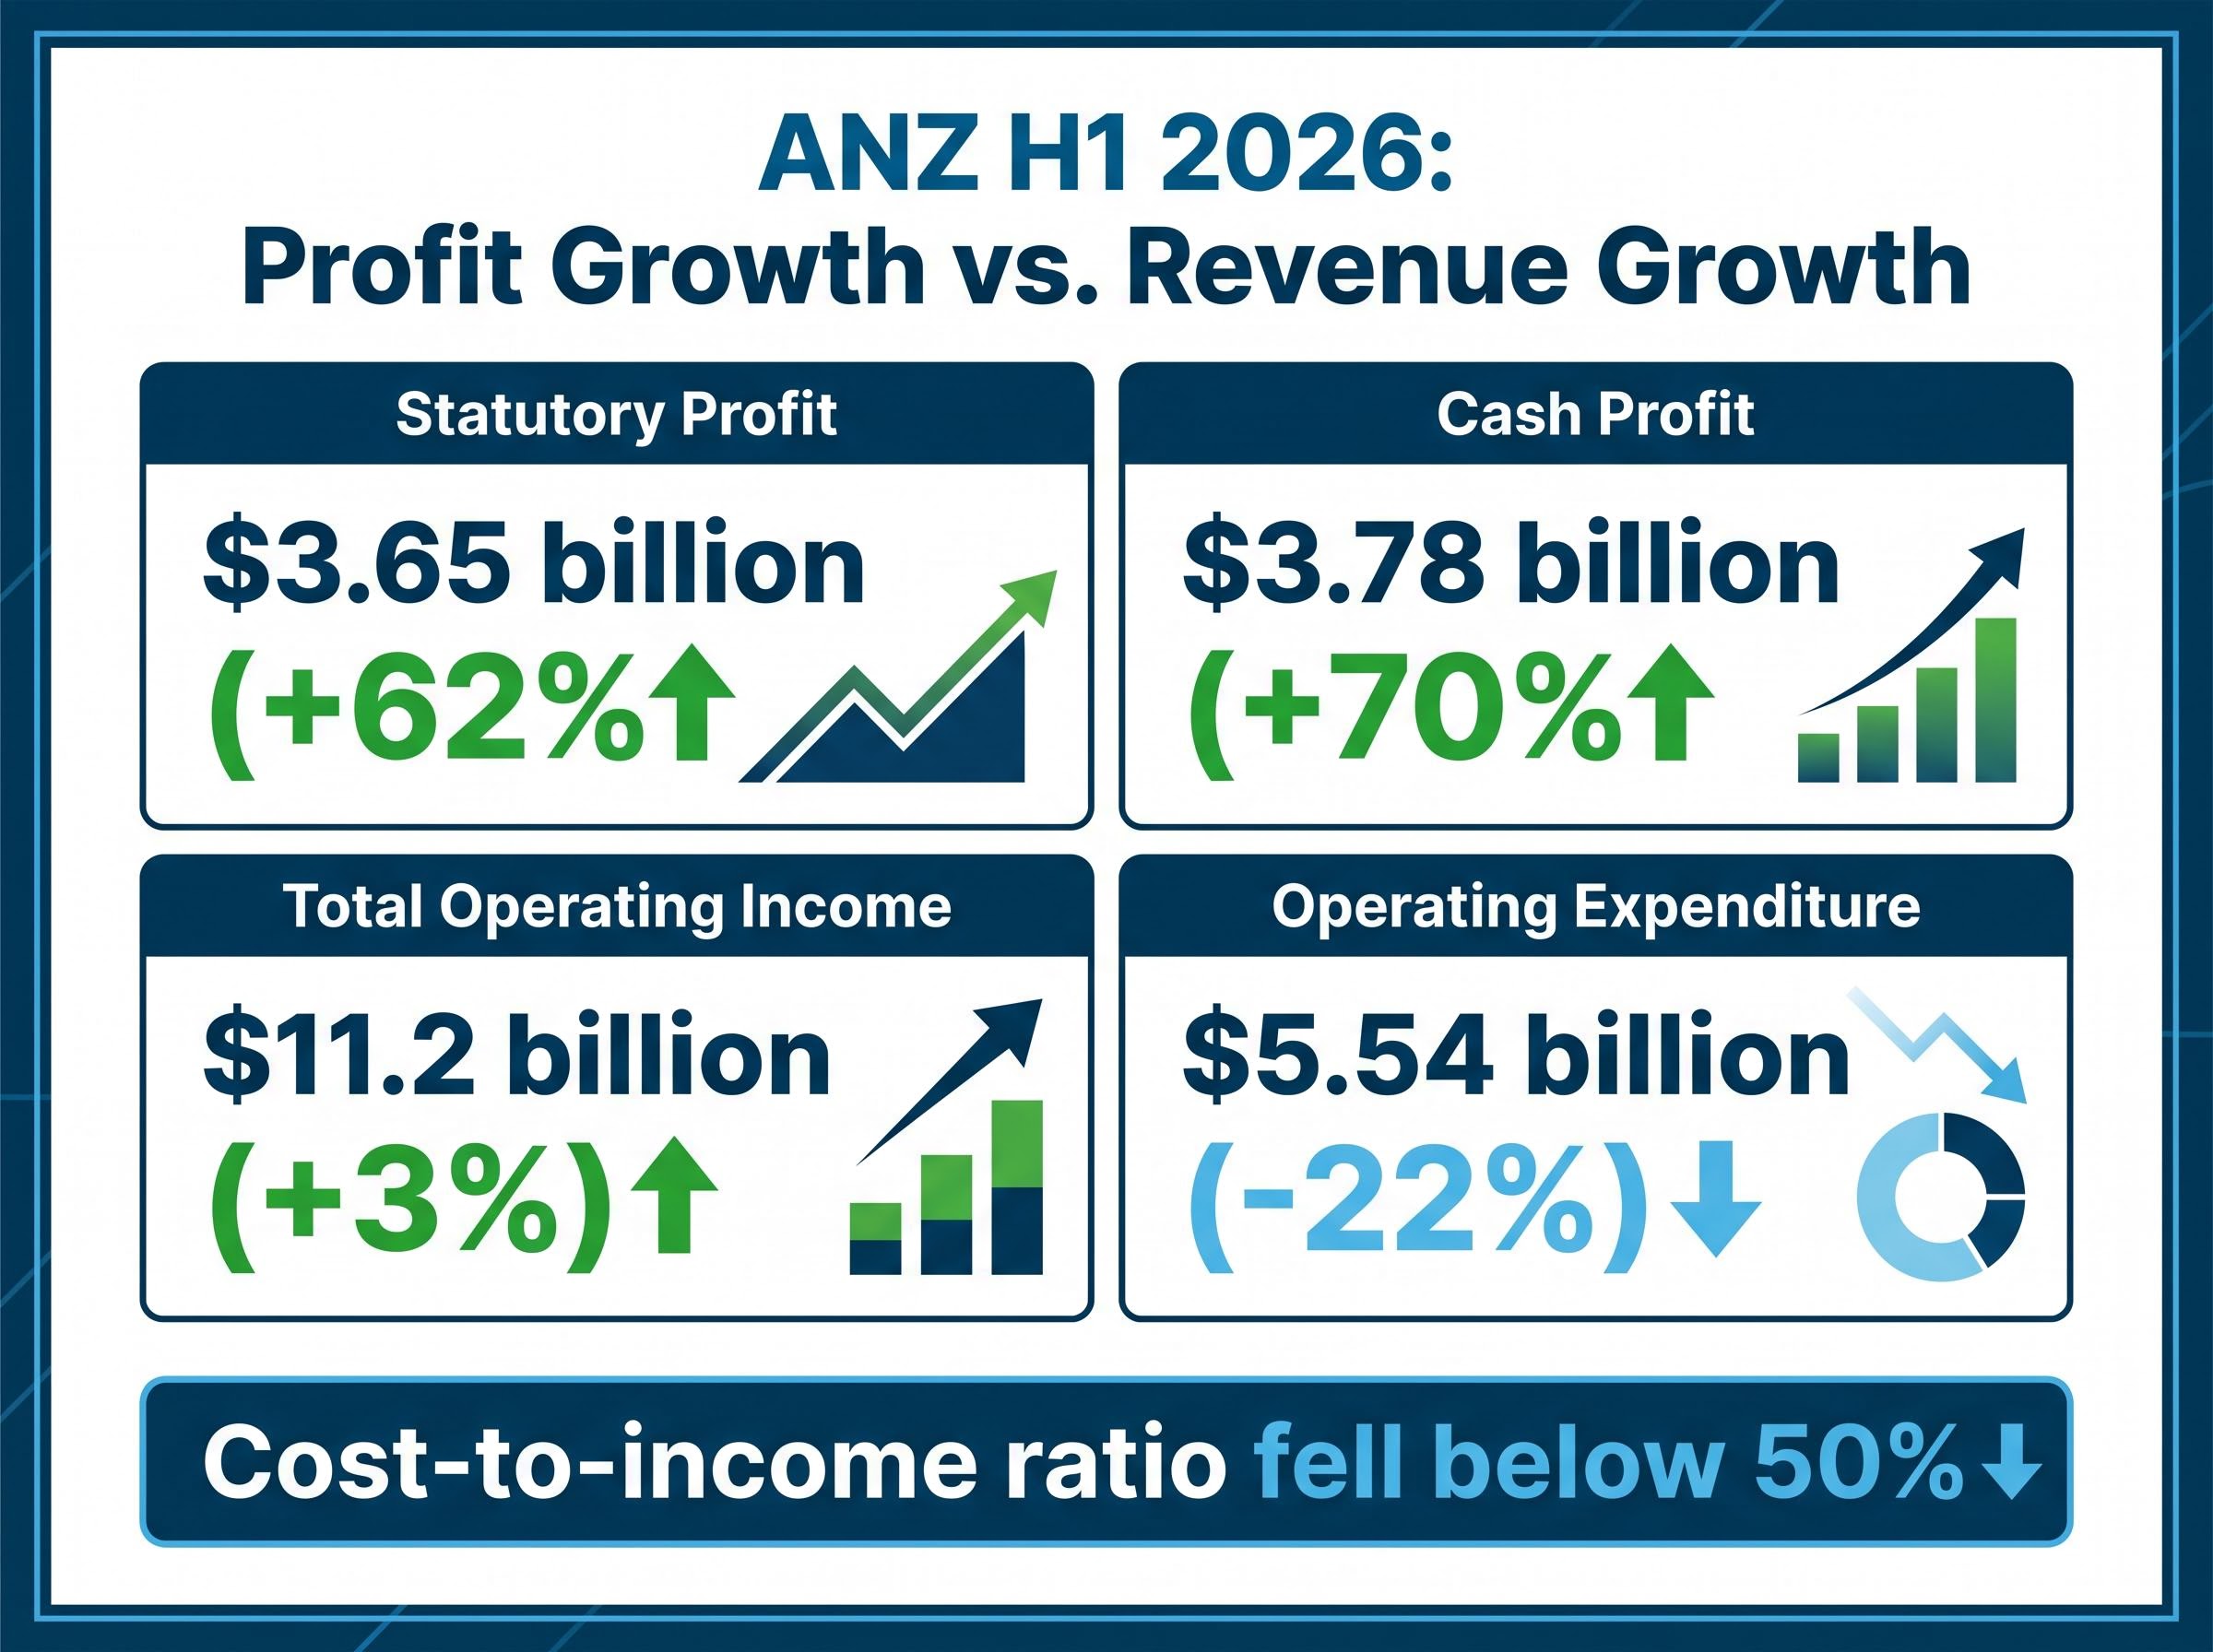
The headline figures are striking. Statutory profit reached $3.65 billion, up 62% on the preceding half. Cash profit hit $3.78 billion, up 70% (or 14% excluding significant items). The numbers command attention, but the engine behind them tells a different story from the one the percentages suggest.
Total operating income grew just 3% to $11.2 billion. The profit surge was not a revenue windfall. It was an engineering feat built on operating expenditure falling 22% to $5.54 billion, pulling ANZ’s cost-to-income ratio below 50% for the half.
ANZ’s cost-to-income ratio fell below 50% for the half, a threshold that signals meaningful efficiency improvement.
Understanding whether cost or revenue drove the result matters directly for assessing repeatability. A revenue-driven surge suggests demand momentum. A cost-driven surge raises a different question: how much further can expenses fall?
ANZ attributes the expenditure reduction to an ongoing efficiency programme that has now completed over 60% of planned role exits. Business simplification efforts, including consolidation of internal operations and streamlining of support functions, have contributed to a sustained cost trajectory rather than a single quarter of belt-tightening.
The 1Q26 results, confirmed earlier in 2026, showed operating expenditure reduced 21% to $2.8 billion for the quarter. That partial-period figure aligns with the broader 22% reduction cited for the full first half, though the H1 figure has not been independently confirmed across the entire period.
ANZ management has not publicly flagged the H1 cost reductions as non-recurring in available commentary. Coverage of FY25 results emphasised disciplined cost management balanced against digital investment, suggesting the programme reflects structural change rather than cyclical trimming.
A data gap remains. The H1 2026 earnings call transcript or results presentation would be the definitive source for management guidance on the cost trajectory into the second half. Until that detail surfaces, the market is pricing the savings as partially structural, partially uncertain.
ANZ declared an interim dividend of 83 cents per share, unchanged from the level maintained since July 2024. The payout is predictable but not growing. For income-focused shareholders, the stability offers certainty; for those seeking dividend growth, the flat trajectory is worth noting.
Dividend cut risk across the Big Four is not symmetrical: ANZ and Westpac carry payout ratios sitting above their own stated target ranges, a detail that complicates the income case even when headline yields look attractive relative to CBA or NAB.
The more meaningful shift sits in the franking. ANZ increased franking to 75%, up from 70% on both 2025 dividends. For Australian investors who benefit from franking credits, the improvement lifts the after-tax return marginally above what the headline yield suggests.
| Detail | Value | Previous | Notes |
|---|---|---|---|
| Dividend per share | 83 cents | 83 cents | Unchanged since July 2024 |
| Franking | 75% | 70% | Up from both 2025 dividends |
| Trailing yield | 4.58% | N/A | Based on $36.29 share price |
| Ex-dividend date | 11 May 2026 | N/A | DRP election deadline: 13 May 2026 |
| Payment date | 1 July 2026 | N/A |
At 4.58%, ANZ’s trailing yield sits above those of CBA, NAB, and Westpac as of May 2026.
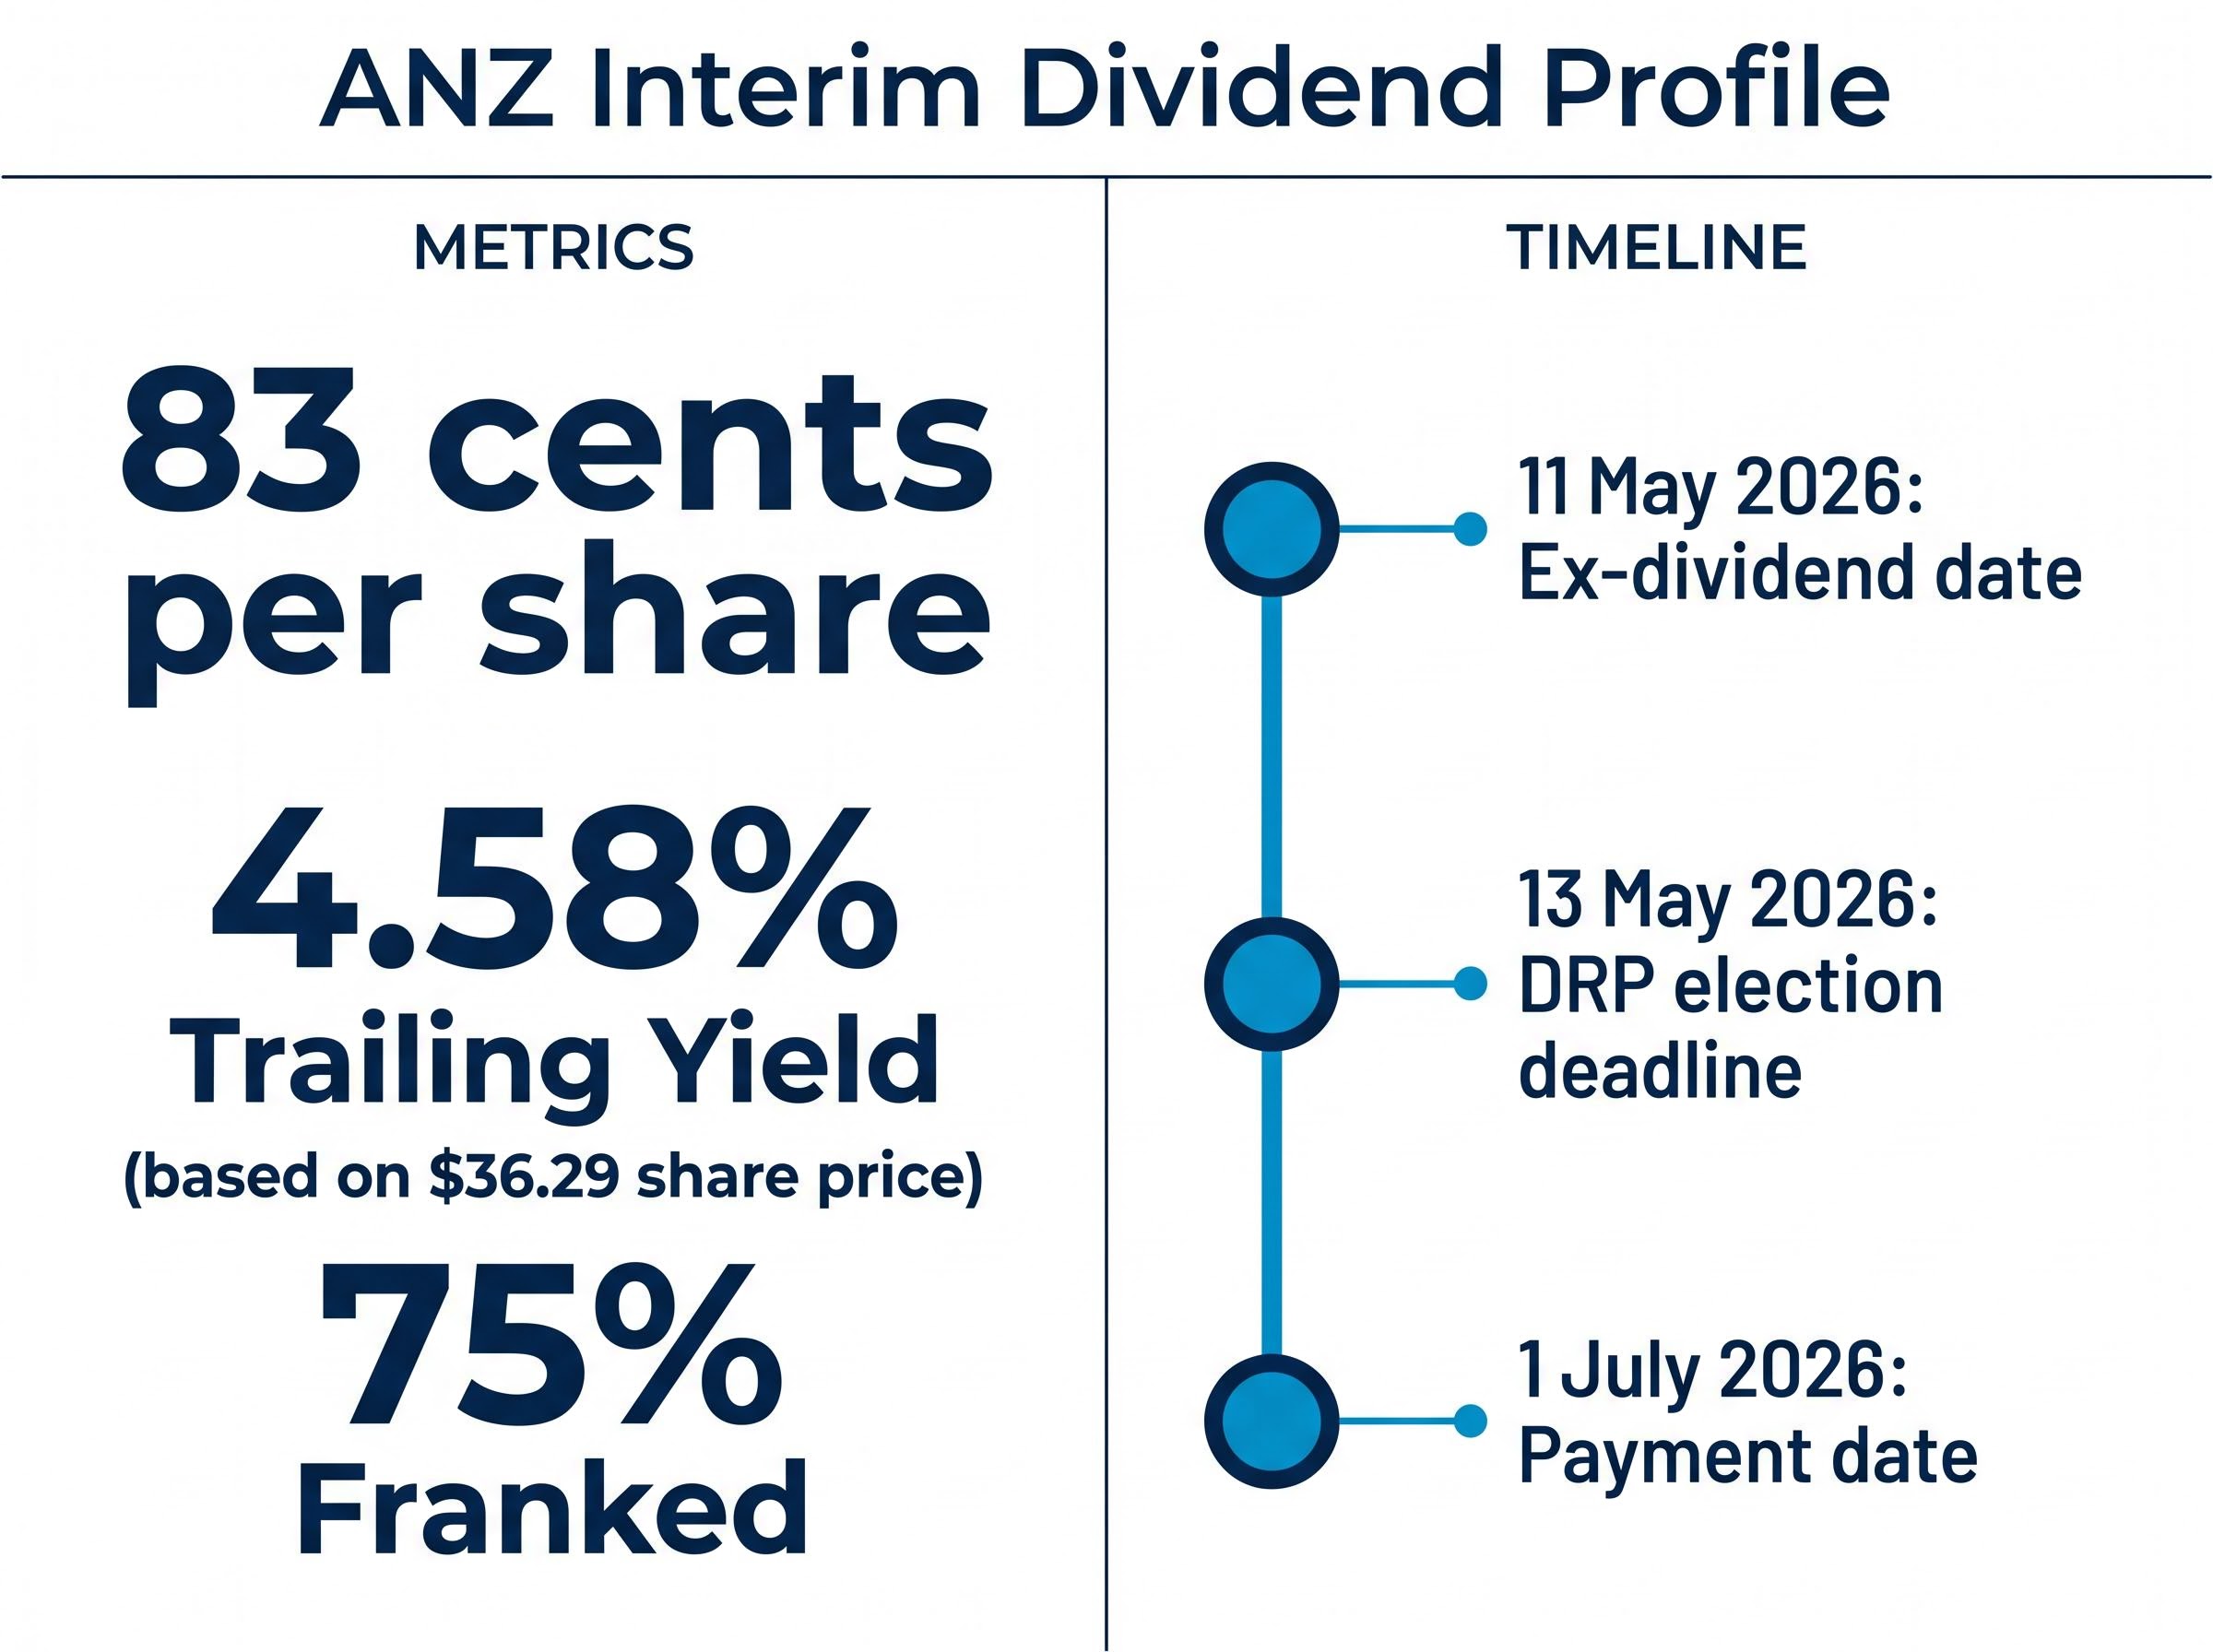
The ex-dividend date of 11 May 2026 gives prospective buyers a narrow window. The Dividend Reinvestment Plan (DRP) election deadline falls on 13 May 2026, and payment is scheduled for 1 July 2026.
ANZ shares closed at $36.29 on 1 May 2026, down approximately 1.01%, while the ASX 200 gained 0.94%. A bank that just reported a 62% statutory profit increase underperformed the market on results day. The disconnect looks strange until the mechanism behind it becomes clear.
Markets do not price outcomes. They price the gap between what was expected and what arrived. ANZ’s statutory net income appears to have fallen short of analyst consensus estimates of approximately $3.73 billion. The cash profit surge was already partially known from the 1Q26 update in February 2026, which had driven an approximately 8% share price gain at the time. By 1 May, much of the good news was already embedded in the price.
ANZ’s Q1 2026 earnings surprise, which drove an 11% share price surge in February, meant that much of the profit optimism heading into 1 May was already embedded in the stock; the H1 result confirmed the trend rather than extending it, which is precisely when markets tend to sell.
Markets price the gap between expectation and outcome, not the outcome itself. ANZ’s profit surge was known; the statutory miss was not.
Three factors contributed to the sell-off:
The expectations gap, where a strong absolute result produces a negative share price reaction because it fell short of what was priced in, is one of the most common sources of confusion during ASX earnings season. A 62% profit surge and a 1% share price decline can coexist when the market had already moved ahead of the announcement.
ANZ’s result lands within a sector where several conditions remain supportive heading into the second half of 2026:
The sector-wide provisioning outlook complicates the picture beyond ANZ’s own credit quality metrics: Morgans forecasts total Big Four provisions rising from approximately $2.4 billion in FY25 to approximately $5.5 billion by FY27, a trajectory that would pressure earnings across the sector regardless of individual cost discipline.
APRA’s capital adequacy prudential standards establish the minimum CET1 ratio requirements that Australian authorised deposit-taking institutions must satisfy, with the current framework setting the basis against which ANZ’s 12.39% ratio is measured for regulatory compliance and dividend capacity assessment.
The friction points are real. ANZ’s net interest margin (NIM) of 1.56% for the September 2025 half remains the benchmark to watch. NIM measures the difference between what a bank earns on loans and what it pays on deposits; compression in this metric would directly pressure earnings regardless of cost discipline.
ANZ’s CET1 ratio of 12.39% provides adequate buffer, though it sits below the 13% threshold some analysts reference as a stronger comfort zone. The ratio is sufficient to sustain dividends without capital strain, but leaves less room for buybacks or unexpected credit losses than a higher buffer would provide.
The analytical tension at the centre of ANZ’s H1 2026 result is straightforward. Cost reduction was the dominant profit driver. Revenue grew just 3% to $11.2 billion. The share price reaction on results day reflected a market that wants more than efficiency.
For income investors, the position is clear: a 4.58% trailing yield, 75% franked, with a consistent 83-cent payout that currently leads the Big Four. For growth-oriented investors, the gap between ANZ’s current price near $36 and the A$43.00 analyst price target (Buy) will depend on whether revenue momentum can match cost discipline in the second half.
The efficiency programme has delivered. The revenue case is still being built.
Investors exploring whether ANZ’s 4.58% trailing yield genuinely outperforms alternatives on an after-tax basis will find our full explainer on ASX bank dividends versus term deposits, which walks through the franking credit calculations, payout ratio constraints, and investor tax bracket scenarios that determine whether bank income beats the current 5.00-5.10% term deposit rates available from major lenders.
This article is for informational purposes only and should not be considered financial advice. Investors should conduct their own research and consult with financial professionals before making investment decisions. Past performance does not guarantee future results.
ANZ's trailing dividend yield is 4.58%, based on an 83-cent interim dividend and a share price of $36.29 as of 1 May 2026, making it the highest yield among Australia's Big Four banks.
ANZ's ex-dividend date for the H1 2026 interim dividend is 11 May 2026, with the Dividend Reinvestment Plan election deadline on 13 May 2026 and payment scheduled for 1 July 2026.
ANZ declared an interim dividend of 83 cents per share for the first half of 2026, unchanged from the level maintained since July 2024, and franked at 75%, up from 70% on both 2025 dividends.
ANZ shares fell approximately 1% on results day because much of the profit optimism had already been priced in following the strong Q1 2026 update, and statutory profit came in slightly below the analyst consensus estimate of approximately $3.73 billion.
ANZ's payout ratio sits above its own stated target range, which is a risk factor for income investors, though the bank's CET1 capital ratio of 12.39% provides sufficient buffer to sustain the current 83-cent dividend without immediate capital strain.