KOSPI Drops 10% as Crowded AI Trade Unwinds Across Global Markets
3 hrs ago

Coles Group, a supermarket chain with predictable cashflows and a century of operating history, surged 16% in three days following its August 2025 results. Commonwealth Bank delivered back-to-back 50% annual share price returns despite earnings per share barely moving. These are not the dynamics of a stable, fundamentally driven market. They are symptoms of something structural, and the evidence now suggests passive investing is reshaping how ASX prices are set.
Vertium Asset Management published research in April 2026 documenting this shift as measurable and accelerating. The data supporting that assessment is hard to dismiss: ASX 200 volatility rose approximately 60% year-to-date as of 10 April 2026, SMSF trustees are directing an average 12% of their portfolios into passive ETFs, and Australian ETF assets under management have reached approximately A$200 billion. What follows is an analysis of what is actually driving the new volatility regime, why traditional fundamental analysis is losing its grip on short-term price action, and what Australian investors managing their own portfolios need to reconsider about how markets now clear.
Coles Group moved 8.5% in a single session following its FY25 results, then 16% over three days. Six months later, H1 FY26 results triggered a 7.3% single-session decline. These are not the price swings of a speculative small-cap explorer. This is a $20 billion supermarket operator.
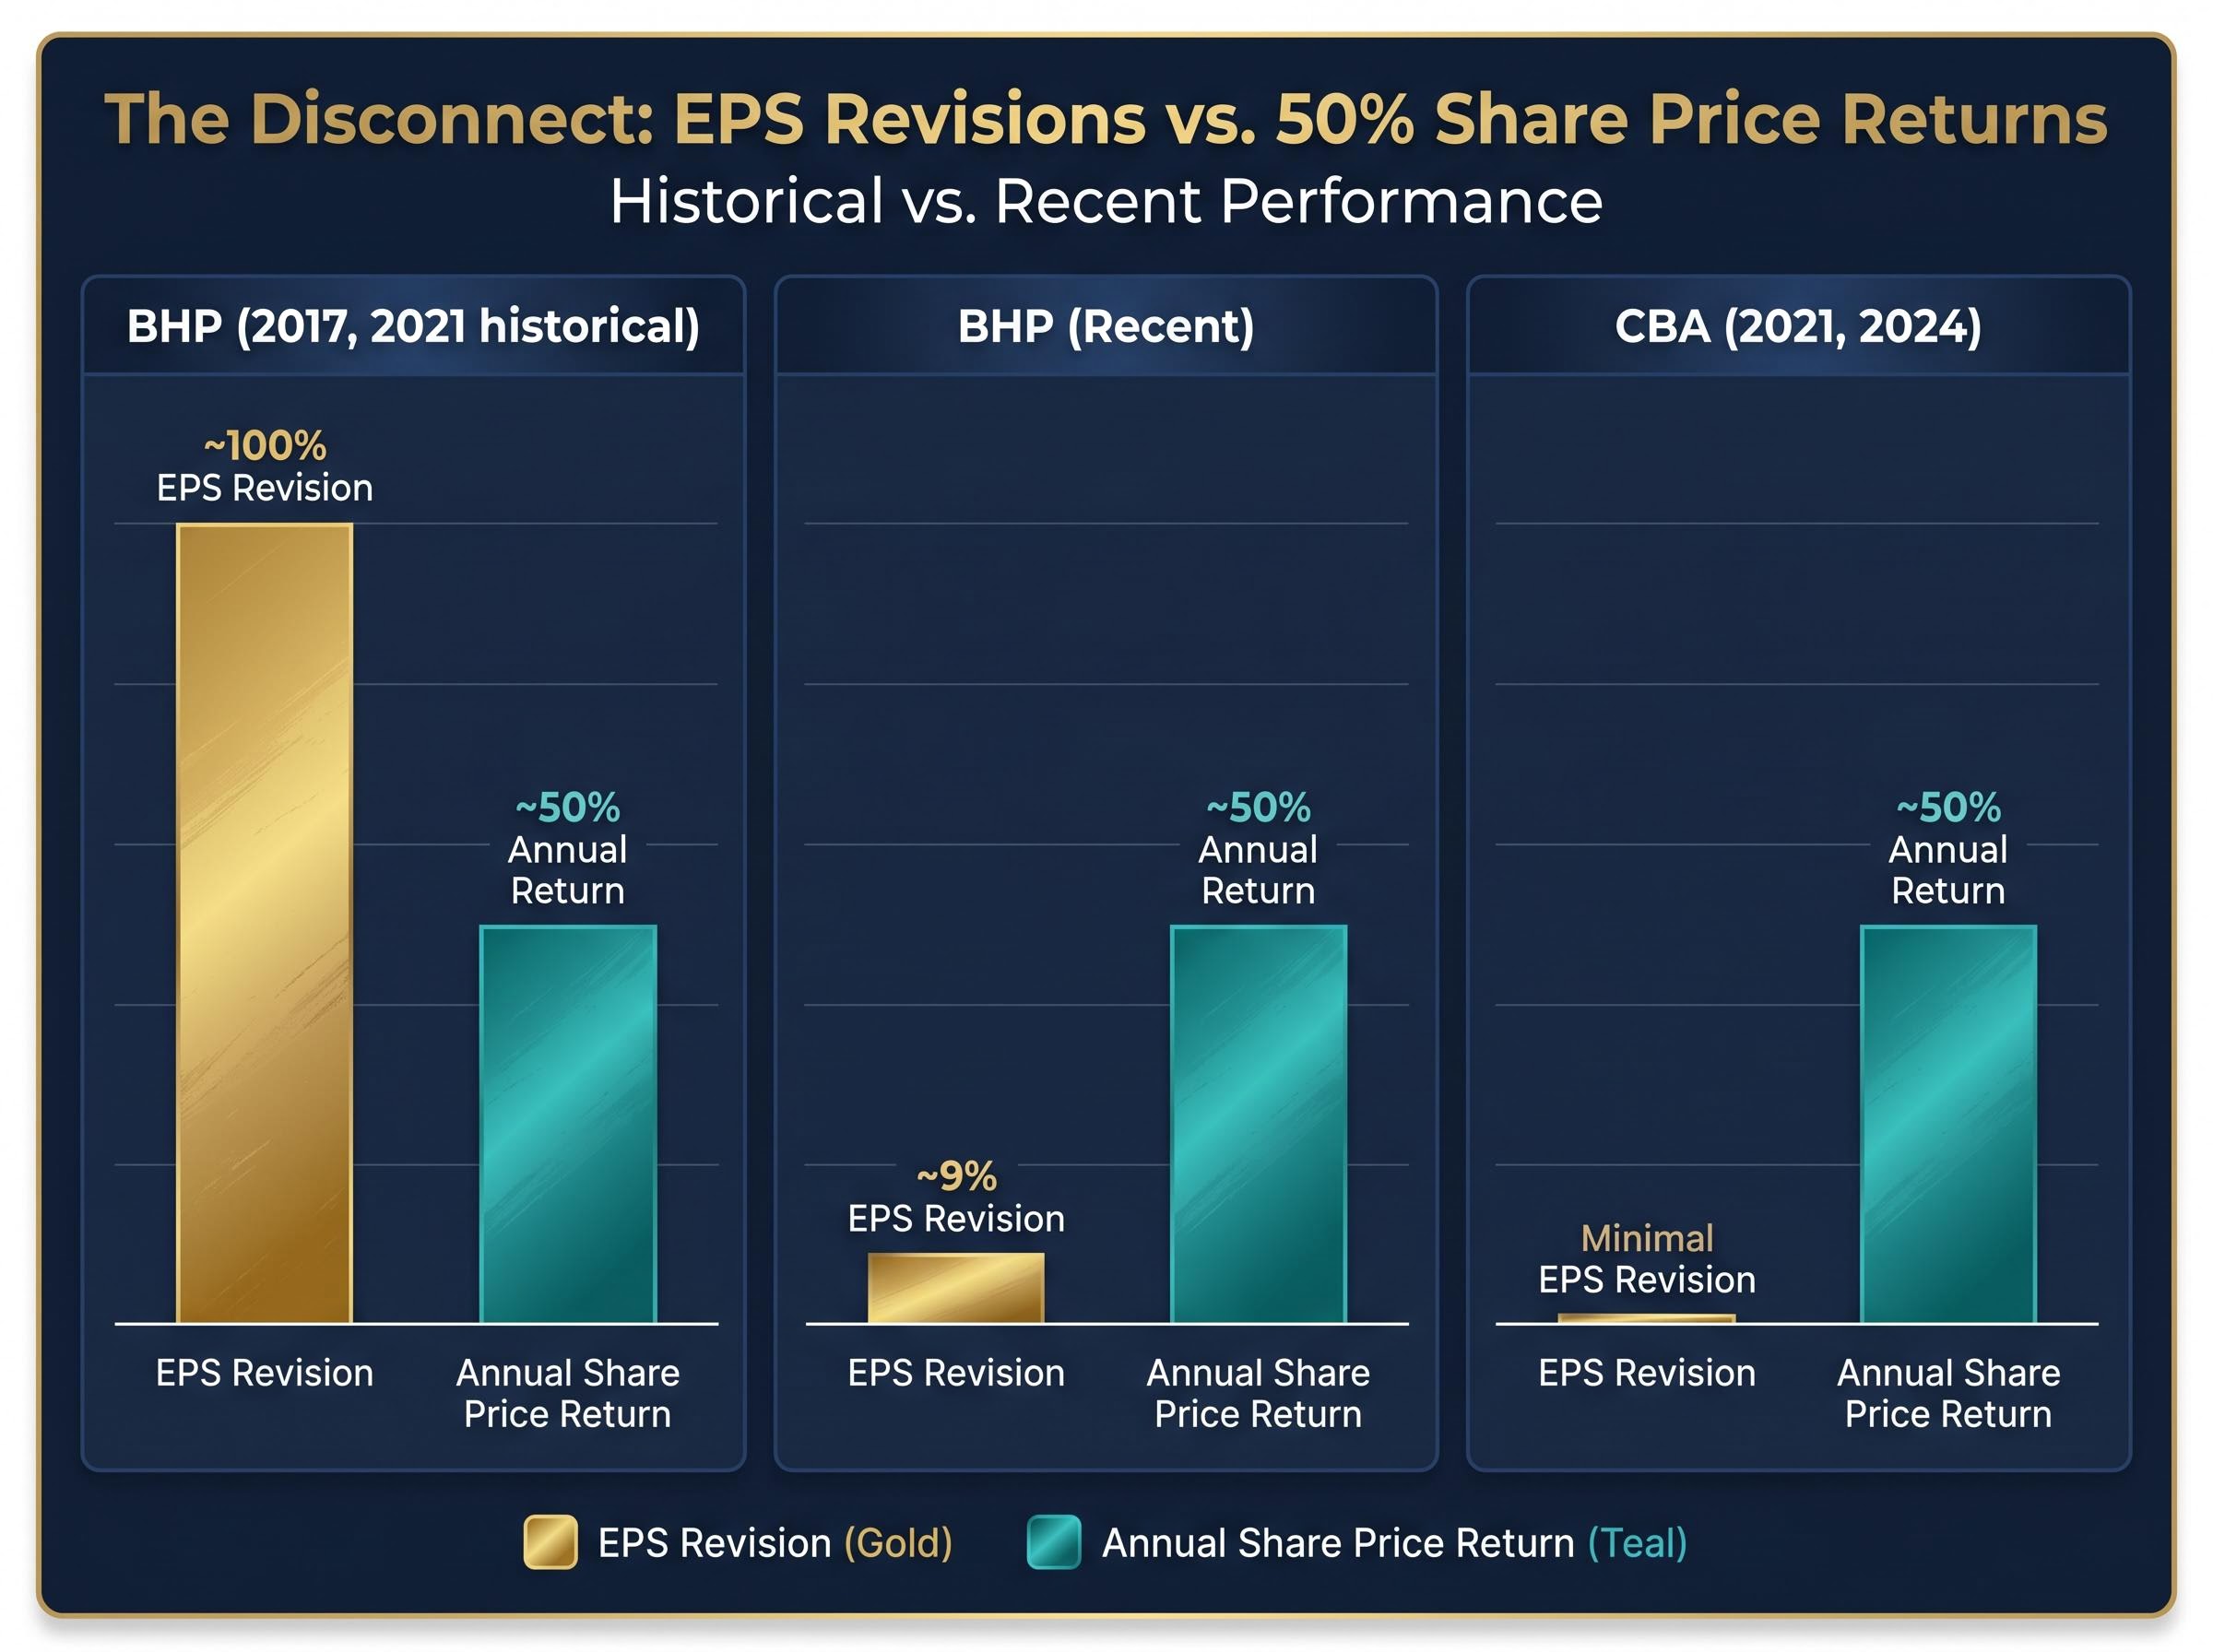
The pattern extends well beyond groceries. Commonwealth Bank delivered approximately 50% annual returns in both 2021 and 2024, yet EPS revisions over those periods were modest. Historically, generating that kind of share price performance required far larger earnings movements. BHP, for instance, needed roughly 100% EPS revisions in 2017 and 2021 to produce 50% annual returns. More recently, a 9% EPS revision generated equivalent performance.
| Company | Period | EPS Revision | Annual Share Price Return |
|---|---|---|---|
| CBA | 2021, 2024 | Minimal | ~50% |
| BHP | 2017, 2021 (historical) | ~100% | ~50% |
| BHP | Recent | ~9% | ~50% |
Vertium’s assessment is direct.
“Share price swings have become sharper and less connected to underlying fundamentals than at any prior point in market history.”
Australian investors who treat blue-chip holdings as low-risk portfolio anchors need to recognise that the volatility profile of these stocks has changed, regardless of how stable the underlying businesses remain.
The scale of the shift in Australian markets is now quantifiable. ETF assets under management reached approximately A$200 billion by March 2026. Net passive ETF inflows totalled A$15 billion during 2025 alone, according to the Morningstar Australia ETF Report Q1 2026. SMSF passive ETF allocations averaged 12% of portfolios in 2025, reflecting a structural increase in index-based demand among self-managed fund trustees.
The Morningstar Australia ETF Report covering Q1 2026 recorded net passive ETF inflows of A$15 billion across 2025, a figure that reflects the sustained pace of capital rotation from active mandates into index vehicles across both retail and institutional segments of the Australian market.
Those numbers matter because of what they displace. Every dollar flowing into a passive vehicle is a dollar that buys and sells based on index composition and market capitalisation weighting rather than valuation. As valuation-sensitive active managers lose market share, the corrective mechanism that historically anchored prices near fair value weakens. Passive vehicles do not assess whether a stock is expensive or cheap. They simply buy what the index tells them to buy, and sell what it tells them to sell.
Index fund concentration is not a risk confined to Wall Street: the same cap-weighted mechanics that allowed five US mega-cap stocks to drive over 70% of Q1 2026 market losses operate identically in the ASX 200, where the top ten holdings represent a disproportionate share of every passive dollar invested domestically.
The dynamic compounds over time through a cycle that Vertium characterises as self-reinforcing:
Each stage feeds the next. Greater passive inflows generate wider dispersion, which generates worse active outcomes on average, which drives further passive adoption. The cycle does not require a catalyst to continue; it only requires the flow differential to persist.
If passive vehicles do not set prices on the basis of valuation, the question becomes: who does? Vertium’s research identifies the answer as multi-manager hedge funds (known as pod shops) and quantitative funds, entities that operate primarily on momentum and earnings revision signals rather than fundamental valuation.
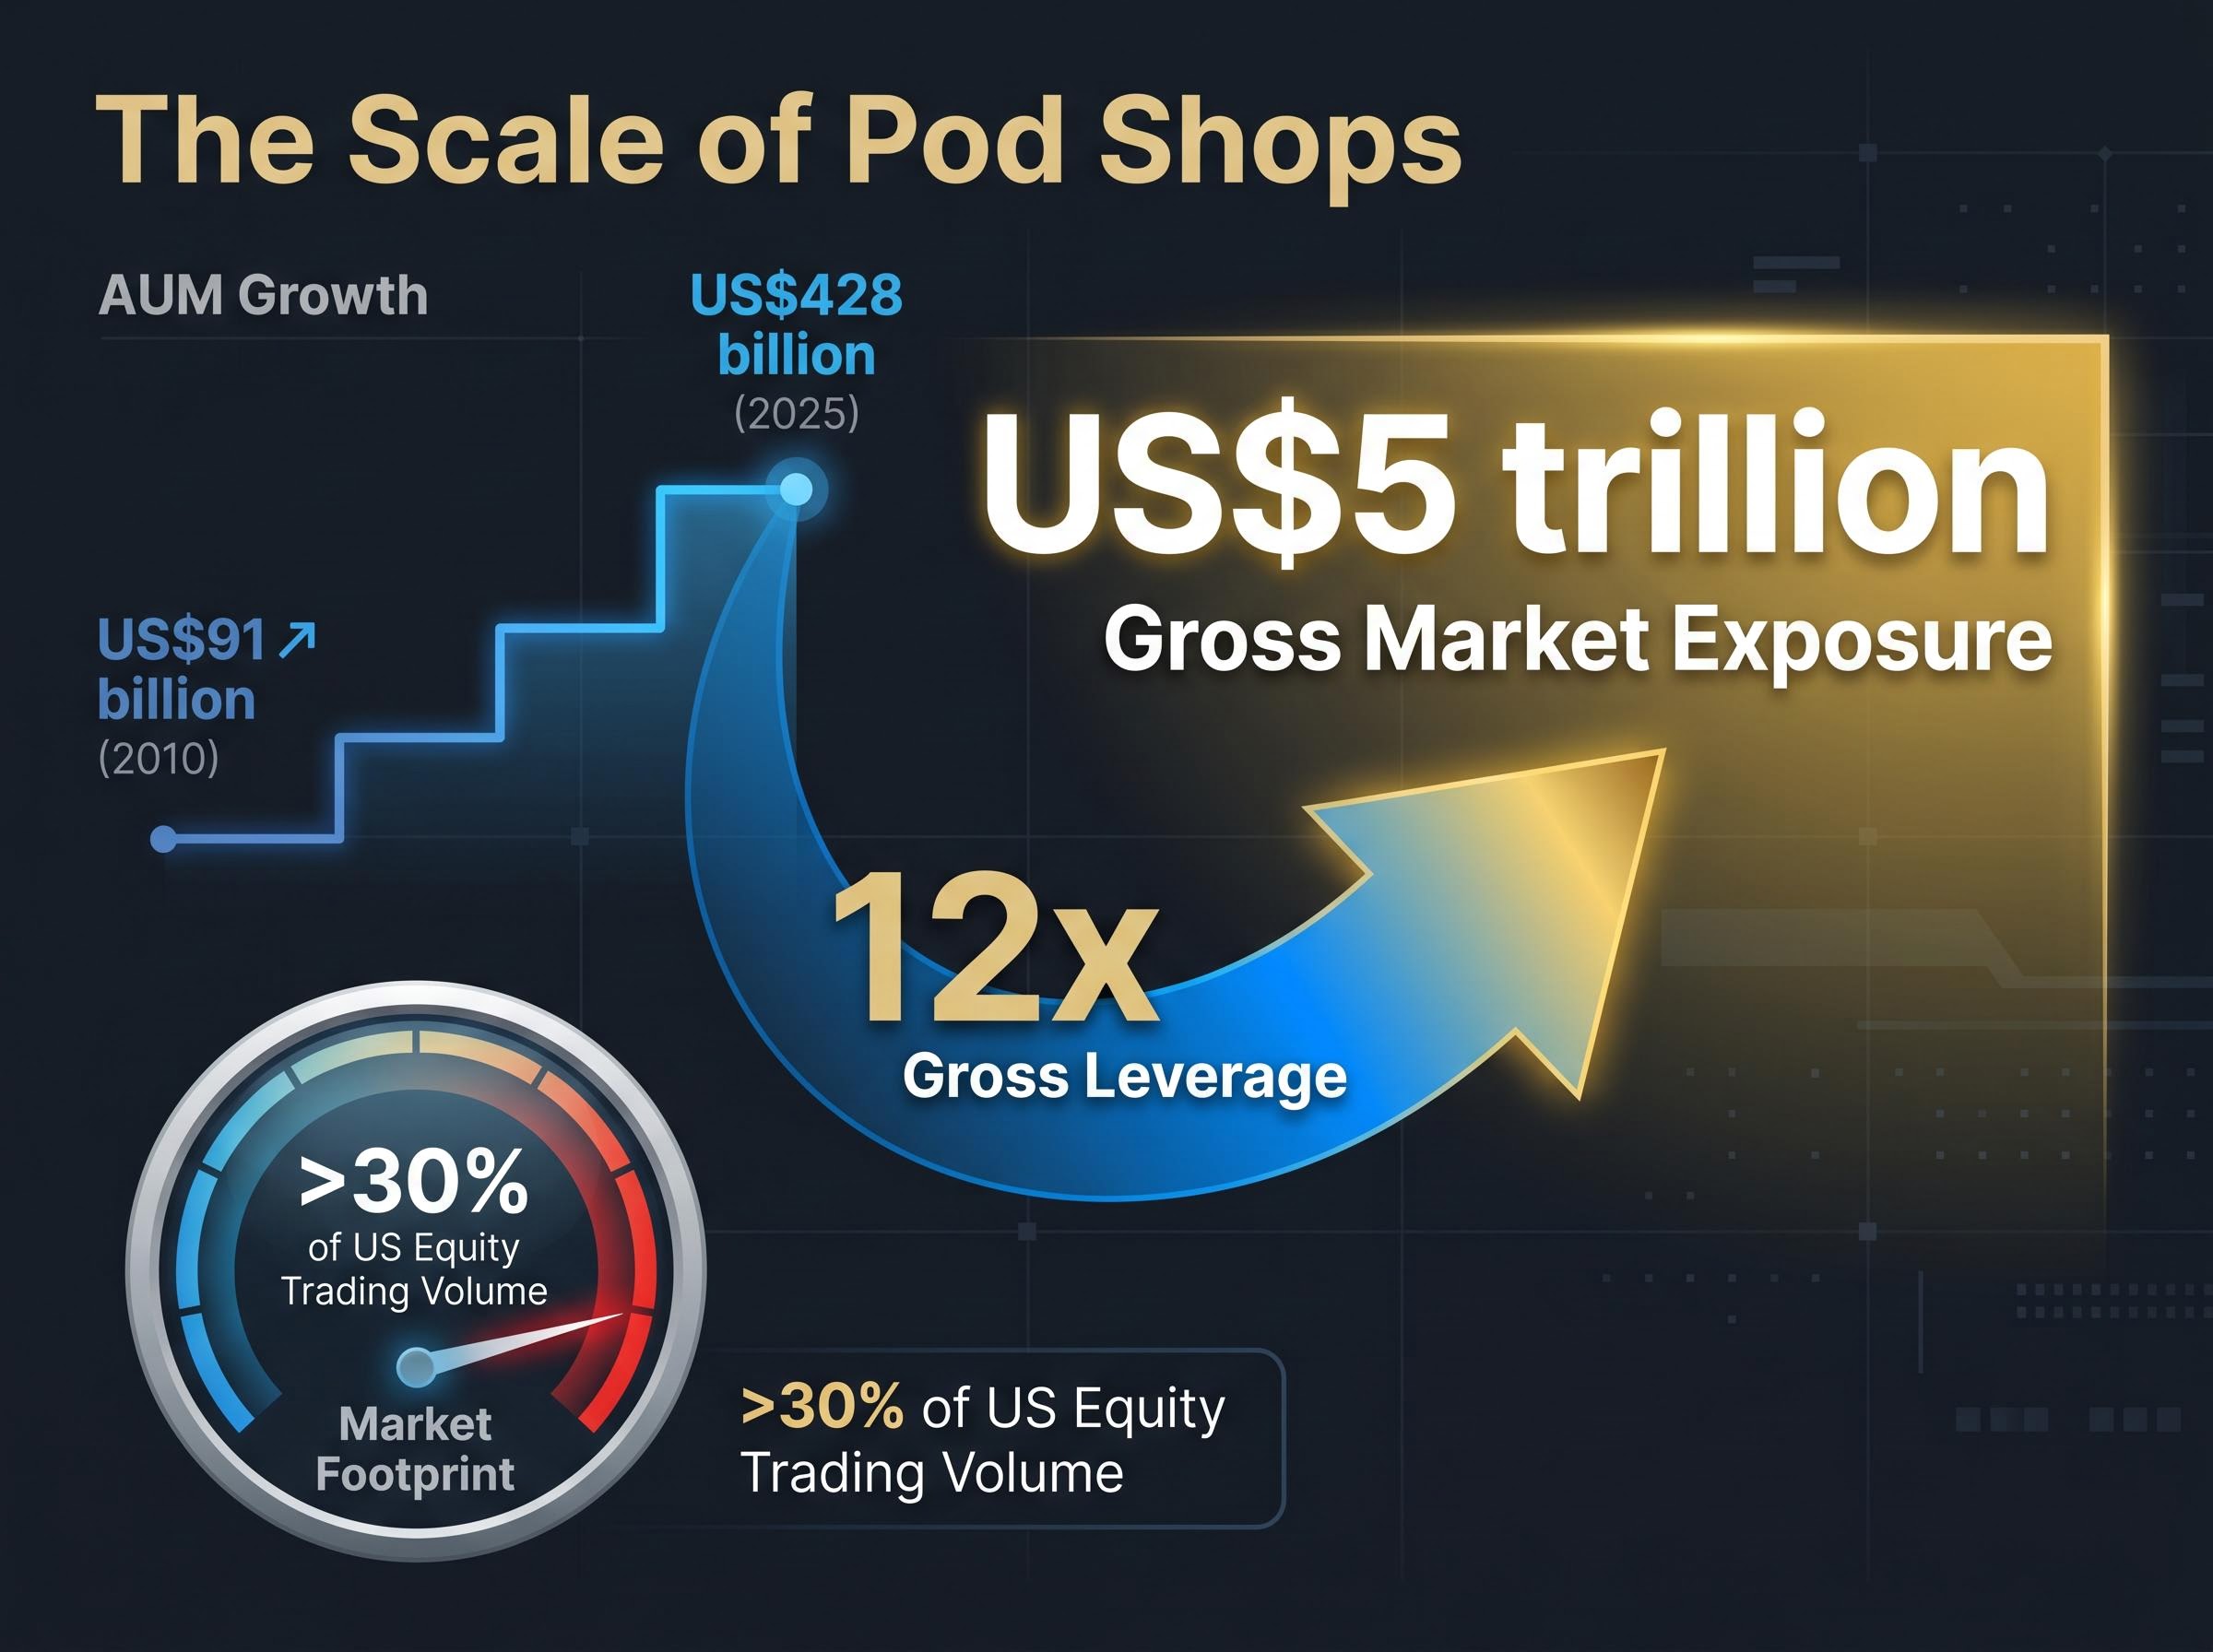
The scale of their influence is disproportionate to their headline assets. Pod shop assets under management reached US$428 billion in 2025, up from US$91 billion in 2010, according to Goldman Sachs data. Gross leverage sits at approximately 12x, implying roughly US$5 trillion in gross market exposure, according to the US Office of Financial Research. Pod shops account for more than 30% of total US equity trading volume. Quant funds captured over 70% of all net hedge fund inflows in 2025.
The firms executing these moves operate through high frequency trading strategies built on co-located servers, custom execution platforms, and capital bases large enough to move clearing prices at the precise moment a fundamental catalyst materialises, long before discretionary managers can respond.
The amplification dynamic works as follows. When a fundamental catalyst emerges, pod shops move first at scale with leverage. Quant funds detect the resulting price momentum and amplify the initial movement at speeds no discretionary manager can match. Three characteristics distinguish this price-setting behaviour from traditional active management:
“Asset prices now respond more to a given dollar amount of net buying or selling than at any previous point in market history.” — Vertium Asset Management, April 2026
Understanding this explains why even a well-researched position can move sharply against an investor’s thesis for reasons entirely unrelated to the business.
The previous three sections describe a market where passive flows dominate capital allocation, and leveraged momentum traders set clearing prices. The natural response is to question whether fundamental analysis retains any value at all. It does, but its role has narrowed.
A factor attribution framework attributed to Stan Druckenmiller provides a useful lens: approximately 50% of any individual stock’s price movement reflects broader market direction, approximately 30% reflects industry group dynamics, and only approximately 20% is stock-specific. Factor attribution, in this context, refers to the breakdown of what actually drives a stock’s price movement, separating market-wide forces from sector trends and company-specific factors.
| Factor Driver | Approximate Contribution | Managed by Stock Pickers? |
|---|---|---|
| Broad market direction | ~50% | No |
| Industry/sector dynamics | ~30% | Partially |
| Stock-specific alpha | ~20% | Yes |
Traditional active managers who focus exclusively on stock selection are addressing only the 20% component while leaving 80% of price drivers unmanaged. The ASX provides live illustrations. Telstra reached a near all-time-high PE ratio after avoiding earnings downgrades since 2020, while CSL reached an all-time-low PE ratio following a series of earnings downgrades. Both cases reflect mechanical amplification by passive and momentum flows, applying equally across sectors.
Fundamental analysis can still reliably:
What it can no longer do reliably is time short-term price moves or predict the magnitude of price reactions to results. That distinction matters for every Australian investor calibrating expectations.
This is not a fringe concern debated only among hedge fund managers. Australia’s most significant financial institutions are monitoring these dynamics formally.
The RBA Financial Stability Review March 2026 identifies household exposure via index funds and ETFs as a systemic amplifier, noting that concentration in passive global equity vehicles creates conditions for disorderly price adjustments that can spill over into Australian markets during periods of stress.
The Reserve Bank of Australia’s Financial Stability Review (March 2026) documented three specific concerns related to passive investing:
AustralianSuper, Australia’s largest superannuation fund, reinforced the message in its April 2026 quarterly update. The fund’s Balanced option returned 8.26% for the 12 months to March 2026, and management explicitly credited active management and diversification into unlisted assets for cushioning the impact of March volatility.
AustralianSuper cited active management and diversification, including unlisted assets, as the key buffers against March 2026 volatility, which the fund attributed in part to passive rebalancing mechanics.
The ASX 200 declined approximately 7.8% end-to-end across February to March 2026, with a 9.1% peak-to-trough intra-month drawdown. Within that period, individual stock moves illustrated the passive amplification dynamic in real time. BHP dropped 7.2% in a single session on 5 March 2026, a move attributed to geopolitical oil price spikes amplified by passive fund rebalancing rather than company-specific news. CBA swung 5.8% in a single session on 15 February 2026, driven by index fund flows rather than fundamentals.
These are not theoretical risks. They materialised in Australian equity markets this year, and the RBA has formally acknowledged the structural vulnerabilities that produced them.
The structural shift described in this analysis does not invalidate equity investing. It does, however, require three specific recalibrations.
The current structure also creates legitimate opportunities:
The dominance of passive investing and the rise of pod shops and quant funds as price-setters is not a cyclical aberration. It is a structural change with documented consequences in ASX price data, in the RBA’s regulatory assessments, and in the performance commentary of Australia’s largest superannuation fund.
Two practical takeaways apply to every Australian investor: recalibrate volatility expectations for all equity holdings including blue chips, and extend the timeframe over which fundamental analysis is expected to translate into price movement. Both Schroders and Vertium argue that the current high-volatility, high-dispersion environment is precisely the condition in which genuine active management skill becomes more valuable.
The question for SMSF trustees and retail investors is whether their current portfolio construction and risk assumptions were built for the market structure that exists today, or the one that existed before 2020.
Investors who want to ground the recalibration argument in a longer historical context will find our full explainer on long-term investment strategies, which draws on 150 years of S&P 500 return data, covers the compounding mechanics of dividend reinvestment across different account structures, and examines how index ETF costs interact with after-tax returns inside superannuation.
This article is for informational purposes only and should not be considered financial advice. Investors should conduct their own research and consult with financial professionals before making investment decisions.
Past performance does not guarantee future results. Financial projections are subject to market conditions and various risk factors.
—
Passive investing has shifted ASX price discovery away from fundamental valuation, with index-tracking ETFs now holding approximately A$200 billion in assets and driving outsized price swings in blue-chip stocks like CBA and Coles that are disconnected from underlying earnings movements.
ASX 200 volatility rose approximately 60% year-to-date as of April 2026 because passive ETF flows and leveraged momentum traders (pod shops and quant funds) now dominate price-setting, meaning even stable businesses like Coles can move 8.5% in a single session on results day regardless of earnings quality.
SMSF trustees should adjust their volatility expectations upward for all equity holdings including blue chips, extend the timeframe over which they expect fundamental analysis to translate into price movement, and reconsider position sizes that were calibrated to the lower-volatility pre-2020 environment.
Pod shops are multi-manager hedge funds that operate primarily on momentum and earnings revision signals rather than fundamental valuation; with US$428 billion in assets and gross leverage of approximately 12x, they exert roughly US$5 trillion in gross market exposure and account for more than 30% of total US equity trading volume, amplifying price moves at speeds discretionary investors cannot match.
Fundamental analysis remains valuable for identifying long-term value and spotting earnings revision catalysts before momentum flows react, but it can no longer reliably time short-term price moves or predict the magnitude of price reactions to results, since only approximately 20% of a stock's price movement reflects company-specific factors.