KOSPI Drops 10% as Crowded AI Trade Unwinds Across Global Markets
12 hrs ago

Active income ETFs on the ASX carry average total ownership costs of 1.21% per year, more than four times the cost of VHY and more than thirteen times the cost of VAS. For investors chasing higher income, that cost gap compounds quietly in the background, eroding the very returns the products promise to enhance.
Income-focused investing remains one of the most popular strategies among Australian retail investors and self-managed super fund (SMSF) trustees, and for good reason. Australia’s dividend imputation system, the psychological comfort of regular cash flow, and the structural needs of retirees drawing down portfolios all make income a rational priority. The ASX now offers a wide range of income ETFs spanning passive high-yield indexes, actively managed dividend funds, dividend harvesting products, and covered call strategies. Each promises elevated income. Not all deliver it without a catch.
What follows is an explanation of how each major category of Australian income ETF works under the hood, why the high-income numbers can be misleading, and what the cost and performance data reveal about where income investors should focus their attention in 2026, including the newly launched HYLD and VIHY.
The draw of income investing in Australia is not simply behavioural preference. It is structural. Three features of the Australian market combine to make income strategies genuinely more attractive here than in most comparable economies.
Franking credit enhancement of after-tax yields is most pronounced for SMSF investors in pension phase, where the full imputation credit can be received as a refundable tax offset, meaning the effective yield on a 5.5% grossed-up domestic dividend can exceed what the headline distribution figure suggests by a meaningful margin.
These structural reasons explain why passive products like VHY, with a trailing 12-month distribution yield of 5.5% as at 31 March 2026 and high franking levels, have attracted billions in funds under management. They also explain the appeal of newer entrants like HYLD, which carries similar franking benefits, and the interest in VIHY, launched in March 2026, which offers international income diversification but without franking credits.
Vanguard and Investment Trends SMSF ETF research shows a growing share of self-managed super funds allocating to ETFs as a primary vehicle for income generation in retirement phase, with income yield and distribution frequency ranking among the top criteria trustees use when selecting funds.
The instinct to weight income is rational. The question is whether the products designed to maximise it actually deliver on a total return basis, or whether they introduce structural compromises that offset the income advantage.
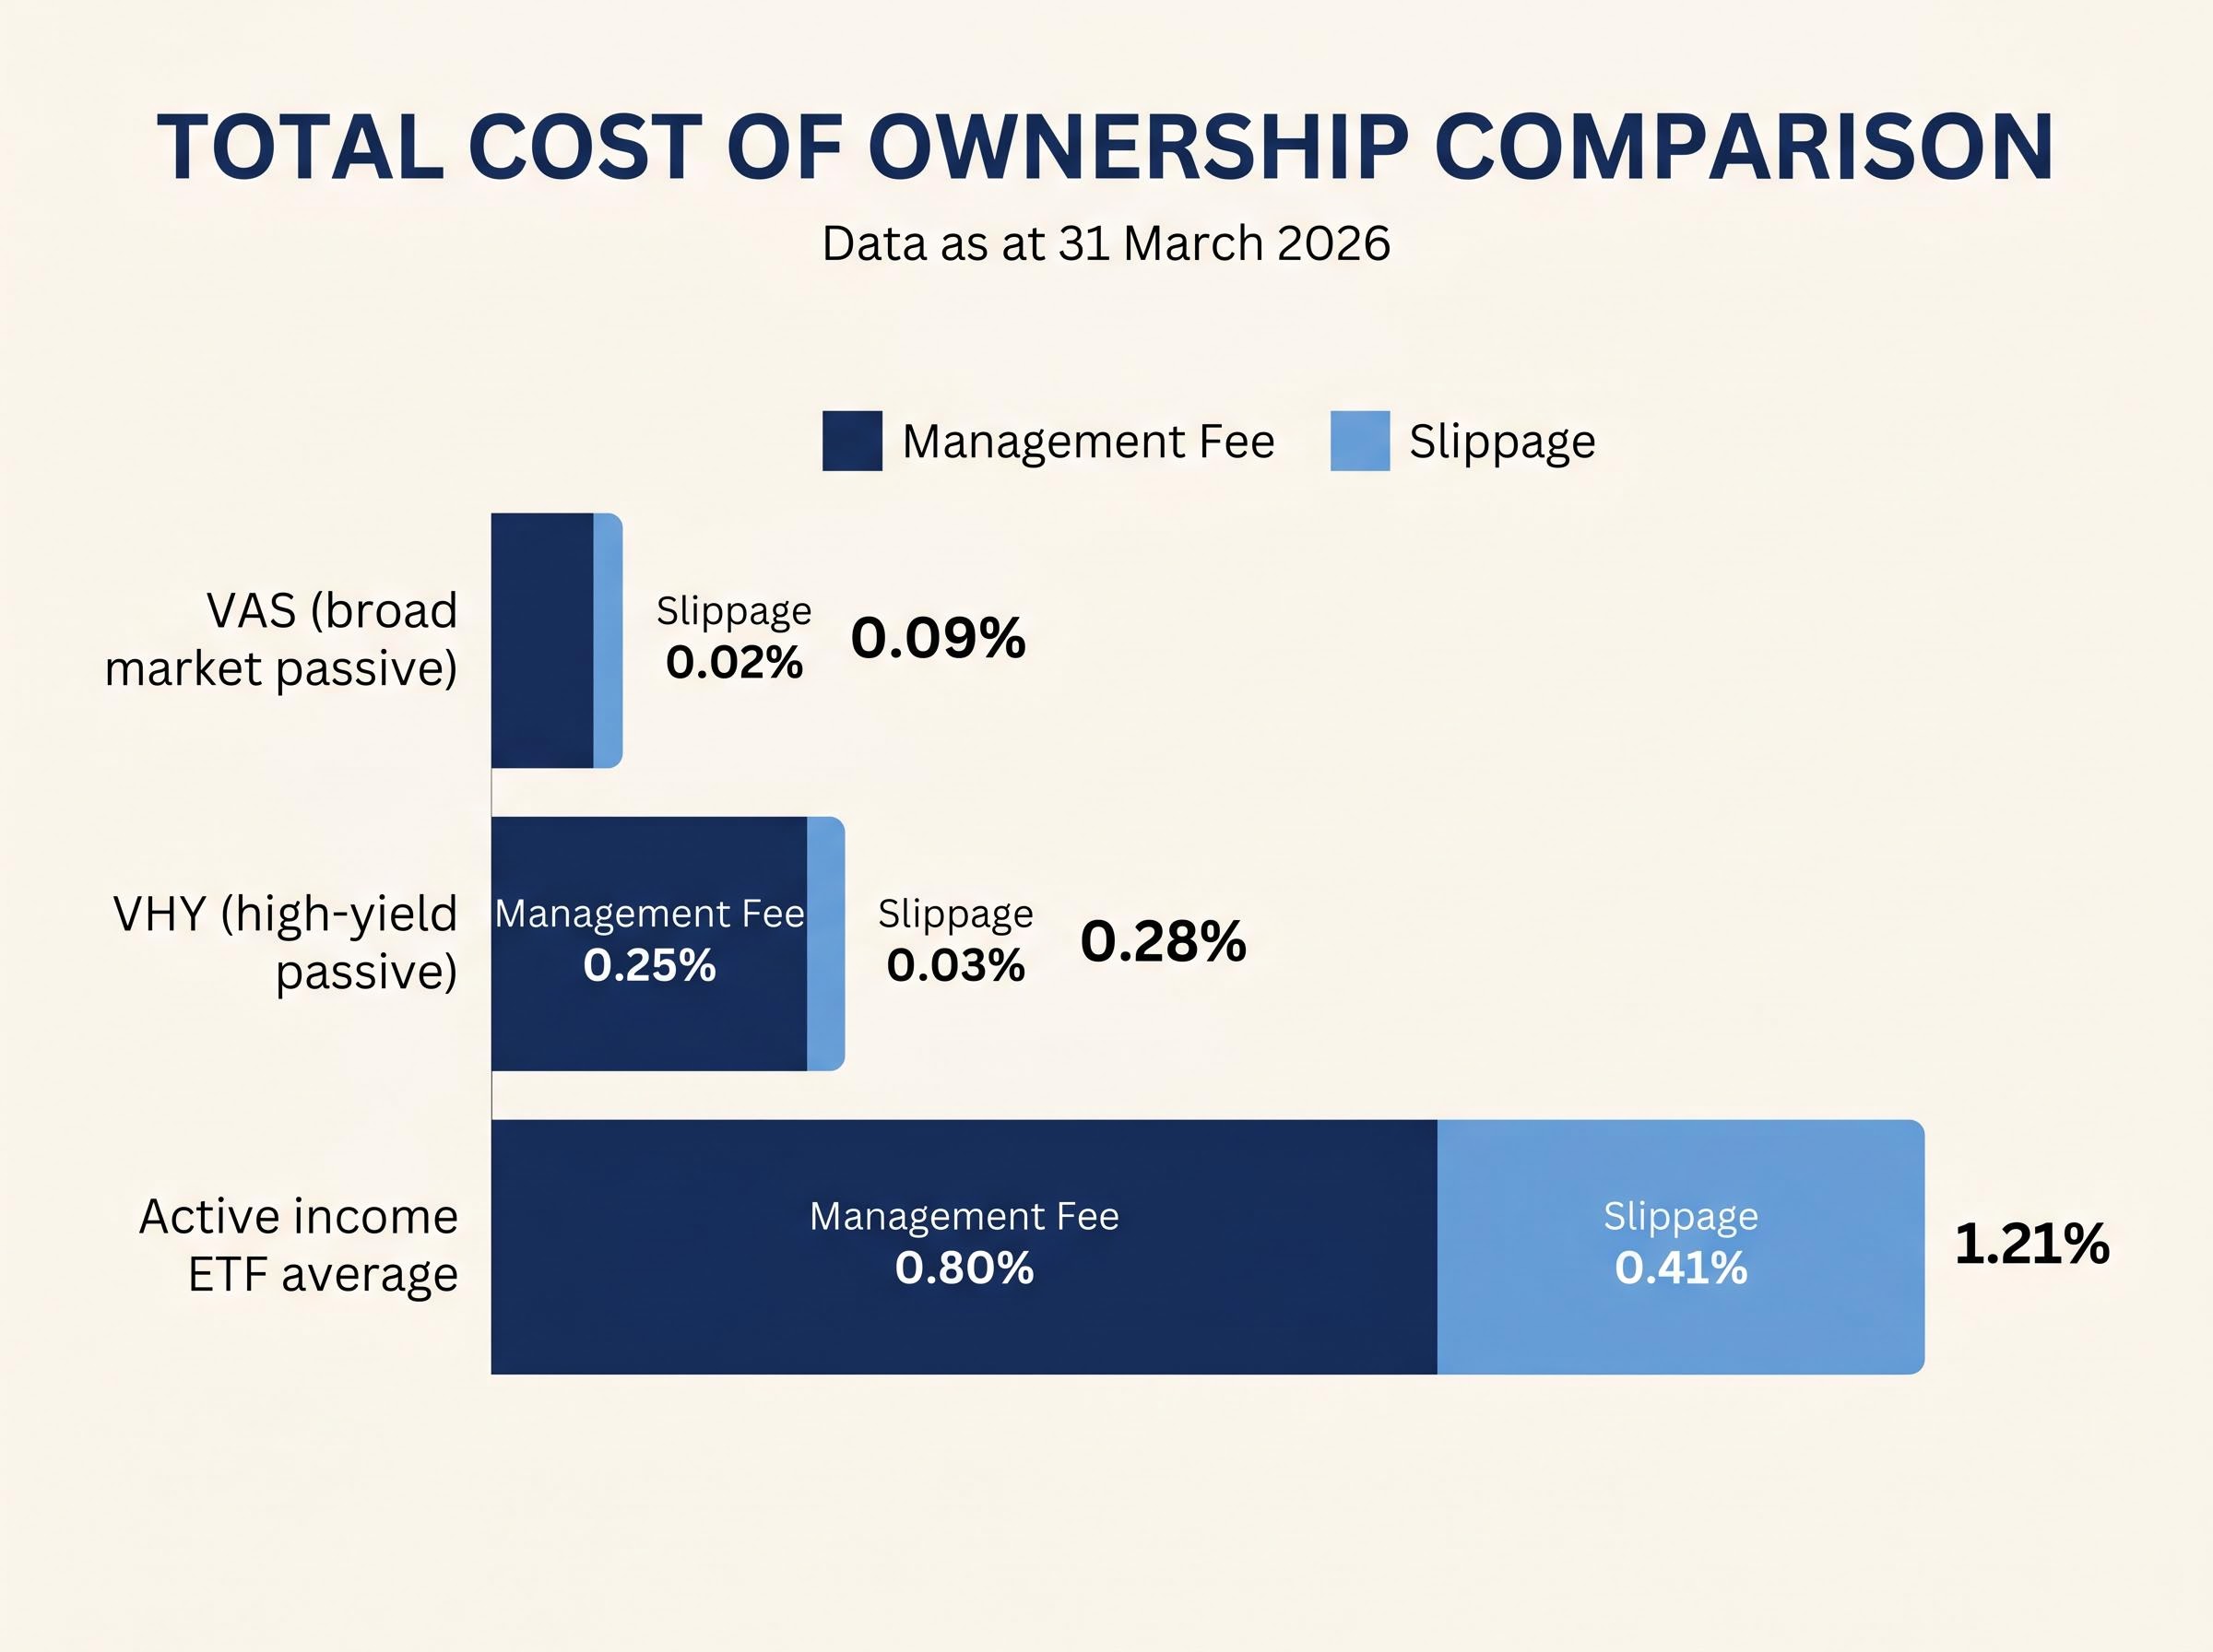
The headline management fee on an ETF tells only part of the cost story. Total cost of ownership, which combines the management fee with the slippage (the hidden cost of bid-ask spreads and tracking error), provides a more accurate picture of what investors actually pay.
The gap between passive and active income ETFs is substantial.
| Fund / Category | Management Fee | Slippage | Total Cost of Ownership |
|---|---|---|---|
| VAS (broad market passive) | 0.07% | 0.02% | 0.09% |
| VHY (high-yield passive) | 0.25% | 0.03% | 0.28% |
| Active income ETF average | 0.80% | 0.41% | 1.21% |
Active income ETFs on the ASX cost more than four times as much as VHY and more than thirteen times as much as VAS on a total cost of ownership basis, as at 31 March 2026.
The five active income ETFs remaining on the ASX, HVST, YMAX, EIGA, INIF, and SWTZ (following the delisting of EINC and RINC), carry these elevated costs for structural reasons. Active management requires portfolio managers, more frequent trading generates higher slippage, and in some cases derivatives expertise adds operational complexity. These costs are not discretionary; they are embedded in the strategy.
A 1% annual fee difference sounds abstract in isolation. Compounded across a decade on a $500,000 portfolio, however, it represents tens of thousands of dollars in foregone returns, capital that never compounds because it was consumed by fees before it could grow.
The mathematics of long-term compounding make fee differences far more damaging than they first appear: a 1% annual cost advantage on a $500,000 portfolio, sustained across twenty years at a 9% gross return, produces a terminal value difference exceeding $280,000, capital that was never consumed by fees and was free to grow.
Dividend harvesting sounds intuitive: buy shares that are about to pay a dividend, collect the distribution, then rotate into the next dividend-paying stock. The strategy aims to capture more dividends per dollar invested than a buy-and-hold approach.
The mechanics, however, reveal a structural limitation that is not immediately obvious.
The net effect is that the investor captures income but surrenders an equivalent amount of capital value. It is similar to a bank offering a higher interest rate while simultaneously reducing the depositor’s principal balance. The income statement looks attractive; the balance sheet tells a different story.
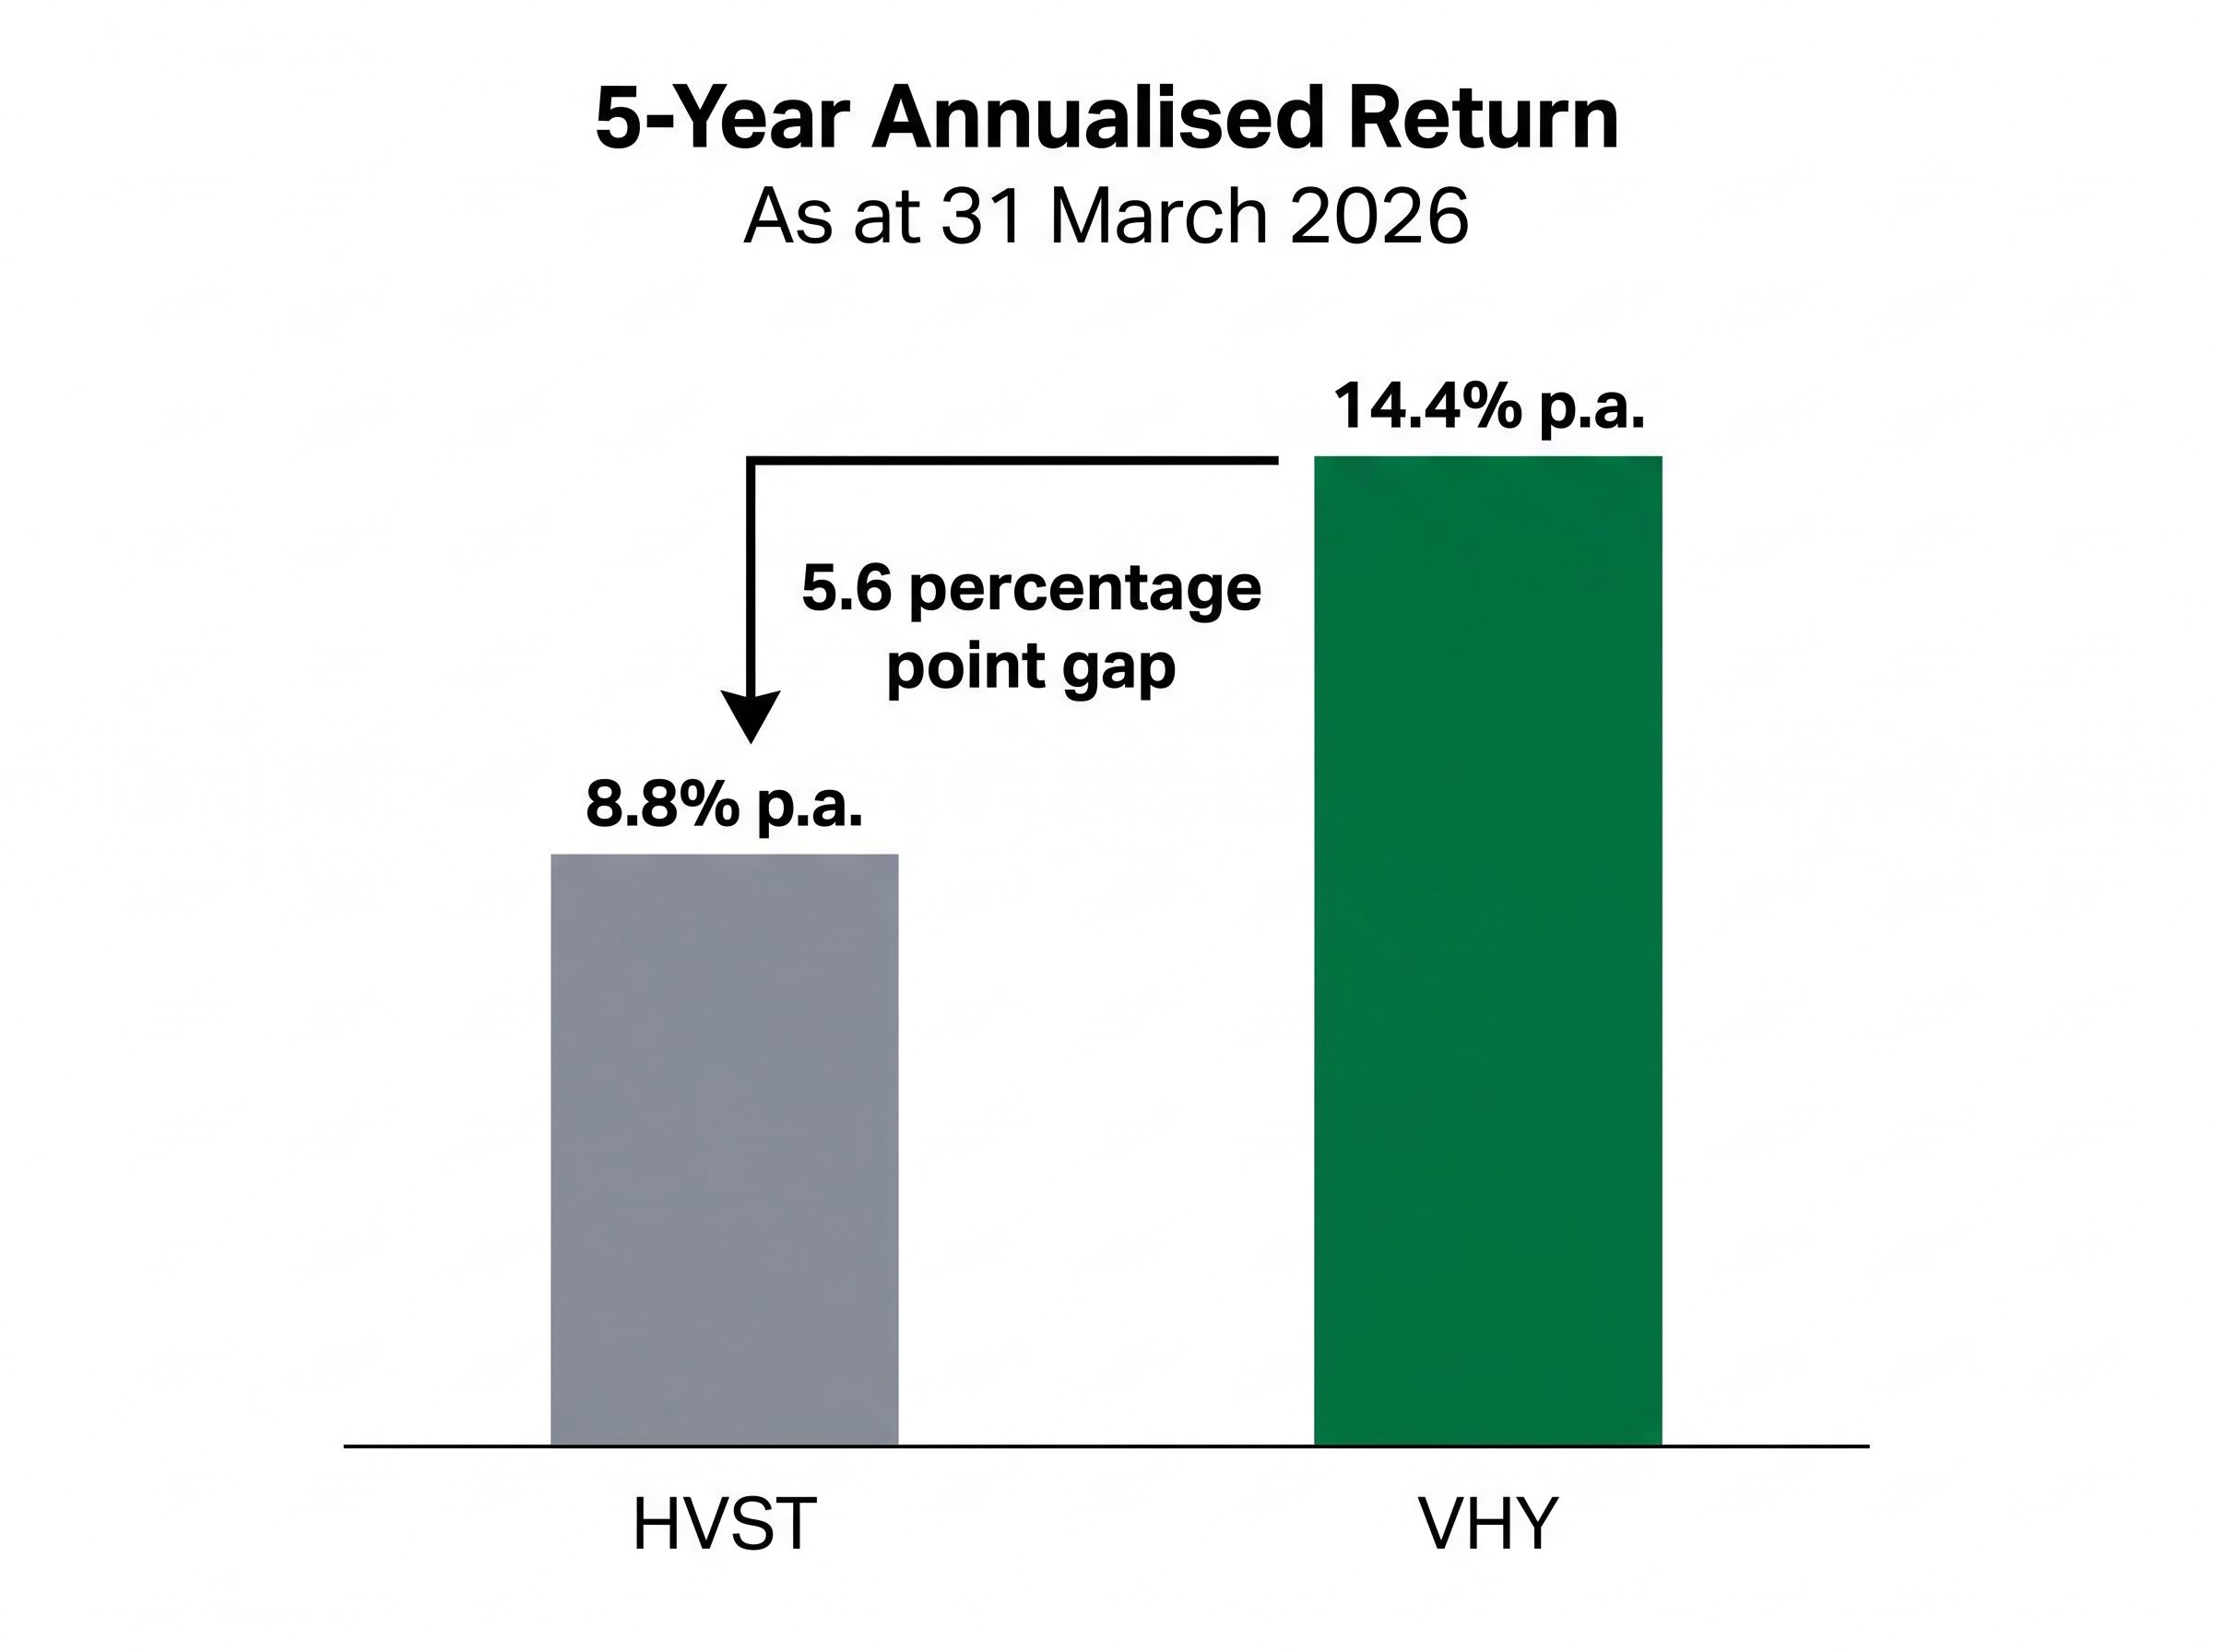
HVST, the primary ASX-listed dividend harvesting product, distributes income monthly and was rated the highest yield among income ETFs in 2026 comparisons. Its one-year return of 9.2% and three-year annualised return of 11.7% per annum appear competitive at first glance.
The longer-term comparison is more revealing. HVST’s five-year annualised return of 8.8% per annum, as at 31 March 2026, trails VHY’s five-year annualised return of 14.4% per annum over the same period. The funds have different risk profiles and construction methods, so the comparison is illustrative rather than definitive. Still, a 5.6 percentage point annualised gap over five years is significant enough to warrant scrutiny.
HVST underwent a strategy change in May 2022, removing its futures-based hedging component. That change altered the fund’s risk and return characteristics, meaning pre-2022 performance reflects a different product than the one investors hold today. Investors drawn to HVST’s elevated distribution yield should consider whether they may be receiving their own capital back as income, a distinction that matters greatly for long-term wealth accumulation.
A covered call strategy works by holding equities and simultaneously writing (selling) call options on those positions. The fund collects the option premium as additional income, boosting its distribution yield above what the underlying shares alone would generate.
YMAX, the primary ASX-listed covered call product, illustrates the appeal. Its 12-month gross distribution yield of 10.3% as at 31 March 2026 is nearly double VHY’s yield. It carries a management fee of 0.64% per annum, holds approximately 20 positions, and shifted to monthly distributions effective January 2026, a change designed to compete with dividend harvesting products on income frequency. Franking on the fund runs at 41.6%.
The trade-off, however, is structural and asymmetric.
This means covered call products perform best in sideways markets and underperform most in the conditions that generate the largest long-term returns: sustained equity rallies. Covered call products are available on the ASX across Australian, US (S&P 500), and Nasdaq 100 exposures, and the upside limitation applies to all of them.
SSRN research on covered call return trade-offs documents how the systematic surrender of upside participation through option writing produces a structural drag on total returns that income yield figures do not reflect, reinforcing why the strategy consistently underperforms in sustained equity rallies.
Stockspot has stated a preference for VHY over covered call products on the grounds that VHY can enhance dividend income without forfeiting capital growth potential.
The 10.3% yield on YMAX is real income. But the price of that income, the surrender of participation in the market’s strongest moves, does not appear in the yield figure. For investors with a long time horizon, that hidden cost can outweigh the visible income benefit.
For investors seeking income from Australian equities without the structural compromises of active management, dividend harvesting, or covered calls, two passive options now stand as the primary choices.
VHY is the established incumbent. It tracks an index of high-yielding Australian shares using forward yield estimates, holds approximately 79 positions, charges 0.25% per annum, and yields approximately 5.5%. Its five-year annualised total return of 14.4% per annum, as at 31 March 2026, reflects both income and capital growth. VHY’s scale is a meaningful advantage: approximately $7 billion in funds under management and an average daily traded value of $23.51 million provide liquidity that smaller funds cannot match. Distributions are paid quarterly.
HYLD, launched on 1 August 2025, takes a different approach. It tracks the S&P Australian Shares High Yield Index and holds approximately 50 positions, but applies quality screens designed to avoid dividend traps, filtering out companies with unsustainable payouts or excessive volatility. The management fee matches VHY at 0.25% per annum, but distributions are monthly, and the implied yield sits at approximately 4.3% at current prices. The fund’s five-year index performance of 13.13% per annum (pre-fees) suggests competitive long-term returns. AUM reached $84.18 million by April 2026, making it one of the most successful ETF launches of 2025.
Both HYLD and VHY appear in the Stockspot Themes and Topaz Income portfolio ranges. They match on cost while differing on construction: VHY offers broader diversification across more holdings, while HYLD’s quality screening aims to deliver a more resilient income stream by filtering out the weakest dividend payers.
| ETF | Fee | Yield | Income Profile | Holdings |
|---|---|---|---|---|
| VHY | 0.25% | ~5.5% | High franking; quarterly distributions | ~79 |
| HYLD | 0.25% | ~4.3% | High franking; monthly distributions | ~50 |
| VIHY | 0.30% | N/A (limited data) | No franking; quarterly distributions | N/A |
VIHY, launched on 24 March 2026, tracks the FTSE All-World ex Australia High Dividend Yield Index and provides exposure to international developed and emerging market equities. It is not a substitute for HYLD or VHY but a complement for investors seeking to diversify income sources beyond the ASX.
The key trade-off is the absence of franking credits. As an international fund, VIHY’s distributions carry no imputation benefits, which reduces the after-tax yield advantage that makes domestic income ETFs so attractive for SMSF investors and those in lower tax brackets. The management fee of 0.30% per annum is slightly higher than the domestic passive options. Limited post-launch performance data is available as of April 2026, making it too early to assess the fund’s real-world income delivery.
The single most useful lens for assessing any income ETF is total return: the combination of capital growth and income distributions measured together. Yield figures in isolation can make structurally compromised products appear more attractive than they are.
Through the total return lens, the three strategy categories covered in this article each reveal a distinct failure mode:
DVDY offers a cautionary example from the other direction: a one-year total return of -4.0% as at 31 March 2026 demonstrates how a product can deliver yield while destroying capital.
The practical implication is straightforward. Investors who want income should start with cost-efficient, quality-screened passive options and treat higher-yielding active or derivatives-based products as income enhancers rather than core holdings, if they use them at all. Total return, not headline yield, is the metric that determines whether an income strategy actually builds wealth.
This article is for informational purposes only and should not be considered financial advice. Investors should conduct their own research and consult with financial professionals before making investment decisions. Past performance does not guarantee future results.
Higher income yield does not equal higher total return. That distinction is the single most important principle this article has outlined, and it applies to every income ETF on the ASX.
The framework for evaluating income products rests on three questions. First, what is the total cost of ownership, not just the management fee? Second, what is the source of the income: genuine earnings yield, return of the investor’s own capital, or options premium collected at the cost of capped upside? Third, do franking credits apply to the specific product, and if so, how materially do they improve the after-tax outcome?
The current market offers income investors more cost-efficient choices than ever. Passive options like VHY and the newer HYLD now deliver quality-screened, low-cost income exposure that previously required active management fees to access. VIHY adds a geographic diversification layer for those willing to forgo franking credits.
Quality factor investing offers a structural alternative to pure income orientation for investors whose primary concern is capital preservation alongside yield: funds targeting high return on equity, low leverage, and stable earnings have historically outperformed during economic contractions, delivering a different risk-adjusted profile from high-yield screens that can overweight financially stretched dividend payers.
The opportunity for income investors in 2026 is not to chase the highest yield figure on a comparison table. It is to assess their existing income ETF holdings against the total return and cost frameworks outlined here, and to ensure the income they receive is genuinely additive rather than quietly borrowed from their own capital.
Investors wanting to apply the same cost framework to multi-asset diversified ETFs, where the active versus passive fee debate plays out across equities, fixed income, and real assets simultaneously, will find our dedicated guide to active versus passive ASX ETF fees covers the VanEck, Vanguard, and BetaShares diversified ranges with explicit cost-benefit analysis across each provider’s fee structure and asset class coverage.
Australian income ETFs are exchange-traded funds listed on the ASX that aim to deliver regular cash distributions to investors by holding high-yielding shares, actively managed dividend portfolios, or derivatives-based strategies such as covered calls. They range from low-cost passive index funds like VHY to active products like HVST and YMAX, each with different income sources, costs, and total return profiles.
Active income ETFs on the ASX carry an average total cost of ownership of 1.21% per year when management fees and trading slippage are combined, compared to 0.28% for VHY and just 0.09% for VAS, meaning active income ETF investors pay more than four times the cost of the leading passive high-yield option.
Covered call ETFs like YMAX offer elevated distribution yields, with YMAX delivering a 12-month gross distribution yield of 10.3% as at 31 March 2026, but the trade-off is a structural cap on upside participation; in sustained equity rallies, the fund cannot benefit from gains beyond the option strike price, which can significantly reduce long-term total returns.
Dividend harvesting strategies, as demonstrated by HVST, boost short-term income by rotating through ex-dividend dates, but share prices typically fall by approximately the dividend amount after the ex-dividend date, meaning capital is surrendered to fund the income. HVST's five-year annualised return of 8.8% per annum trails VHY's 14.4% per annum over the same period ending 31 March 2026.
VHY is a broad passive high-yield Australian ETF holding around 79 positions with a trailing 12-month yield of approximately 5.5% and quarterly distributions, while HYLD applies additional quality screens to around 50 positions, targets approximately 4.3% yield, and pays monthly distributions; both charge 0.25% per annum and carry high franking levels.