Crude Oil Surges Past $108 as Iran Strike Is Called Off
4 hrs ago

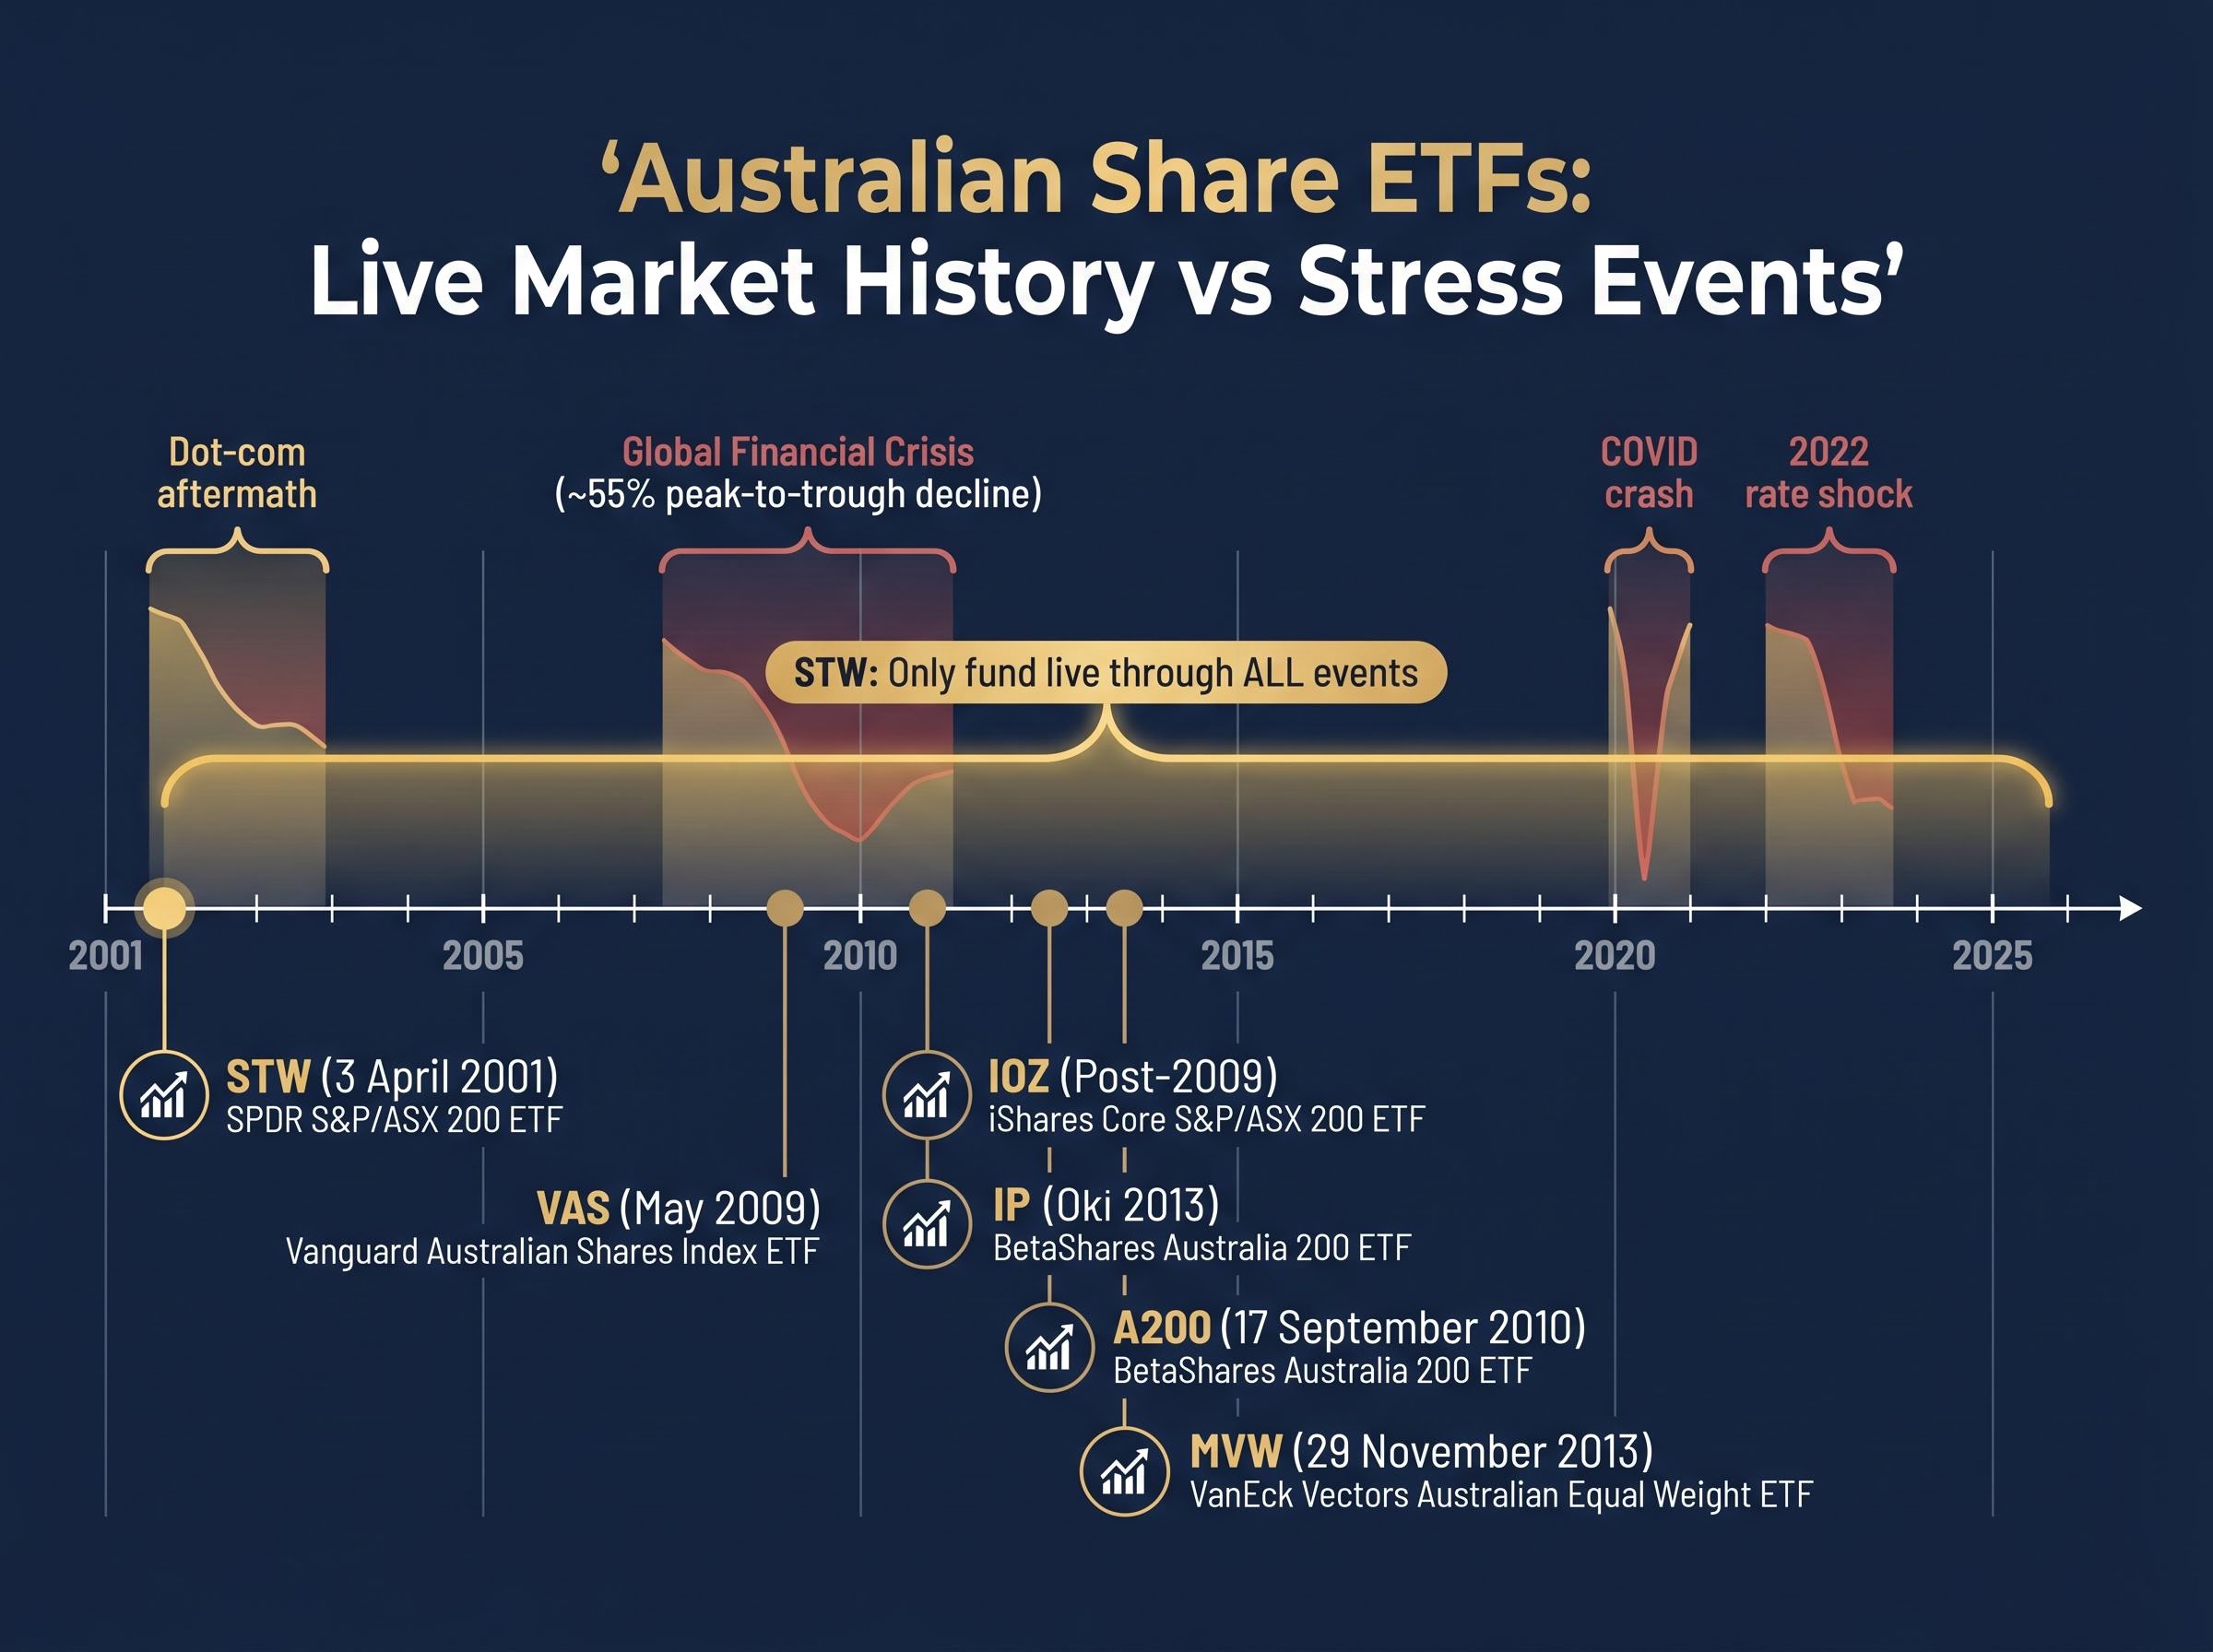
STW has been trading on the ASX since 3 April 2001. That gives it a live track record spanning two bear markets, a global pandemic crash, and multiple rate cycles. A200, by contrast, launched in 2010 and has never navigated a sustained period of rising rates from a near-zero base as a live fund. Both claim to deliver Australian share exposure. The difference in what their histories reveal is the subject most comparison articles skip.
As net inflows into Australian share ETFs reached $13.3 billion in the 12 months to December 2025, more capital is being allocated between VAS, STW, IOZ, A200, and MVW on the basis of fees and recent returns alone. That is a reasonable starting point, but an incomplete one. The age of a fund, and the history of the index it tracks, is an under-examined decision variable with real analytical consequences.
This article explains why index and ETF track record deserves more weight in the selection process than it typically receives, uses Australia’s five major share ETFs as a concrete case study, and helps investors understand what a long history reveals about fund behaviour and risk that fee tables and five-year return charts cannot.
STW commenced trading on 3 April 2001, making it the longest-running Australian share ETF on the market. VAS launched in May 2009, and IOZ shares a comparable index history through its S&P/ASX 200 benchmark. All three benefit from an underlying index with a track record stretching back more than two decades.
A200 launched on 17 September 2010, giving it approximately 15 years of index history as at 2026. MVW followed on 29 November 2013, offering roughly 12 years of live fund data.
The gap between these timelines is not cosmetic. It determines how much evidential history is available before an investor commits capital.
The S&P/ASX 200’s post-2001 record captures four distinct stress events: the dot-com aftermath, the Global Financial Crisis (an approximate 55% peak-to-trough decline), the COVID crash and its V-shaped recovery, and the 2022 rate-driven selloff.
An investor reviewing STW or VAS fund data can examine live ETF behaviour across at least two of those events. An investor examining A200‘s own fund history can only see the post-2010 environment, a period that, despite its volatility, did not include a GFC-scale drawdown.
| Fund | Index tracked | Launch date | Years of live history (2026) | Stress events in fund history |
|---|---|---|---|---|
| STW | S&P/ASX 200 | 3 April 2001 | ~25 | Dot-com aftermath, GFC, COVID, 2022 rate shock |
| VAS | S&P/ASX 300 | May 2009 | ~17 | COVID, 2022 rate shock |
| IOZ | S&P/ASX 200 | Post-2009 | ~15-16 | COVID, 2022 rate shock |
| A200 | Solactive ASX 200 | 17 September 2010 | ~15 | COVID, 2022 rate shock |
| MVW | MVIS Australia Equal Weight | 29 November 2013 | ~12 | COVID, 2022 rate shock |
Five-year annualised returns, the standard metric investors use to compare these funds, are entirely contained within a single market phase. They cannot reveal how a fund or its index behaves during a genuine crisis.
The GFC-era data embedded in STW‘s history allows investors to examine real drawdown magnitude, recovery duration, and dividend sustainability during a severe downturn. None of that appears on a five-year chart ending in 2026.
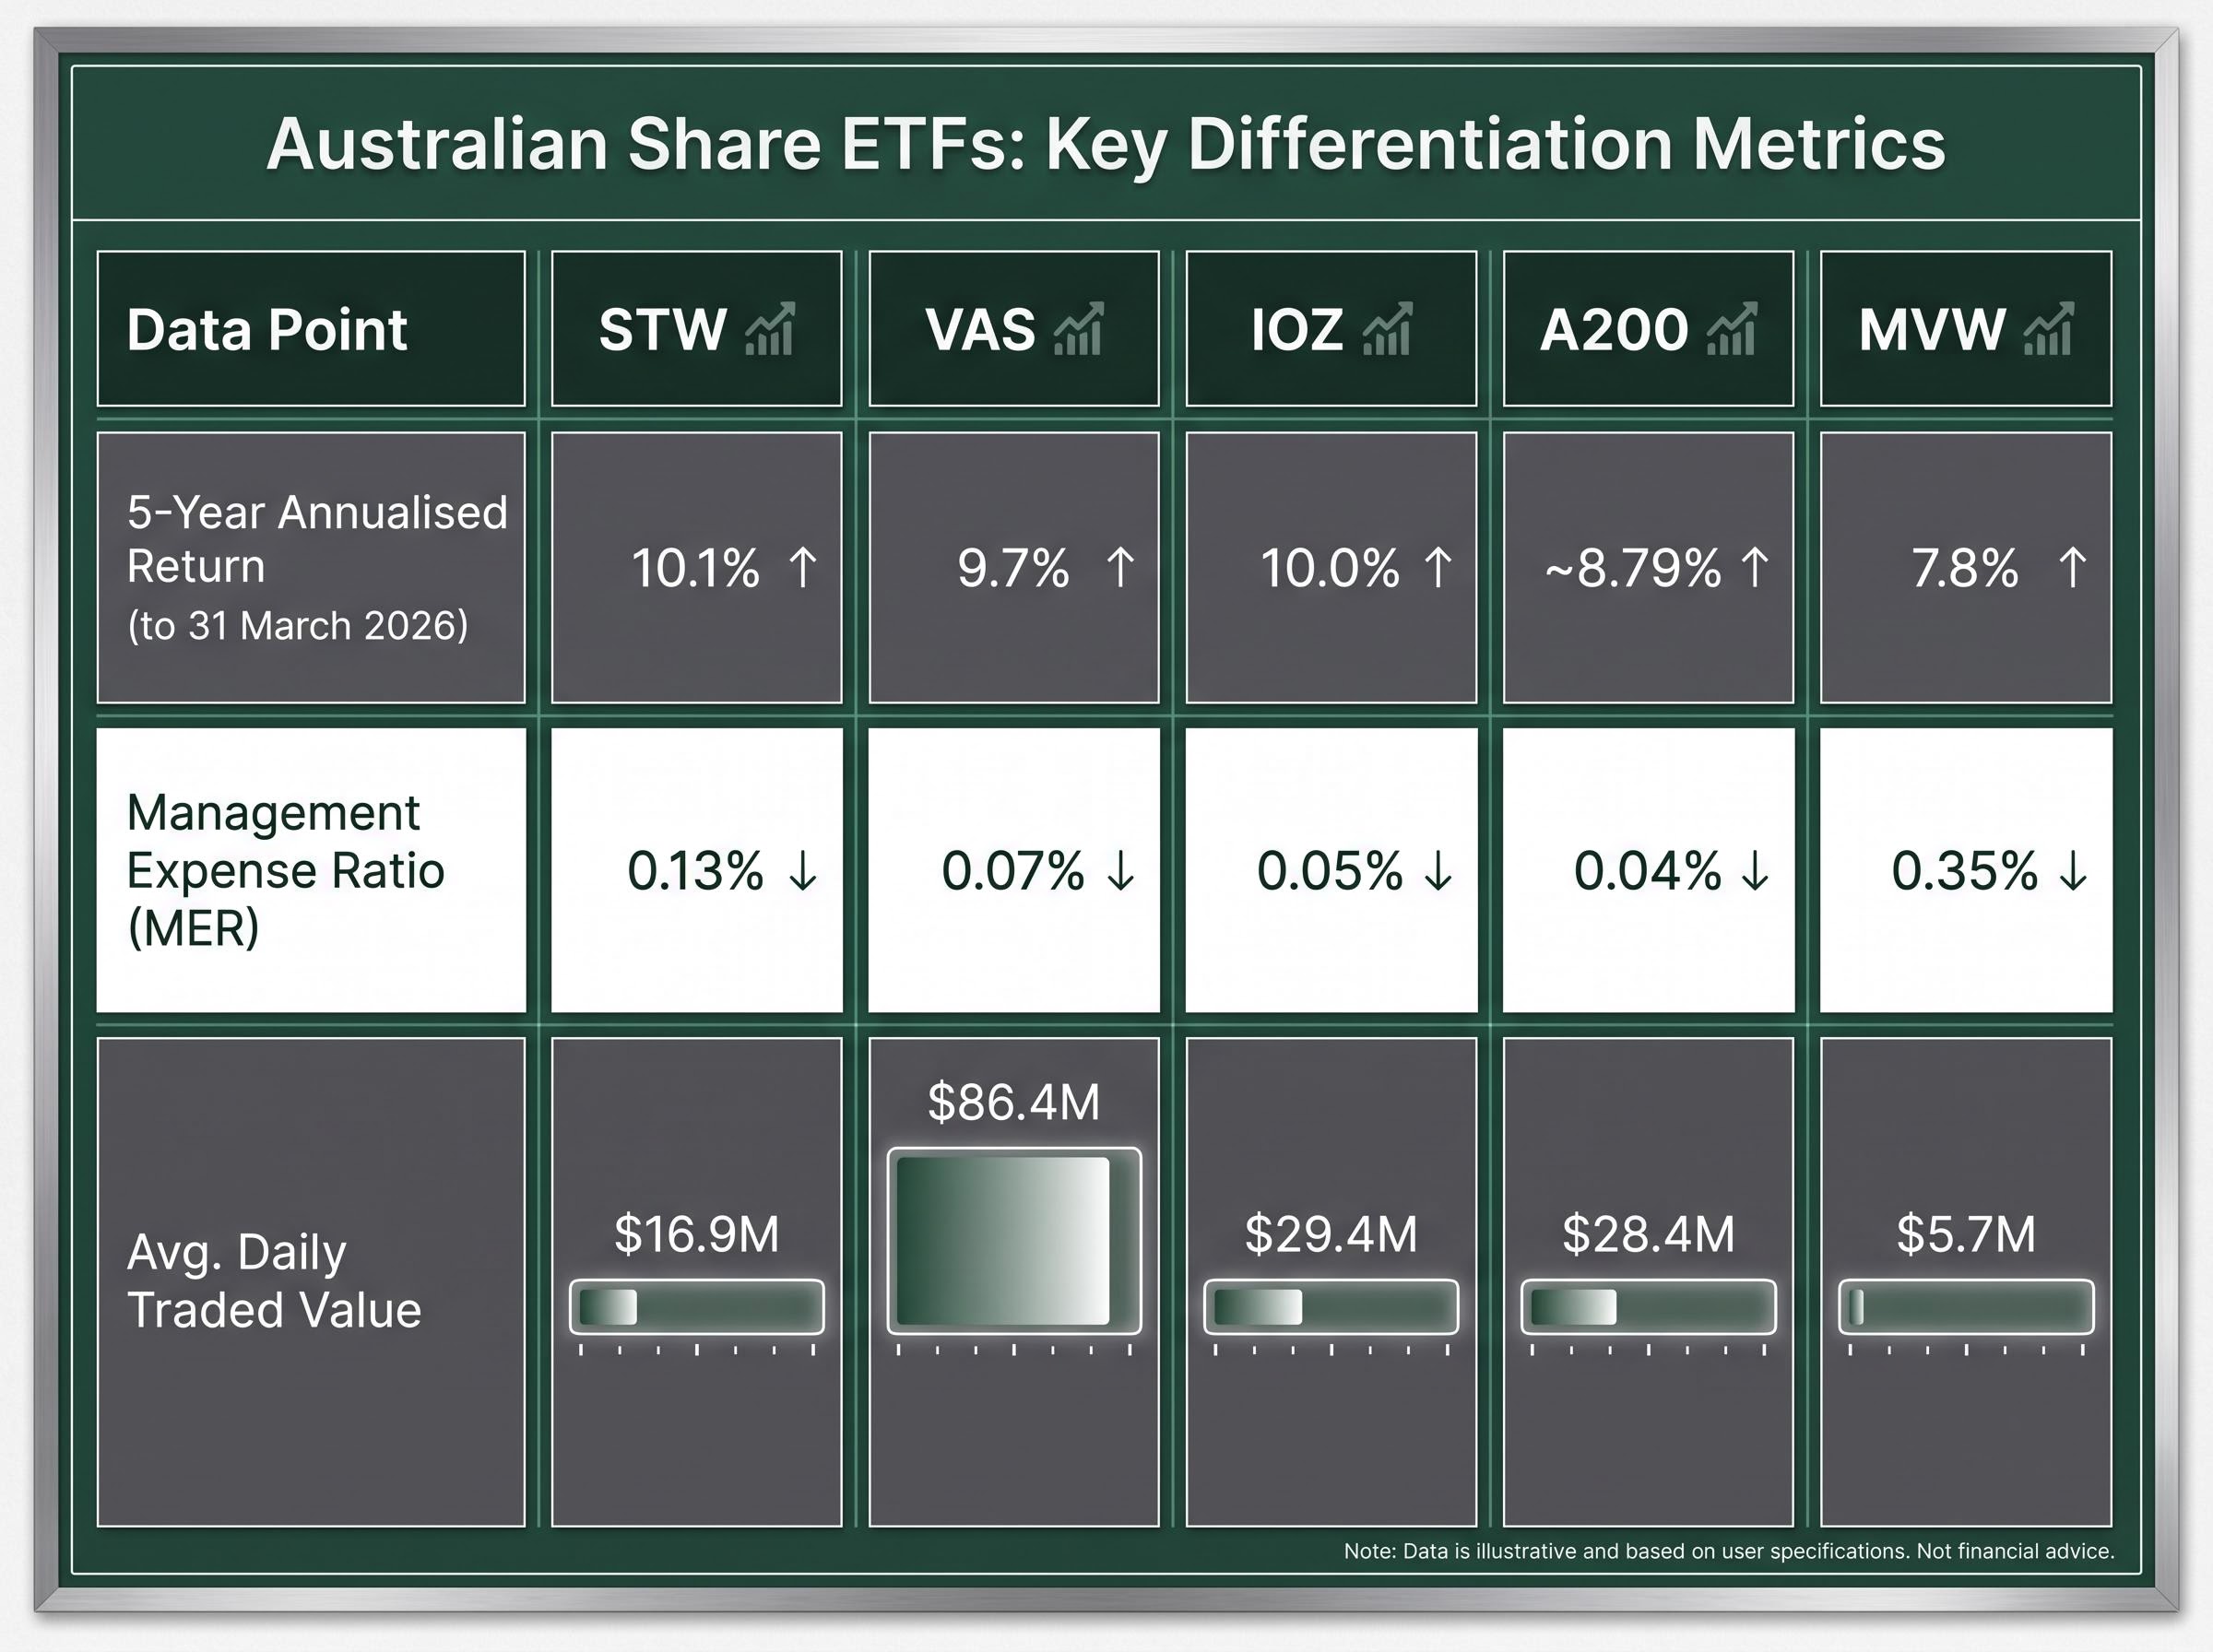
The more immediate problem is that five-year returns barely differentiate these funds at all. As at 31 March 2026:
Four of the five major Australian share ETFs delivered five-year annualised returns within 0.4 percentage points of each other. When recent performance is this tightly clustered, fees and historical track record become the primary differentiators.
MVW‘s position illustrates a separate point. It ranked second among these five at the end of Q1 2025, then fell to last by Q1 2026. That swing reflects the cycle-dependent performance variability that equal-weight methodology introduces, a pattern that its 12-year history is only beginning to characterise.
IOZ‘s trailing twelve-month dividend yield of approximately 5.41% adds a data point for income-focused investors, but yield figures over short windows carry the same limitation as return figures: they describe the recent past, not stress-period behaviour.
When an investor relies only on five-year data, there is no basis for distinguishing between the top four funds. The historical record is where differentiation lives.
Tracking error refers to the divergence between an ETF’s actual return and the return of the benchmark index it aims to replicate. It is caused by management fees, dividend reinvestment timing, and cash drag, the small cash balance funds hold to manage inflows and outflows rather than being fully invested.
Tracking error is rarely zero, even for well-managed funds. Management fees alone create a structural floor.
A short fund history means an investor has only observed tracking error under calm or rising market conditions. The question that matters, whether tracking error widens during stress, when ETF pricing can temporarily disconnect from net asset value and cash drag from redemptions increases, requires data from periods of genuine market dislocation.
A fund with 25 years of live history provides that data. A fund with 12-15 years provides less of it. The mechanism is straightforward: during sharp drawdowns, liquidity conditions shift, bid-ask spreads can widen, and the gap between what an ETF promises and what it delivers becomes more visible.
The current rate environment shapes how tracking error manifests in practice: with the RBA cash rate at 4.10% and Australian long bonds at a decade-high 5.1%, the cash drag that ETFs hold to manage inflows and outflows now carries a higher opportunity cost than it did during the near-zero rate period that dominated the live history of A200 and MVW.
| Fund | MER | Bid-ask spread | Avg. daily traded value |
|---|---|---|---|
| VAS | 0.07% | 0.02% | $86.4M |
| IOZ | 0.05% | 0.04% | $29.4M |
| A200 | 0.04% | 0.03% | $28.4M |
| STW | 0.13% | 0.03% | $16.9M |
| MVW | 0.35% | 0.05% | $5.7M |
For investors making regular contributions or planning to rebalance during downturns, understanding how a fund has historically tracked its index under pressure is a practical input, not an academic one.
ASIC’s regulatory guide for exchange-traded products establishes the disclosure and portfolio transparency obligations that ETF issuers must meet, setting the minimum information floor that investors can rely on when comparing fund structures and assessing issuer conduct across the Australian market.
A snapshot of current fees tells an investor what a fund costs today. A timeline of fee changes tells them something about who the fund manager is working for.
Fee history and provider track record take on added weight when comparing diversified multi-asset structures: VanEck’s newly launched VBAL, VGRO, and VHGR carry no ASX performance history at all, making the trade-off between a 0.39% active fee and the unproven CPI-plus proposition a direct parallel to the uncertainty that comes with any short-lived fund.
VAS has reduced fees multiple times since its 2009 launch, a pattern that Vanguard has replicated globally. The reductions were proactive, arriving before competitive pressure demanded them.
STW moved more slowly:
A200 launched at 0.07% and reduced to 0.04% in March 2023, a competitive move that established the current fee floor for the category.
Stockspot attributes VAS overtaking STW as Australia’s largest share ETF in July 2019 directly to Vanguard’s track record of fee discipline rather than product innovation. The market’s capital allocation told the story before any analyst needed to.
The fee revenue arithmetic adds another dimension. VAS, with ~$22.6 billion in assets under management at 31 March 2026, generates approximately $15.8 million annually at 0.07%. A200, with ~$8.9 billion in AUM at 0.04%, generates approximately ~$3.6 million. Both funds are commercially sustainable, but VAS operates with a significantly wider margin, which provides greater buffer against the operational costs of managing a large index fund through volatile markets.
STW‘s average daily traded value of $16.9 million sits notably below both VAS and IOZ despite its longer history. The market has priced in the fee culture difference.
The track record argument built across the preceding sections is not a case against newer funds. It is a case for understanding what history provides and what, in its absence, can partially substitute.
A200‘s 0.04% fee represents a genuine cost advantage that compounds over long horizons. On $100,000 invested at 7% annual return over 10 years, estimated total fees come to approximately $734 for A200 versus $1,283 for VAS, a difference of roughly $549.
Provider reputation offers a partial substitute for fund longevity. Betashares is an established Australian ETF issuer with a track record across multiple product lines. That institutional credibility reduces, though does not eliminate, the uncertainty that comes with a shorter fund history.
Scale reinforces the point. A200‘s ~$8.9 billion in AUM and $28.4 million in average daily traded value sit well above any plausible closure threshold. The survival risk that genuinely applies to small or niche funds is largely irrelevant here.
The conditions that favour each choice are specific:
MVW‘s equal-weight approach means its historical data answers a different question entirely: not how the Australian market performed, but how a concentration-reduced version of it performed.
Equal-weight methodology introduces a systematic tilt away from the largest market-cap constituents, which in the Australian context means deliberately underweighting the big four banks and major mining companies relative to every other stock in the index; the practical consequence is a return profile that diverges meaningfully from the cap-weighted benchmark during periods when those heavyweight sectors dominate or underperform.
Its shift from second-best to last-place performer between Q1 2025 and Q1 2026 illustrates the performance variability that equal-weighting introduces. Twelve years of live fund history is just long enough to begin revealing those swings.
MVW suits investors with a specific view on concentration risk in the big four banks and major miners. It is not the fund for investors seeking the most representative Australian share exposure.
Investors comparing Australian share ETFs on fees and five-year returns are using information that is necessary but not sufficient. It excludes the dimension where genuine fund differentiation lives: how much observable evidence exists about a fund’s behaviour across varied market conditions.
For most long-term investors building a core Australian equity position, the combination of track record, provider fee behaviour, and current cost makes VAS the analytically strongest option. Its S&P/ASX 300 coverage (approximately 300 stocks versus 200 for STW, IOZ, and A200), its ~$22.6 billion in AUM, and Vanguard’s documented history of proactive fee reductions form a coherent package. Stockspot has maintained a preference for VAS since 2014, citing these same factors.
A200 remains a credible alternative for cost-conscious investors building with a long horizon ahead of them. As A200 and IOZ accumulate history through future market cycles, the track record gap will narrow, making today’s decision partly a judgement about how much the historical evidence premium is worth to a specific investor.
Portfolio construction beyond a single index fund becomes the natural next question once a core Australian equity position is established: allocating entirely to one cap-weighted domestic index concentrates both country and sector risk, and the decision of which complement to add, whether international quality exposure, S&P 500 coverage, or domestic factor tilts, depends on how much of the Australian benchmark’s sector composition an investor is comfortable with.
Investors choosing between funds that are 0.03% apart in fees are really choosing between different amounts of evidential history, and that is a different kind of decision.
With $13.3 billion flowing into Australian share ETFs in the 12 months to December 2025, the scale of capital being deployed into these vehicles makes the distinction worth examining carefully.
This article is for informational purposes only and should not be considered financial advice. Investors should conduct their own research and consult with financial professionals before making investment decisions. Past performance does not guarantee future results.
Tracking error is the divergence between an ETF's actual return and the return of its benchmark index, caused by management fees, dividend reinvestment timing, and cash drag. Even well-managed funds rarely achieve zero tracking error, and the gap can widen during periods of market stress.
STW is the longest-running Australian share ETF, having commenced trading on 3 April 2001, giving it approximately 25 years of live history that includes the dot-com aftermath, the Global Financial Crisis, the COVID crash, and the 2022 rate-driven selloff.
VAS suits investors who prioritise a longer historical record, maximum liquidity, and Vanguard's documented history of proactive fee reductions, while A200 suits cost-conscious investors comfortable with a shorter live stress-test history who accept that provider reputation and substantial scale partially compensate.
Five-year annualised returns are entirely contained within a single market phase and cannot reveal how a fund behaves during a genuine crisis like the GFC. As at 31 March 2026, four of the five major Australian share ETFs delivered five-year returns within 0.4 percentage points of each other, meaning fees and historical track record become the primary differentiators.
MVW uses an equal-weight methodology that deliberately underweights the big four banks and major miners relative to every other stock, producing a return profile that diverges meaningfully from cap-weighted funds during periods when those heavyweight sectors dominate or underperform.