BofA Reverses Course: Three Fed Hikes in 2026, No Cuts Until 2028
2 hrs ago

Automotive fuel costs surged 32.8% in a single month in March 2026, and that number does not yet reflect the full force of what is coming through supply chains in Q2 and Q3. The May 5-6 Reserve Bank of Australia board meeting arrives at a particularly fraught moment: headline CPI has jumped from 3.7% to 4.6% year-on-year in a single month, all four major banks now forecast a rate hike to 4.35%, and Westpac is pricing in a path to 4.85% by August. The oil price shock stemming from the Middle East conflict is not yet fully embedded in the inflation data, which makes the RBA’s task considerably harder than the headline numbers suggest.
This analysis explains why Australia’s rate cycle is not close to over, how the oil shock is set to amplify existing inflation pressure across Q2 and Q3, and what the major bank forecasts on the RBA cash rate mean for borrowers facing the possibility of elevated rates well into 2027.
The oil price surge did not arrive into a benign inflation environment. It collided with one that was already compromised.
Q1 2026 trimmed mean inflation printed at 0.8% quarter-on-quarter, putting the annual rate at 3.5% year-on-year. That was 0.1 percentage points below the RBA’s February Statement on Monetary Policy (SoMP) forecast, and marginally softer than NAB’s and the broader consensus expectation of 0.9% quarter-on-quarter. The shortfall, however, was concentrated in volatile travel components rather than reflecting any broad-based easing in price pressures.
Approximately two-thirds of the CPI basket was rising at an annualised pace above 3% in Q1 2026, a breadth measure that undercuts any relief from the marginally softer headline.
The RBA’s February SoMP did not incorporate the subsequent Middle East conflict escalation or the fuel price surge that followed, meaning the central bank’s own baseline projections are now materially outdated heading into May.
For readers who want to build a clearer foundation before working through the bank forecasts and scenario paths, our dedicated guide to CPI and rate hike mechanics explains why the trimmed mean diverges from headline CPI, why rate hikes are a less effective tool against cost-push supply shocks than demand-pull inflation, and what the RBA’s target band means in practical terms for borrowers.
Electricity prices were already 25.4% higher year-on-year as of March 2026, a spike triggered by the expiry of the Energy Bill Relief Fund (EBRF) payments in January 2026. Monthly electricity prices have held flat since January rather than reversing, which means the annual base effect will remain elevated throughout 2026. The oil shock, in other words, arrived on top of a pre-existing inflation problem, not instead of one.
One month’s data changed the posture of banks that had spent weeks hedging their language.
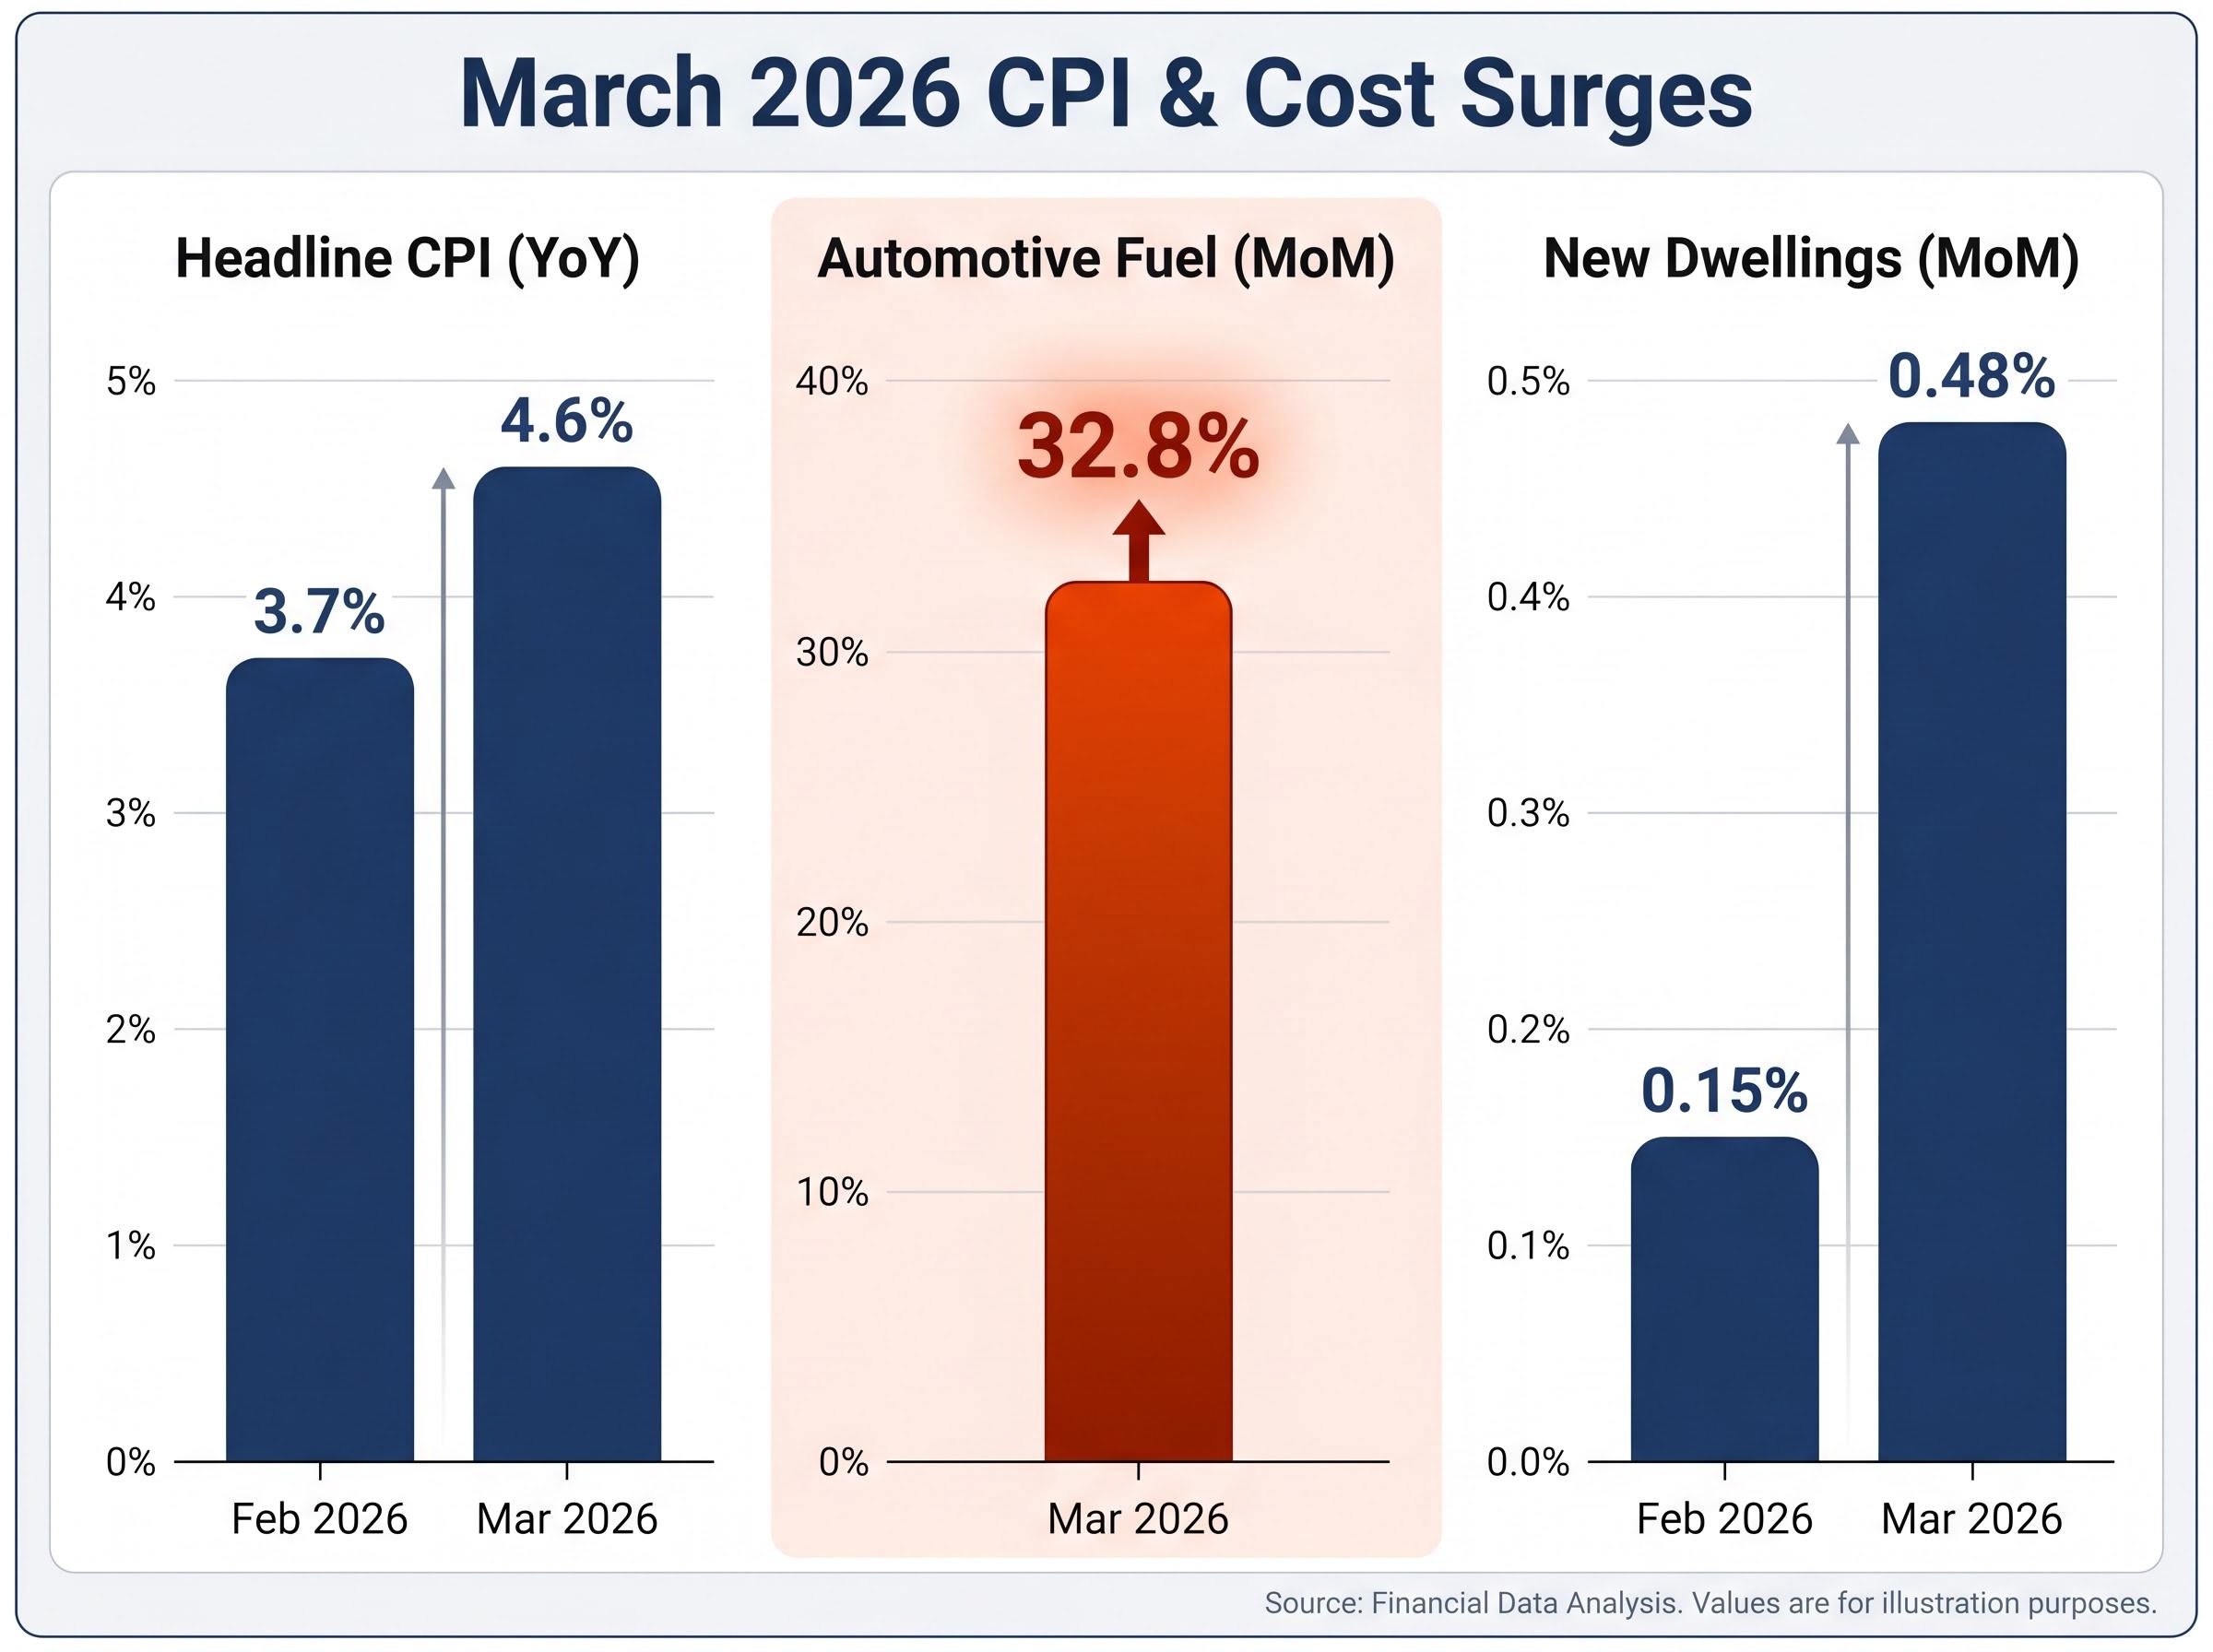
Monthly headline CPI accelerated from 3.7% to 4.6% year-on-year between February and March 2026, driven overwhelmingly by the 32.8% month-on-month surge in automotive fuel costs.
The ABS March 2026 CPI release confirmed headline inflation at 4.6% year-on-year, with the 32.8% monthly fuel surge representing the sharpest single-month movement in automotive costs recorded in the series, giving the RBA an unambiguous data mandate heading into the May meeting.
Automotive fuel costs rose 32.8% in a single month, the sharpest monthly increase in the ABS series in recent memory.
Monthly trimmed mean held at 3.3% year-on-year, with the month-on-month reading edging up to 0.3% from 0.2%. That confirms underlying inflation pressure is not purely a fuel story. Market services inflation (excluding rents) printed at 0.27% month-on-month, consistent with the prior month and tracking above 3% on a year-ended basis. New dwelling purchase costs accelerated to 0.48% month-on-month, up sharply from 0.15% in February.
| CPI Component | February 2026 | March 2026 |
|---|---|---|
| Headline CPI (year-on-year) | 3.7% | 4.6% |
| Trimmed Mean (year-on-year) | 3.3% | 3.3% |
| Automotive Fuel (month-on-month) | — | 32.8% |
| New Dwellings (month-on-month) | 0.15% | 0.48% |
| Market Services ex-Rents (month-on-month) | 0.27% | 0.27% |
The March fuel data predates the April 1 fuel excise tax reduction, which will mechanically affect the April CPI read but does not resolve the underlying supply-side energy pressure. The print mattered because it transformed the major banks’ rate outlooks in real time; CBA and ANZ updated their previously cautious positions in the final days of April.
The 32.8% fuel cost surge is the visible number. The less visible channels carry at least as much consequence for the inflation outlook.
Higher oil prices raise costs through three main second-round transmission channels:
These effects typically appear in CPI data one to two quarters after the initial fuel price movement. NAB explicitly identified Q2 and Q3 2026 as the period when second-round pass-through becomes most visible, flagging the risk of broad and rapid secondary-round price transmission.
Federal Reserve research on oil price second-round effects in advanced economies quantifies the typical transmission lag at one to two quarters, with the broadest pass-through into services and construction costs concentrated in the second and third quarters following the initial energy price movement.
New dwelling purchase costs are the named high-risk category. Oil-based plastics and insulation materials, diesel-powered logistics networks, and energy-intensive manufacturing of building products all face upward cost pressure simultaneously. The March new dwellings acceleration to 0.48% month-on-month (from 0.15% in February) is early evidence this channel is already activating.
Brent crude closed at US$110.61 per barrel on 30 April 2026, up 6.38% over the prior month. That price level signals continued external pressure on Australian input costs across Q2.
The consensus formed in the final days of April 2026, and the speed of convergence is itself analytically significant.
Market-implied rate hike odds, which were sitting at 62% ahead of the May meeting, tell a slightly more cautious story than the unanimous four-bank consensus; the gap between options market pricing and bank research reflects genuine uncertainty about whether one month of fuel-driven headline inflation is sufficient to override the RBA’s desire to preserve its policy flexibility.
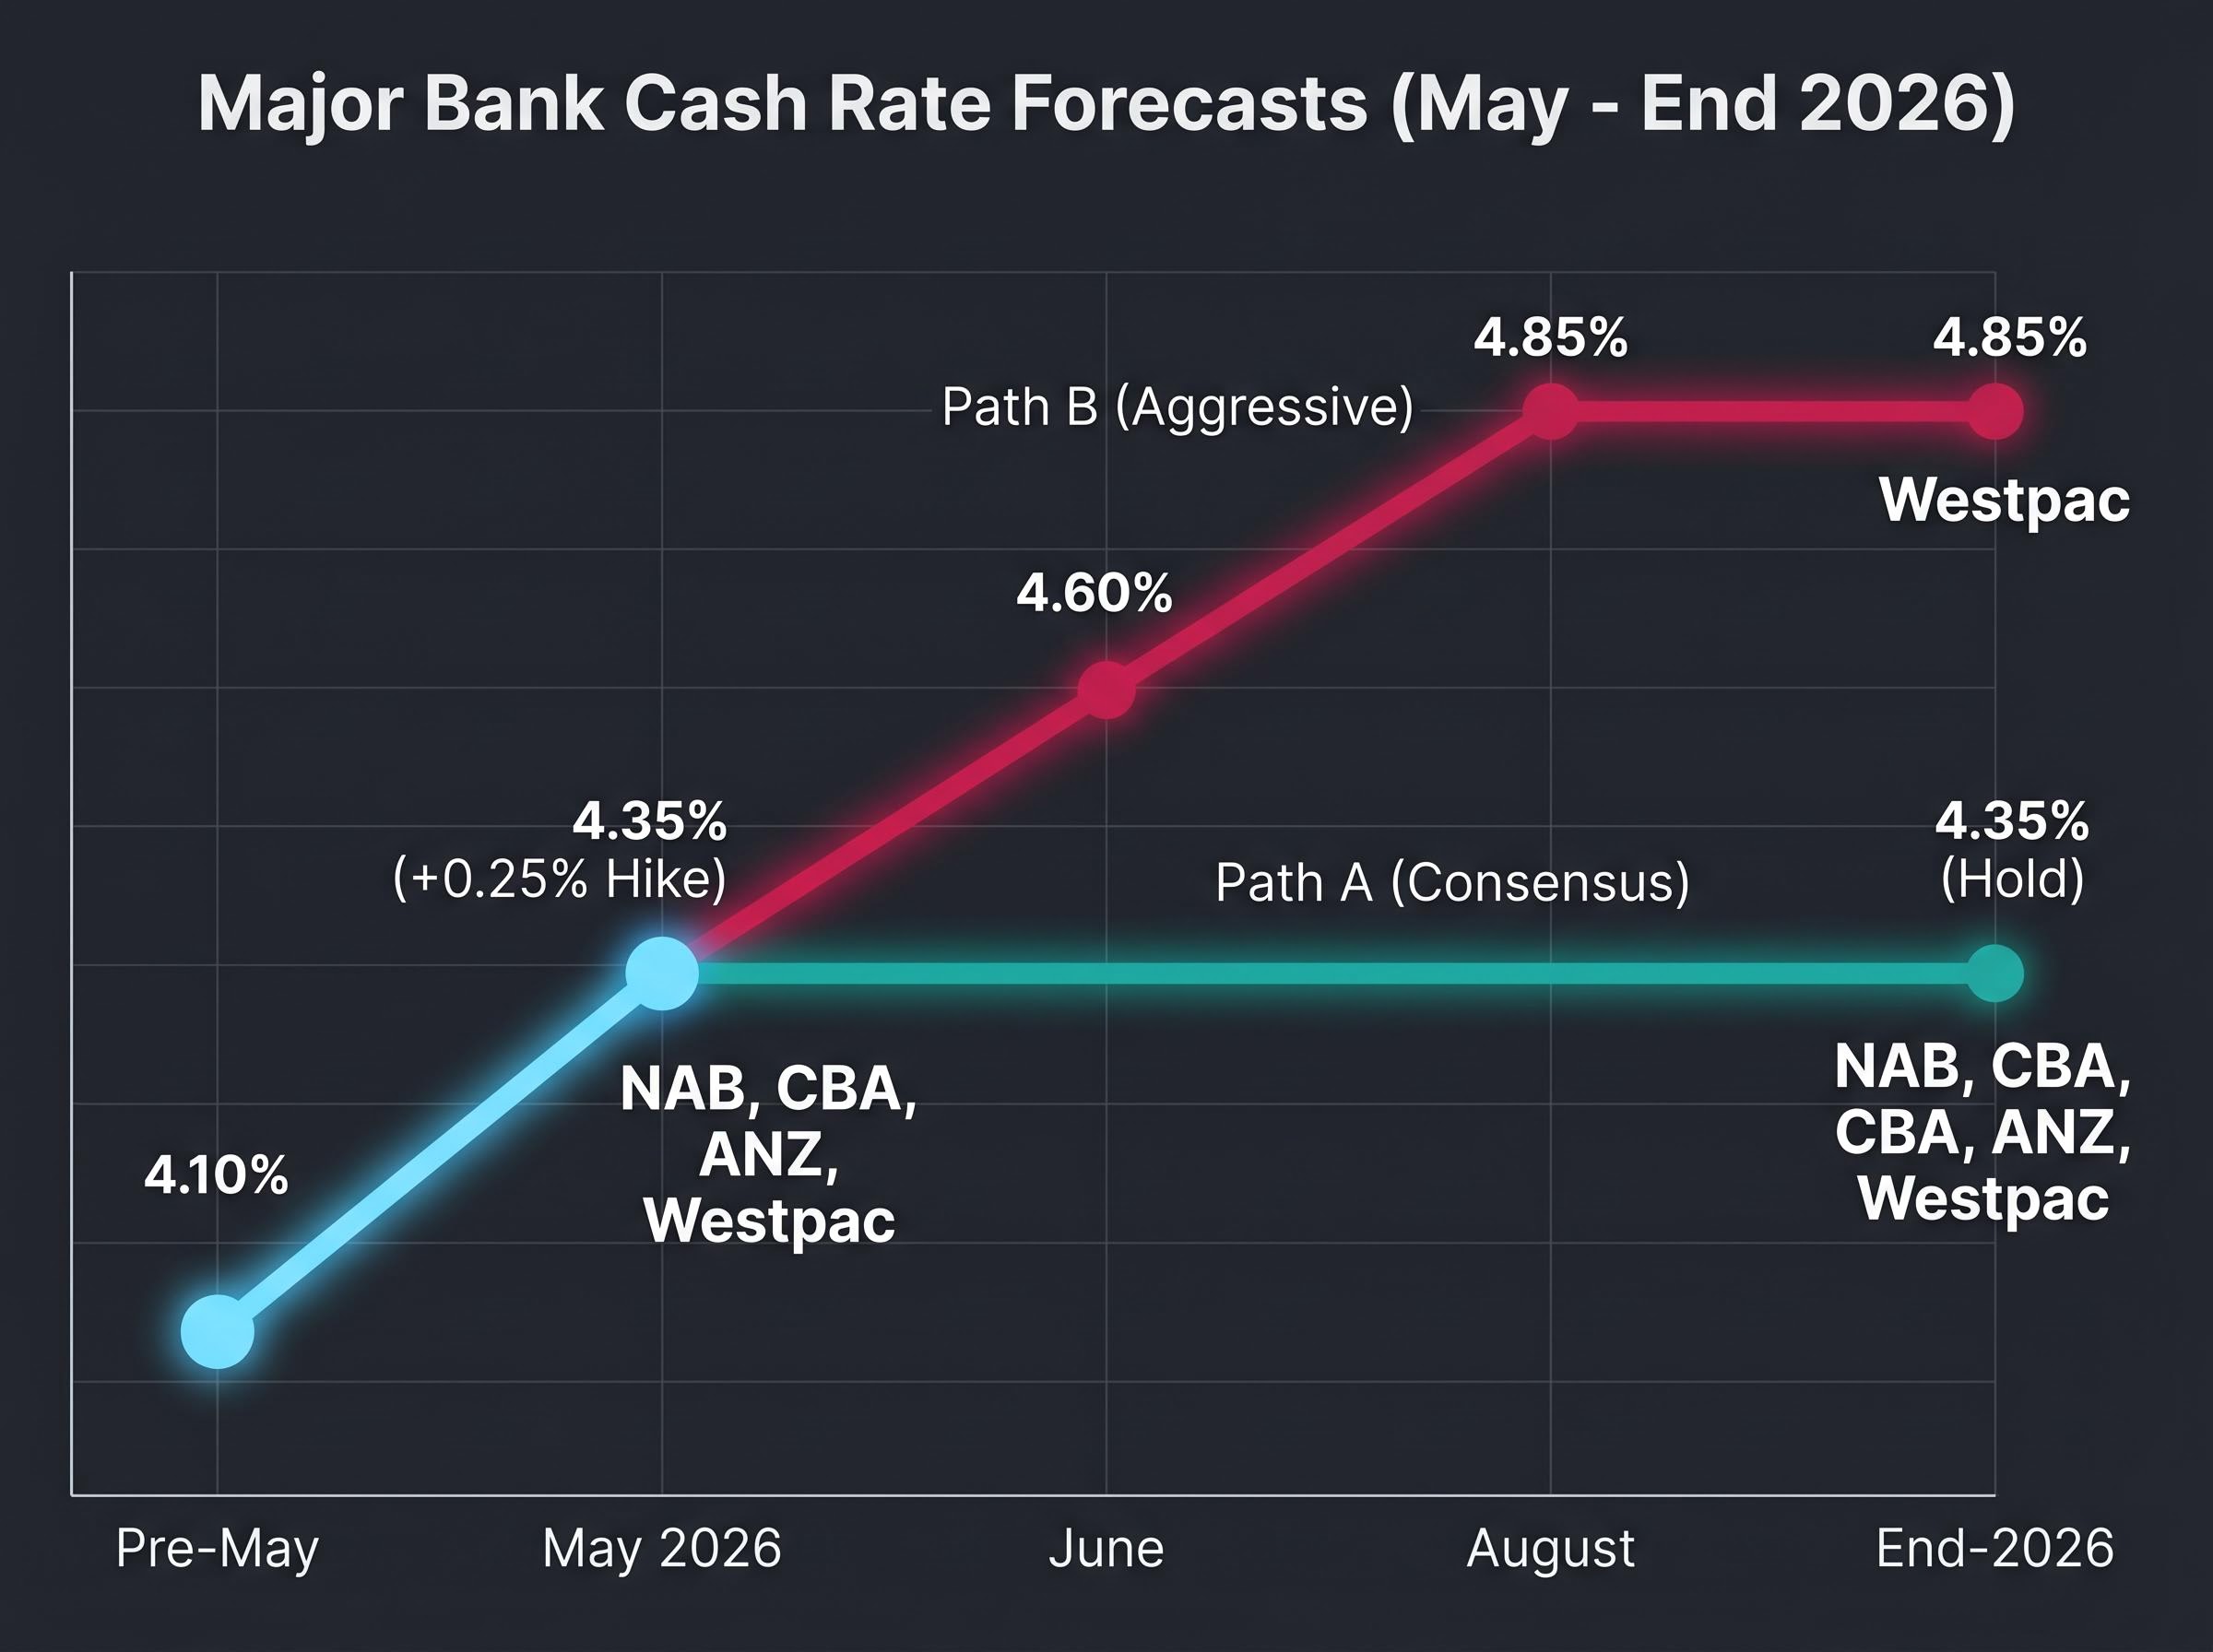
All four major banks now forecast a 25 basis point hike at the May meeting, lifting the cash rate from 4.10% to 4.35%. CBA and ANZ updated their previously cautious positions after the March CPI data confirmed the scale of the inflation impulse.
| Bank | May 2026 Forecast | Post-May Cash Rate | Path to End-2026 |
|---|---|---|---|
| NAB | +0.25% | 4.35% | Hold at 4.35% |
| CBA | +0.25% | 4.35% | Hold at 4.35% |
| ANZ | +0.25% | 4.35% | Hold at 4.35% |
| Westpac | +0.25% | 4.35% | Further hikes in June and August to 4.85% |
Westpac’s three-hike path to 4.85% by August represents a materially different view of how persistent the inflation problem will prove. That divergence is where the more consequential question lives.
Three macro signals are pulling in opposite directions:
The RBA must hike into a deteriorating sentiment environment while the labour market has yet to crack. That tension defines the policy trade-off at the May meeting.
The May hike is a single 25 basis point move. The hold period that follows carries more cumulative financial impact for most borrowers.
NAB’s base case projects one hike in May followed by an extended hold at 4.35% through mid-to-late 2027, meaning Australian borrowers face roughly 12-18 months of rates at or near peak before any easing is expected. This rate cycle has already compressed household cash flow substantially from the current 4.10% level; an additional quarter point, held for over a year, extends that pressure.
Big Four bank valuations have diverged sharply from analyst consensus targets during the 2026 rate cycle, with CBA carrying unanimous sell ratings despite its year-to-date price gains, a disconnect that reflects how market participants are pricing rate-cycle duration risk differently from the banks’ own research divisions.
NAB explicitly acknowledges upside risk to the cash rate beyond its base case. If Q2 and Q3 CPI data confirm the second-round pass-through scenario, the cash rate may need to move beyond 4.35%, bringing Westpac’s path to 4.85% into play as a realistic alternative.
The data releases that will determine which scenario prevails:
For borrowers on variable mortgages and anyone reviewing fixed-rate decisions, the duration of the hold period is at least as significant as the size of the next hike. Rate relief is a 2027 story, not a 2026 one, under every major bank scenario.
The RBA must tighten against an oil-driven inflation shock that standard monetary policy cannot directly address. Oil prices are set globally, not domestically, yet the inflationary consequences land squarely in Australian consumer prices.
Simultaneously, consumer and business sentiment have deteriorated to levels that invite caution about tipping the economy into a sharper growth slowdown. The tension is genuine: hiking rates cannot lower the price of Brent crude, but failing to hike risks allowing inflation expectations to become entrenched.
The February SoMP baseline is now materially stale. The May meeting will be the RBA’s first opportunity to formally acknowledge the changed inflation environment in its updated forecasts and Governor Bullock’s public statement.
The May 5-6 meeting resolves the immediate question. The longer question depends on what follows.
Q2 2026 CPI data (released in July) will provide the first full-quarter read on whether second-round pass-through from oil prices into construction, transport, and services costs has materialised at the scale NAB has flagged. Q3 2026 CPI (October) will confirm or contradict that trajectory. April labour force data, due mid-May, offers the first read on whether the labour market is beginning to soften under the weight of tightening already in place.
With Brent crude at US$110.61 on 30 April, the external pressure has not abated. If the pass-through effects come through strongly, Westpac’s path to 4.85% moves from outlier to live scenario.
Australia entered the oil shock with core inflation already at 3.5%. The March data confirmed a sharp external impulse is now moving through the economy. All four major banks expect a May hike. The hold period extends well into 2027 even under the benign scenario.
The honest uncertainty is this: NAB’s base case of one hike and a prolonged hold is the consensus forecast, but the bank itself flags upside risk, and Westpac’s three-hike path to 4.85% is not a fringe view.
Three scenario paths frame the realistic range:
The May decision is the start of a long plateau, not the end of the tightening cycle. Financial planning for Australian households should be built around rates remaining elevated through at least mid-2027, with a credible risk of further increases if the inflation data between now and October confirms the pass-through thesis.
Investors wanting to stress-test the consensus hold scenario against the historical record will find our deep-dive into historical supply shock rate cycles, which examines the 1970s oil embargoes and the Volcker period to show that rate normalisation has typically followed within a 6-12 month window of a shock’s peak, alongside Oxford Economics modelling of potential back-to-back GDP contractions in Australia for June and September 2026.
This article is for informational purposes only and should not be considered financial advice. Investors should conduct their own research and consult with financial professionals before making investment decisions. Past performance does not guarantee future results. Financial projections are subject to market conditions and various risk factors.
All four major Australian banks, NAB, CBA, ANZ, and Westpac, forecast a 25 basis point hike at the May 2026 meeting, lifting the cash rate from 4.10% to 4.35%. Westpac goes further, projecting additional hikes in June and August that would take the cash rate to 4.85% by August 2026.
The March 2026 CPI surge from 3.7% to 4.6% year-on-year was driven overwhelmingly by a 32.8% month-on-month spike in automotive fuel costs, the sharpest single-month movement in the ABS series in recent memory, triggered by the Middle East conflict-related oil price shock.
Higher oil prices transmit into the broader economy through transport and freight costs, oil-based building materials such as plastics and insulation, and elevated energy inputs to service businesses. NAB has identified Q2 and Q3 2026 as the period when these second-round pass-through effects are expected to become most visible in CPI data.
Under the NAB, CBA, and ANZ base case, the cash rate holds at 4.35% through mid-to-late 2027, meaning rate relief is a 2027 story at the earliest. No major bank currently models rate cuts as a base case scenario for 2026.
The Q2 2026 CPI release in July is the critical first read on whether oil price second-round effects have passed through into construction, transport, and services costs. The Q3 2026 CPI in October will either confirm or contradict that trajectory, and April and May labour force data will signal whether the labour market is beginning to soften.