In mid-2026, a standard Australian high-interest savings account pays up to 5.65% p.a., a rate that sits comfortably alongside government bonds and edges closer to the long-run average return of the sharemarket. That proximity raises a question worth pausing on: does it still make sense to accept more investment risk when a savings account delivers a competitive return? The answer depends on understanding a single concept that underpins every investment decision, from the simplest term deposit to the most volatile small-cap stock. The relationship between investment risk and return is the framework that explains why different asset classes produce different outcomes over time, and why those differences are not random. This article explains what investment risk actually means, how it connects to potential returns, and how Australia’s four primary asset classes, cash, bonds, property, and shares, sit on that spectrum using current 2026 data. Readers will finish with a practical framework for comparing investment categories and a sharper sense of what “risk” means for their own financial decisions.
What investment risk actually means (and what it doesn’t)
The instinctive reaction to the word “risk” is negative. Risk sounds like danger, and danger sounds like something to avoid. That instinct is useful in most areas of life, but it produces a distorted picture when applied to investing.
Investment risk is the possibility that unforeseen events affect an investment’s performance. That definition cuts in both directions. A high-risk investment is not one that will lose money; it is one where outcomes are wider and less predictable. The range of possible results stretches further in both directions, toward larger losses and toward larger gains.
Volatility is the practical measure of this range. It captures how far an asset’s value swings between its highest peaks and lowest troughs over a given period. The wider those swings, the higher the risk.
Three core dimensions make the concept concrete:
- Probability of loss: the likelihood that an investment will decline in value over a given period
- Magnitude of gain or loss: the size of potential outcomes on both the upside and the downside
- Volatility range: the spread between an asset’s best and worst performance periods, which determines how bumpy the ride feels along the way
Elevated risk levels correspond to a greater likelihood of financial loss. They also correspond to greater potential for higher earnings. Both sides of that equation matter, and understanding both is what separates reactive decision-making from deliberate investing.
When big ASX news breaks, our subscribers know first
The four asset classes and where they sit on the spectrum
Australia’s four primary asset classes, cash, bonds, property, and shares, each occupy a distinct position on the risk-return spectrum. The ranking is not arbitrary. It emerges from the structural characteristics of each asset type.
ASIC MoneySmart investor guidance classifies cash and fixed interest as defensive assets and property and shares as growth assets, a distinction that underpins the risk-return ordering described above and reflects the official regulatory framework Australian retail investors are expected to understand.
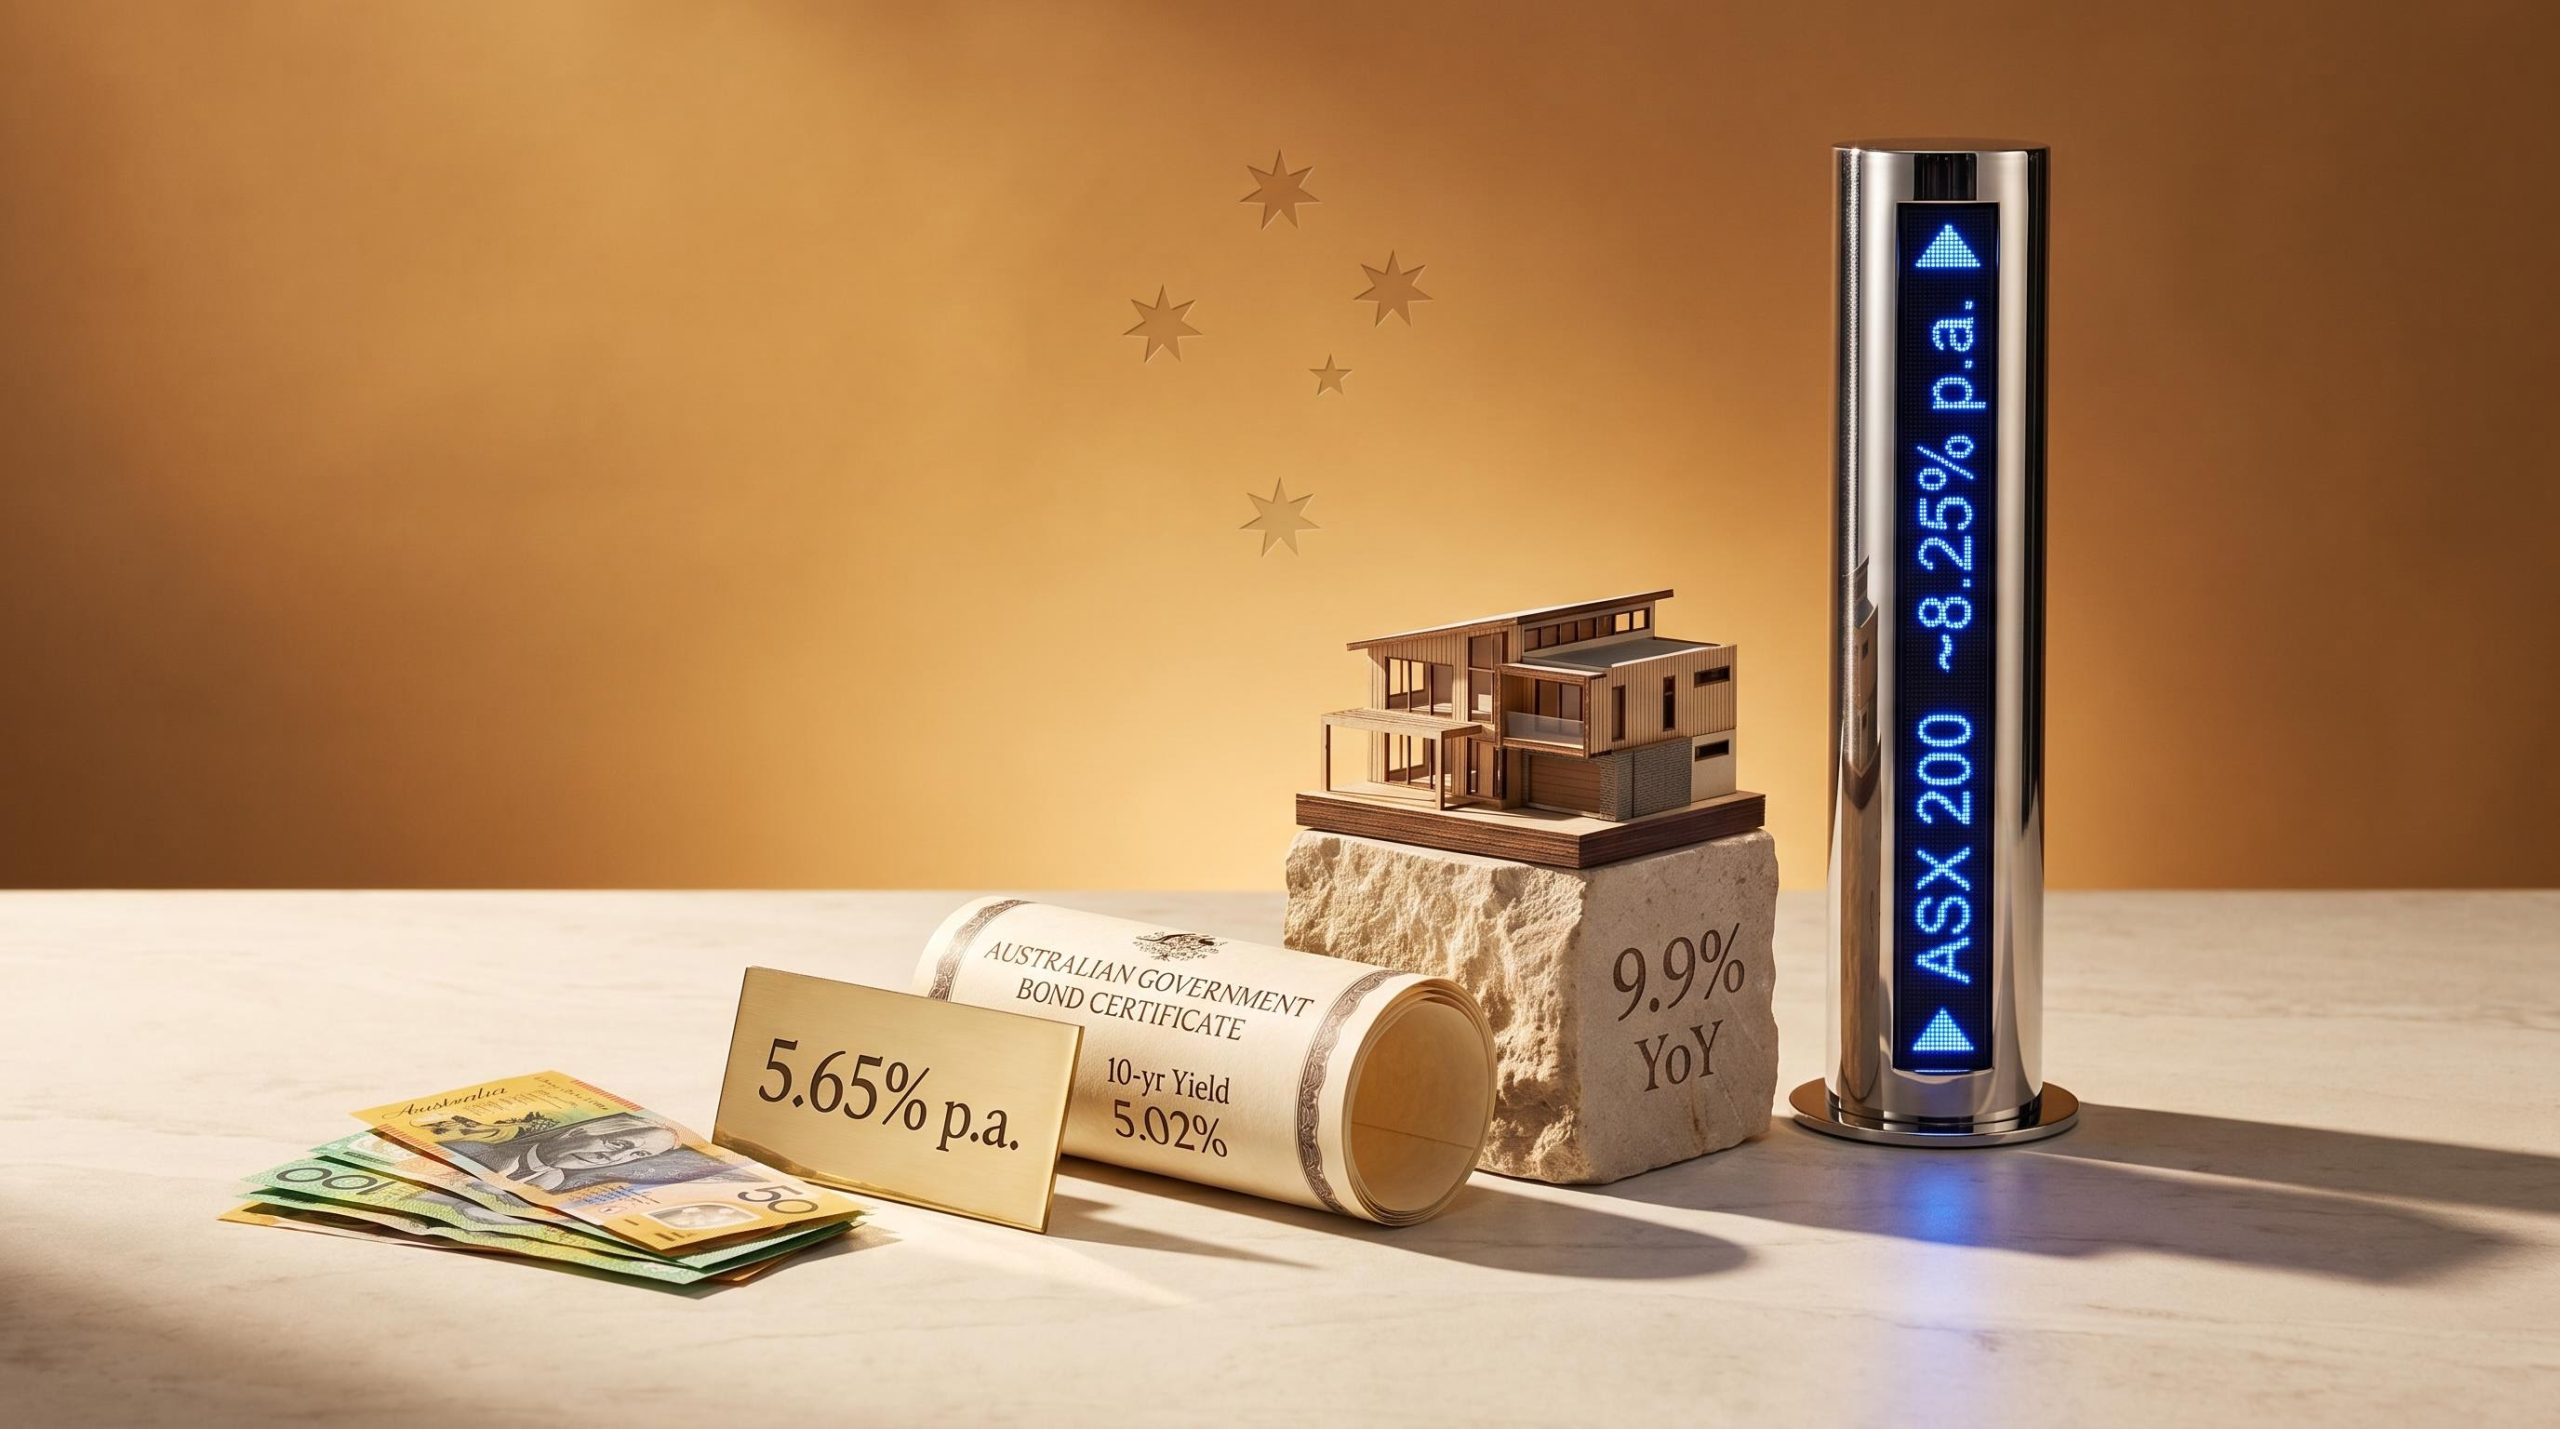
Cash sits at the low end. Deposits in authorised institutions carry government-backed protection, and savings rates are fixed or near-fixed over short periods. That guarantee mechanism means the range of outcomes is narrow: the return is predictable, but it is also constrained. Current high-interest savings accounts offer up to 5.65% p.a. (Ubank Save at 5.6% p.a.; Community First Bank 12-month term deposit at 5.4% p.a.).
Bonds sit one step higher. A government bond is a fixed-income contract: the issuer agrees to pay a set rate of interest and return the principal at maturity. That structure produces more stability than shares, but beneath the surface sits interest rate risk, where the market value of existing bonds falls when prevailing rates rise. The Australian government 10-year bond yield stood at 5.02% as of 30 April 2026.
Property carries higher return potential alongside higher risk. The illiquidity premium (property cannot be sold quickly without cost) and concentration risk (a single dwelling represents a large, undiversified position) are the structural reasons returns have historically been higher. National dwelling values rose 9.9% year-on-year as of February 2026, and long-term annualised returns have historically sat at approximately 6-8% p.a.
Shares sit at the top of both scales. Shareholders are residual claimants, meaning they are last to be paid after creditors and bondholders. That structure produces maximum downside in distress and maximum upside in growth. The ASX 200 has delivered a long-term annualised total return of approximately 8.25% p.a.
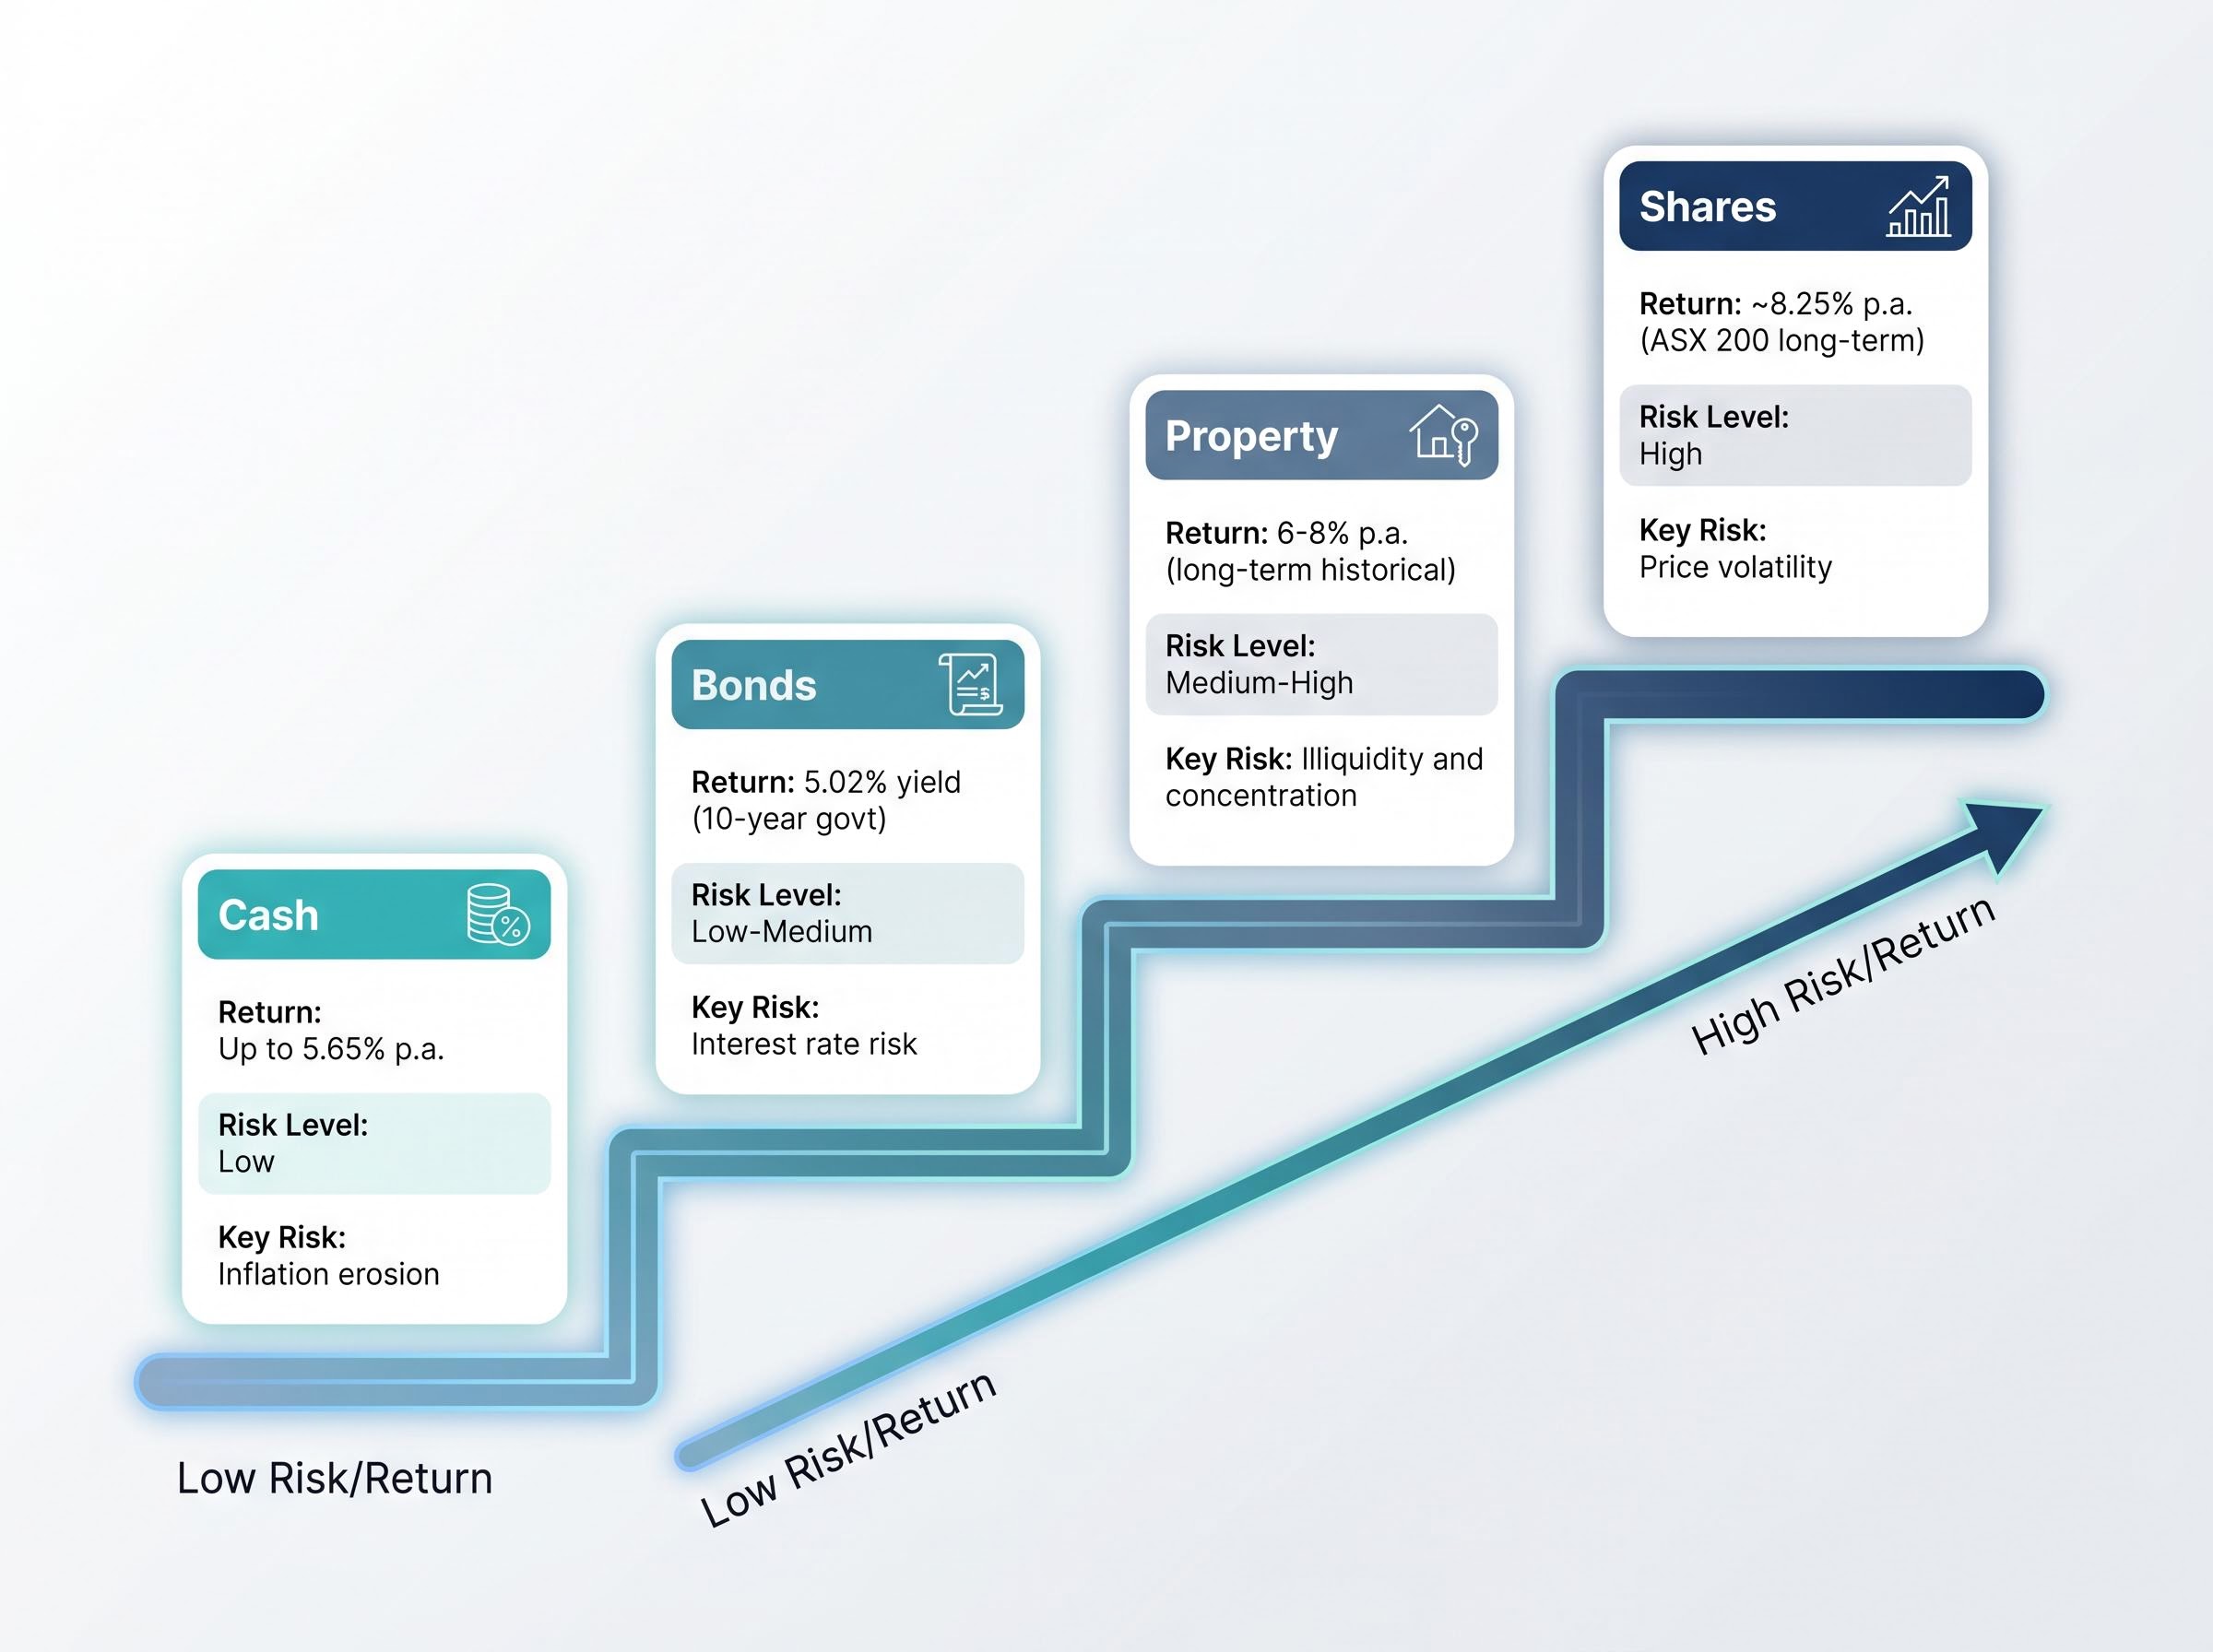
| Asset Class | Approximate Return | Key Risk Type | Risk Level |
|---|---|---|---|
| Cash | Up to 5.65% p.a. (current) | Inflation erosion | Low |
| Bonds | 5.02% yield (10-year govt) | Interest rate risk | Low-Medium |
| Property | 6-8% p.a. (long-term historical) | Illiquidity and concentration | Medium-High |
| Shares | ~8.25% p.a. (ASX 200 long-term) | Price volatility | High |
Property’s illiquidity deserves a separate note. Unlike shares or bonds, a residential property cannot be converted to cash within days. Settlement periods, transaction costs, and market conditions mean that the ability to exit is itself a risk dimension not captured in return figures alone.
Why higher risk has historically produced higher returns over time
The pattern is not a coincidence. It is a structural feature of how markets price uncertainty.
Investors must be compensated for accepting wider outcome ranges. If a savings account and a share portfolio offered the same expected return, no rational investor would choose the portfolio with the larger potential for loss. To attract capital, assets with higher uncertainty must offer a premium, a higher expected return over time. This is the risk premium, and it is the economic engine behind the entire spectrum.
AU$10,000 invested across four asset classes over 25 years (1996 to 30 June 2022) would have produced starkly different outcomes. Shares and property delivered superior cumulative returns relative to cash and bonds, despite experiencing significantly greater volatility along the way. The divergence in end values illustrates the compounding effect of even modest annual return differences sustained over long horizons.
The ASX 200 long-term average of approximately 8.25% p.a. versus historical cash returns (which were considerably lower in prior rate cycles) demonstrates the premium in practice. Morningstar’s forward 10-year property projection of 2-5% p.a. versus the ASX’s projected 6.5-10% further illustrates that recent strong capital growth in property does not resolve its lower structural return outlook.
The historical risk premium is most clearly observed under three conditions:
- Long time horizons: over periods of 10 years or more, the premium has been consistently positive for shares relative to cash
- Diversified exposure: broad index returns (such as the ASX 200) smooth out the risk of individual stock failure
- Reinvested returns: dividends and distributions compounded over time amplify the gap between asset classes
One caveat matters in 2026. Cash rates of up to 5.65% and bond yields above 5% have unusually compressed the traditional return premium of shares over cash. The gap between a savings account and the sharemarket’s long-run average is narrower than it has been in years. That compression is cyclical, driven by the current interest rate environment, but it makes the historical pattern temporarily less stark for investors comparing their options today.
The hidden risks inside each asset class
Headline return figures tell an incomplete story. Each asset class carries risks that sit beneath the surface, and understanding them changes how the numbers should be read.
Bond interest rate risk
Bonds are often perceived as safe, and in terms of income reliability, they largely are. The risk sits in capital value. When prevailing interest rates rise, the market value of existing bonds falls, because newly issued bonds offer higher yields and make older, lower-yielding bonds less attractive.
- The Australian 10-year government bond yield moved from historically low levels pre-2022 to 5.02% as of 30 April 2026, climbing above 5.1% during Q1 2026 before settling.
- Existing bondholders who purchased at lower yields experienced mark-to-market capital losses during this period, even as income returns improved.
- Even “safe” government bonds carry capital value risk during rate-tightening cycles.
The behaviour of safe haven assets in a supply shock differs fundamentally from their behaviour in a demand-collapse crisis: when surging oil prices force central banks to raise rates rather than cut them, the diversification logic that normally makes bonds and gold useful defensive instruments breaks down, exposing portfolios built around conventional crisis playbooks.
Property overvaluation and liquidity risk
The 9.9% year-on-year dwelling value growth masks structural concerns beneath the headline.
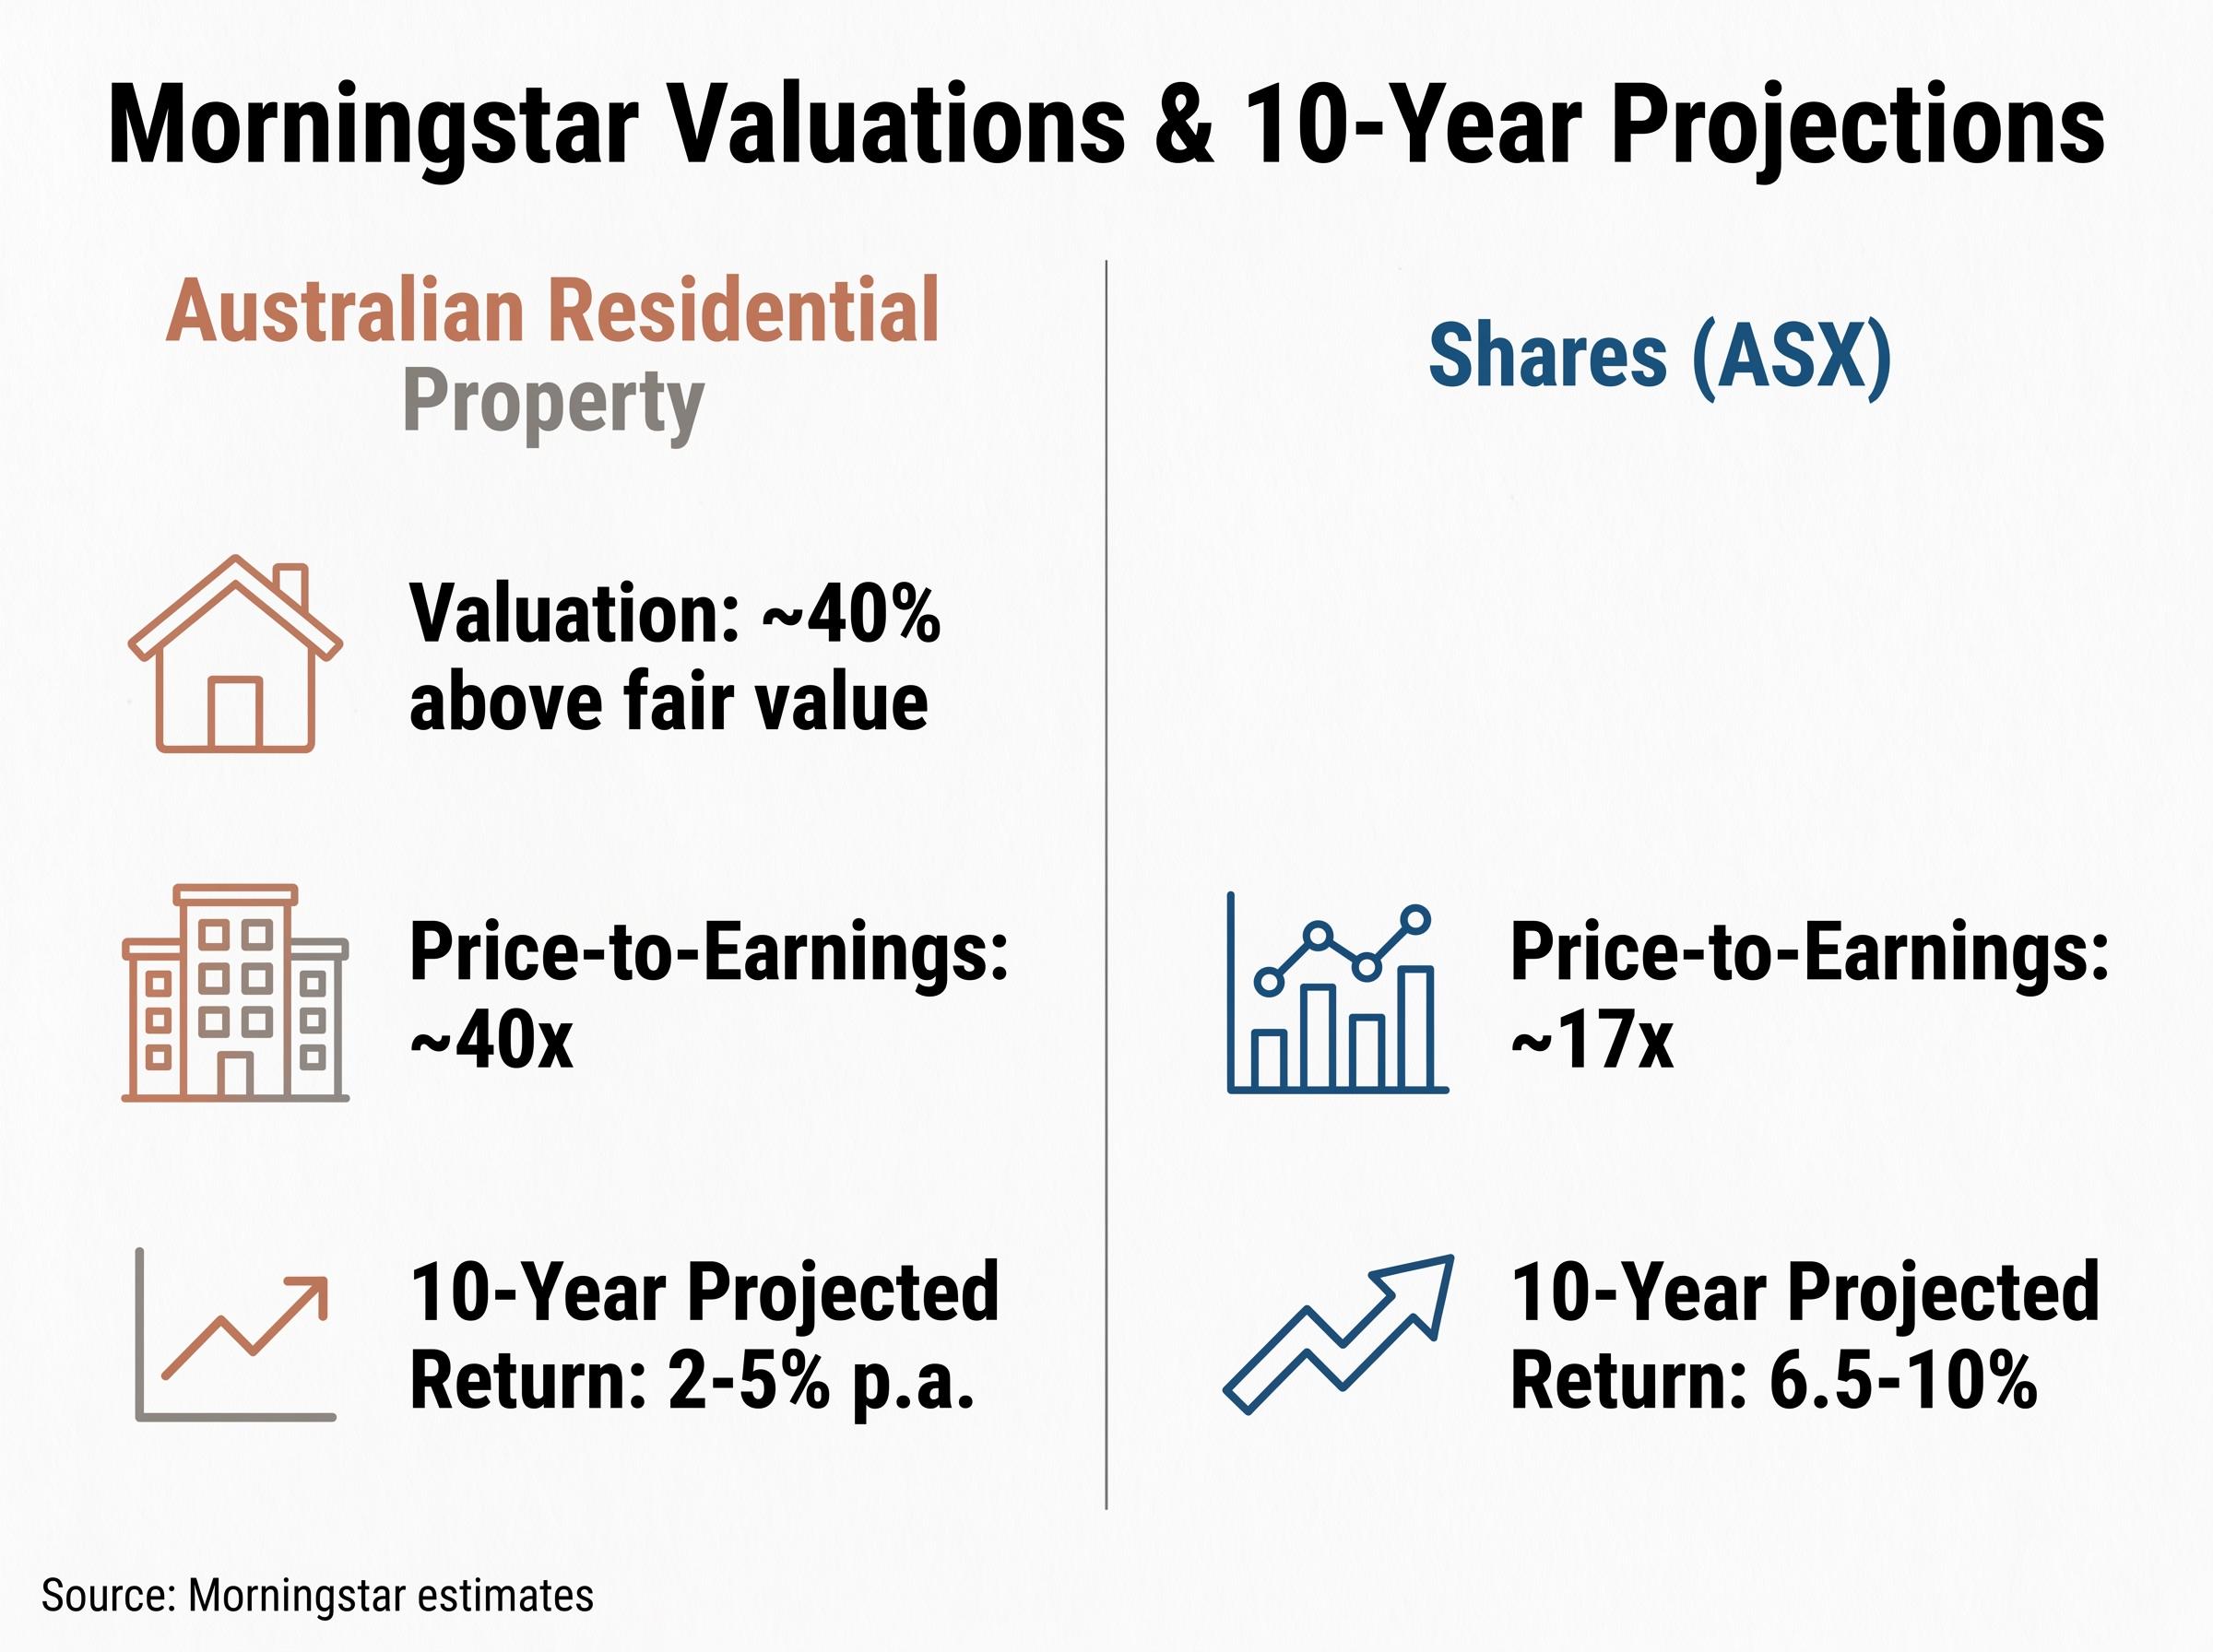
- Morningstar estimates Australian residential property sits approximately 40% above fair value, with a price-to-earnings ratio of roughly 40x versus the ASX at approximately 17x.
- Gross rental yields in many markets sit below both the cash rate and inflation, meaning income returns are weak relative to alternatives.
- Morningstar’s forward 10-year projection of 2-5% p.a. suggests that recent cyclical price growth does not resolve the structural return outlook.
- BlackRock has characterised REITs and real estate as particularly sensitive to RBA rate and inflation dynamics in the current cycle.
Share volatility as the admission price
The ASX 200’s long-term average of approximately 8.25% p.a. is an average across years that included severe drawdowns. It is not a steady annual return delivered in smooth increments.
- Short-term volatility, including periods where the market falls 20% or more, is the structural mechanism through which the long-run premium is earned.
- Investors who exit during drawdowns lock in losses and forfeit the recovery that historically follows.
- Volatility is not a defect of share investing. It is the price of admission for the long-run return.
Cash and inflation risk
Cash feels stable, and in nominal terms it is. The risk is invisible in account statements but real in purchasing power.
- If the cash rate falls below the rate of inflation, real purchasing power erodes despite the account balance remaining steady or growing.
- Cash’s current competitiveness (up to 5.65% p.a.) is cyclical, not structural. In prior rate cycles, cash returns sat well below inflation for extended periods.
- Nominal stability can mask real-terms decline, a risk that is easy to overlook precisely because the account balance never turns red.
The relationship between cash returns and inflation is not static: in the years immediately preceding the current rate cycle, the RBA cash rate sat well below headline CPI for an extended period, producing negative real returns for savers who treated high-interest accounts as a complete investment strategy rather than a liquidity reserve.
How to use the risk-return framework in practice
Understanding the spectrum is useful. Connecting it to personal circumstances is where the framework becomes actionable.
Three variables should govern where an individual investor sits on the risk-return spectrum:
- Risk tolerance: the emotional and financial capacity to absorb losses without being forced to sell at an unfavourable time. This includes both the psychological comfort with seeing account balances decline and the practical ability to sustain a loss without needing the funds immediately.
- Investment time horizon: longer horizons can absorb more volatility because they allow time for recovery from drawdowns. An investor with 20 years before retirement occupies a different position from one with 3 years.
- Financial objectives: what the money needs to do and by when. Capital preservation for a house deposit in 2028 demands a different risk profile from long-term wealth accumulation for retirement in 2046.
The 2026 environment offers a concrete illustration. With cash and bonds temporarily offering competitive rates (5.65% and 5.02% respectively), a short-horizon investor with low risk tolerance may find cash or bonds appropriate in a way that would not have been true in 2021, when savings rates sat well below 2%. A longer-horizon investor comparing those same rates against the ASX’s projected 10-year return of 6.5-10% may reach a different conclusion.
Systematic investing strategies, including regular dollar-cost averaging into diversified index products, are particularly relevant in environments where asset class return premiums are compressed, because they remove the timing decisions that most often produce reactive, emotion-driven outcomes during periods of elevated volatility.
Higher risk is not inherently good or bad. It is appropriate or inappropriate relative to the investor’s specific circumstances, time horizon, and objectives.
Individual circumstances, tax treatment, and financial goals require professional advice before acting on general information. ASIC’s MoneySmart provides official Australian investor guidance and is a recommended starting point for further education on risk, asset allocation, and investment planning.
The risk you take is the return you earn: a framework worth keeping
The risk-return trade-off is not a warning against investing. It is a map for making deliberate choices across the four asset classes.
Cash and bonds offer stability and income, with returns constrained by the narrow range of their outcomes. Property and shares offer long-run growth potential, accompanied by the wider outcome ranges, and the specific risk mechanisms, that make those returns possible.
The 2026 environment makes this framework more useful, not less. Elevated cash and bond rates, structurally overvalued property, and a sharemarket with a proven long-run premium all sit side by side, and the differences between them are smaller than usual. That compression demands sharper thinking about where each dollar is positioned and why.
For readers interested in how these risk-return dynamics are reshaping actual investor behaviour across generational cohorts, our full explainer on Australian ETF market trends examines why international ETFs overtook domestic ETFs as the most purchased category in Q1 2026, how millennials and Gen Z are allocating across equity and index products, and what the structural shift away from ASX home bias implies for domestic asset class exposure.
The question worth asking is not whether risk is good or bad. It is whether the risk being taken matches the time horizon and objectives of the person taking it. Investors considering changes to their positioning should consult a qualified financial professional before acting.
Further guidance on Australian investor education is available through ASIC’s MoneySmart platform.
This article is for informational purposes only and should not be considered financial advice. Investors should conduct their own research and consult with financial professionals before making investment decisions. Past performance does not guarantee future results.