Fed Holds Rates but Dot Plot Signals a Hike Before Year-End
22 mins ago

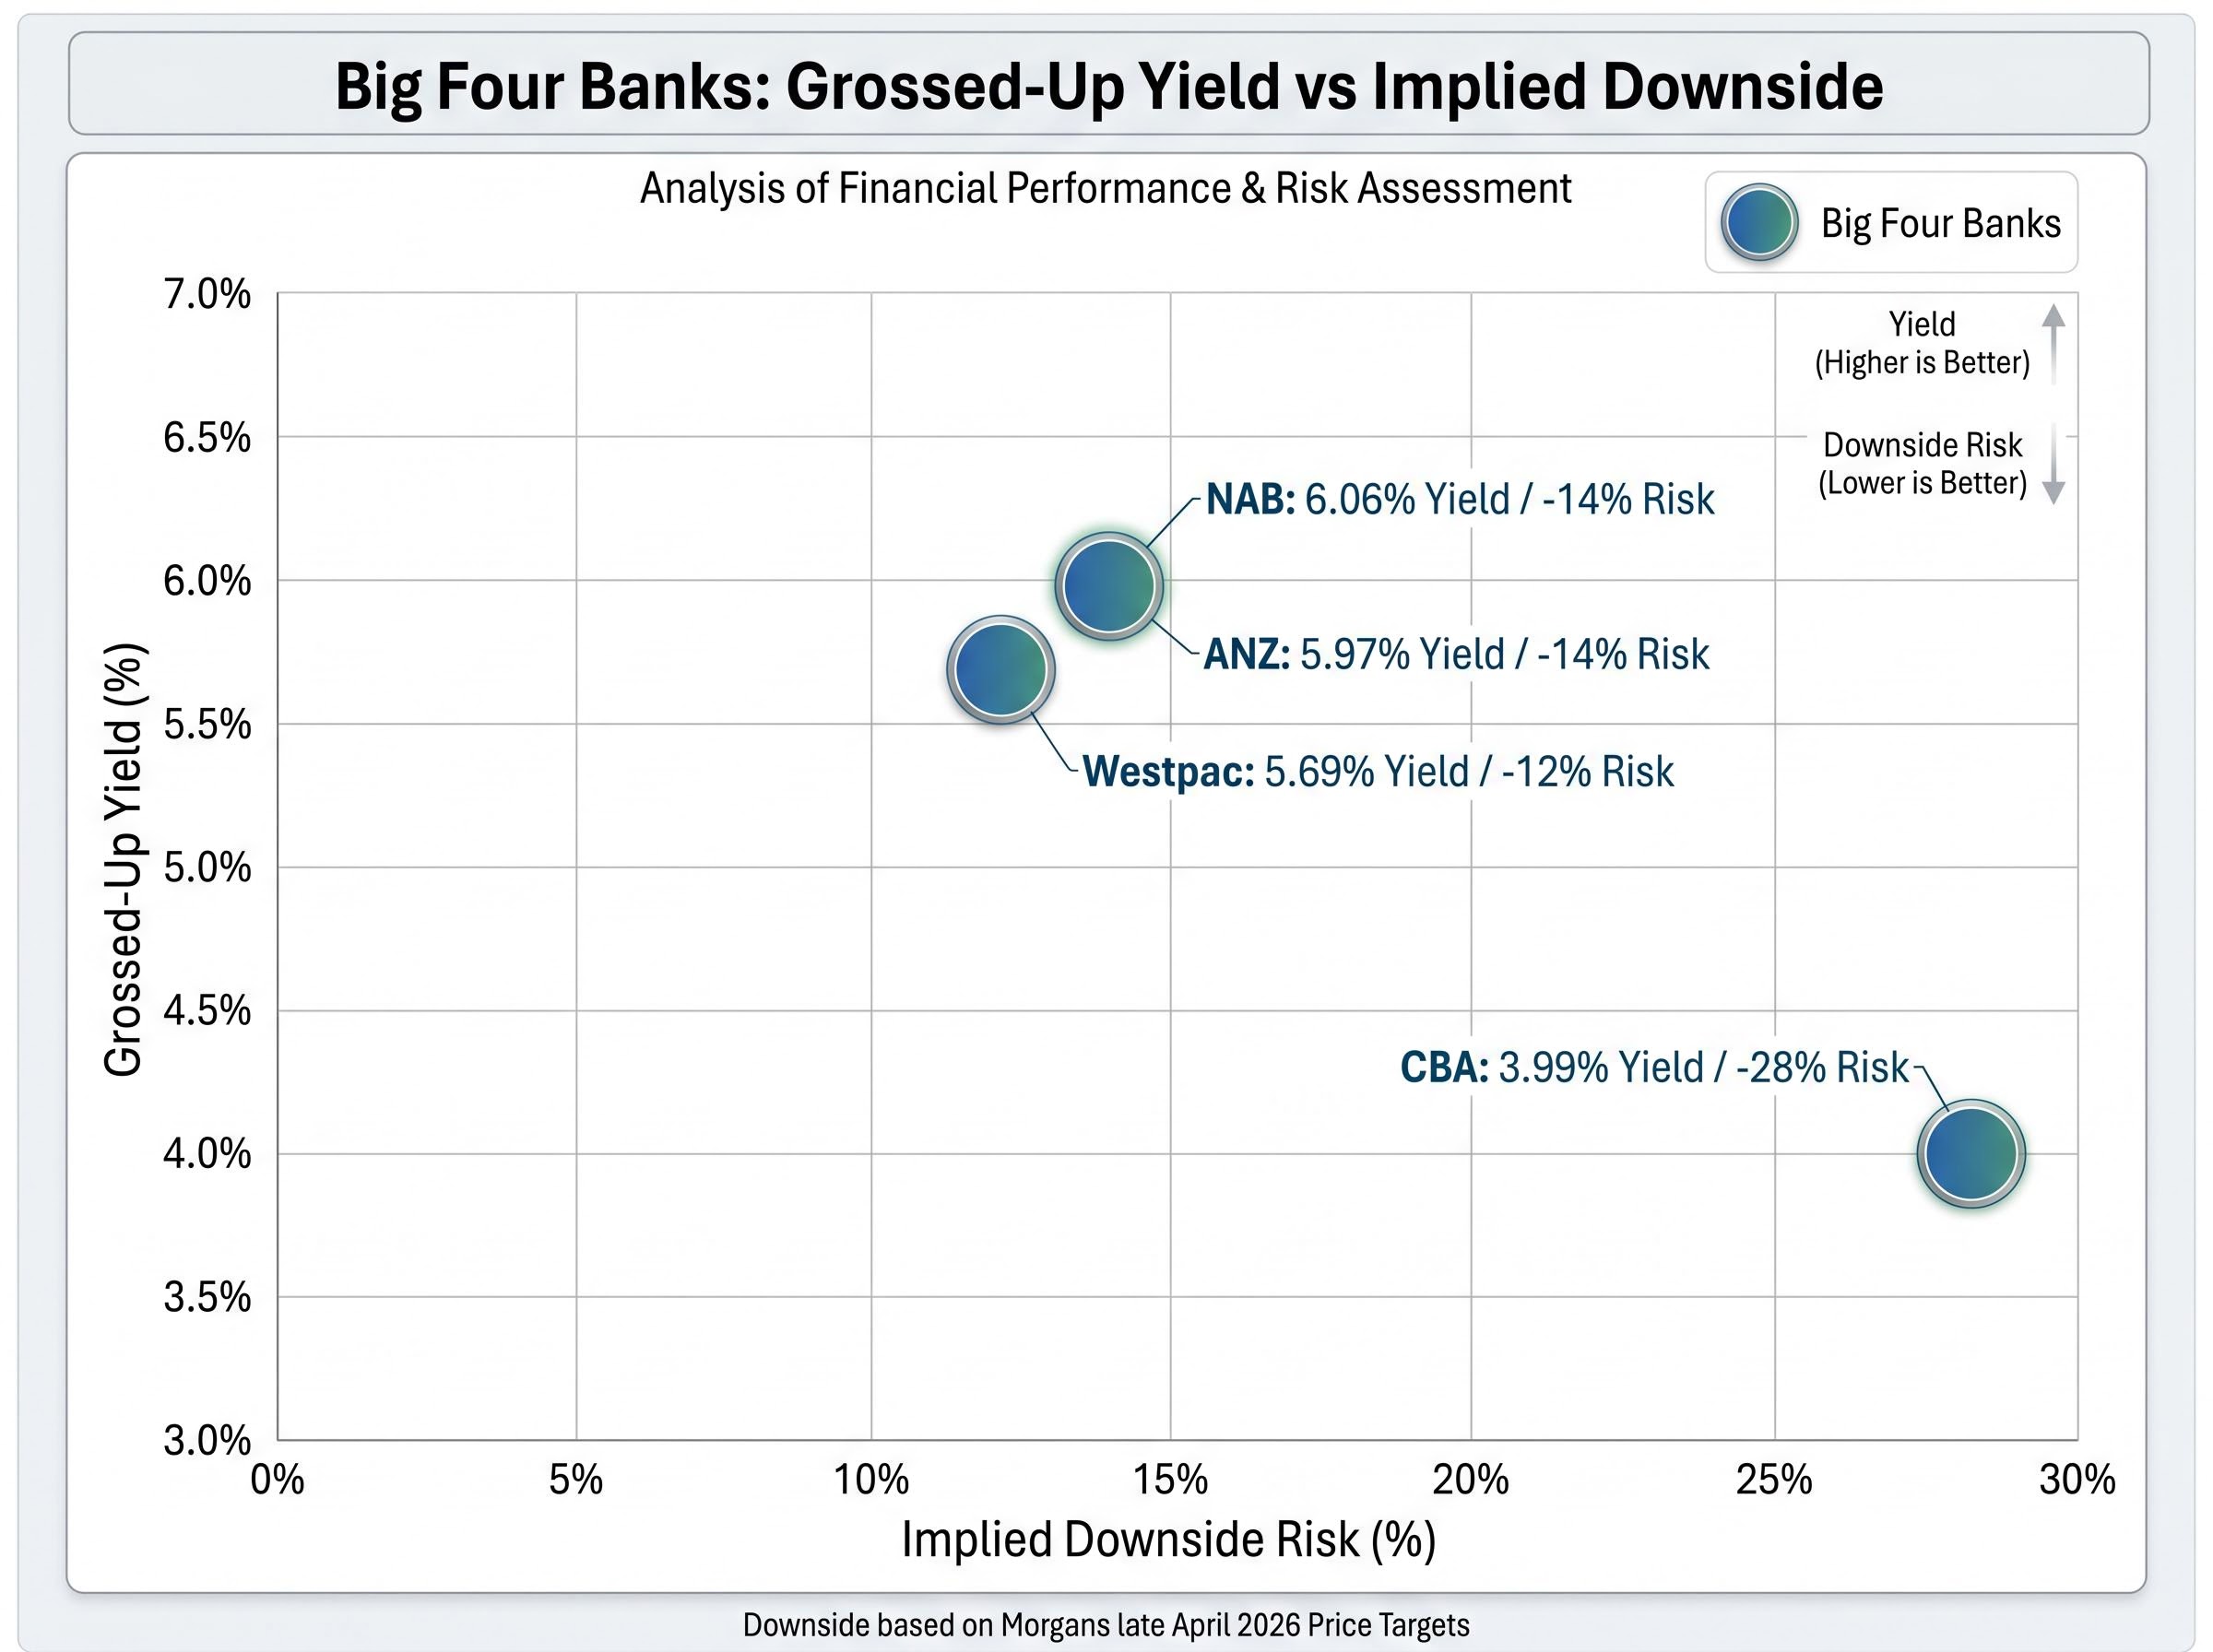
Morgans has placed sell ratings on all four big four bank stocks, with implied downside ranging from 12% to 28% from current prices. For income investors, that raises an uncomfortable question: do yields of 4% to nearly 5% justify sitting through potential capital losses while waiting for the next dividend cheque?
All four major bank stocks have pulled back alongside the broader ASX 200 in late April 2026, but the dividend picture remains intact for now. With H1 FY26 results from ANZ, NAB, and Westpac due around May 2026, the next few weeks will either validate or complicate the income case. The RBA’s second consecutive 25 basis point rate hike in March 2026, lifting the cash rate to 4.10%, adds a further layer of uncertainty around earnings and payout coverage.
The RBA’s March 2026 monetary policy decision confirmed the 25 basis point increase to 4.10 per cent, with the Board’s statement flagging that the rate environment remains a live factor in assessing the earnings outlook for deposit-funded institutions such as the major banks.
What follows is an examination of the current trailing yields, grossed-up returns, forward dividend per share (DPS) forecasts through FY27, and payout sustainability signals for each bank. The aim is to give income-focused investors a clear framework for weighing ASX bank dividend appeal against near-term capital risk.
The share price weakness across the big four over the five trading days ending late April 2026 tracked the broader market rather than anything bank-specific. The ASX 200 fell approximately 2% over that window. CBA dropped roughly 3.24%, ANZ shed about 2.6%, NAB pulled back approximately 1.9%, and Westpac was the steadiest, declining around 0.8%.
That is the market-wide pressure side of the equation. The other side is what Morgans sees from here:
Those figures change the arithmetic for anyone holding these stocks primarily for income. A 4% trailing yield looks different when a broker consensus is pricing in double-digit capital erosion. The uncomfortable dynamic is that the very price falls producing those sell signals are also the mechanism pushing these yields toward their most attractive levels in years. Whether the income compensates adequately for the capital risk is the question this analysis sets out to answer.
The analyst picture behind the sell ratings across the big four is not uniform: ANZ carries a buy-skewed consensus underpinned by post-Suncorp acquisition benefits and a CET1 ratio of 12.2%, while CBA’s most extreme bear case implies a potential 50.5% decline, confirming that capital adequacy concerns are not what is driving the downgrades.
The raw yield numbers, calculated using 30 April 2026 closing prices and FY25 full-year DPS, separate into two tiers. ANZ and NAB sit above 4% on a cash basis; Westpac sits just below; CBA trails significantly.
| Bank | FY25 DPS | Share Price (30 Apr) | Cash Yield | Franking | Grossed-Up Yield |
|---|---|---|---|---|---|
| CBA | $4.85 | $173.66 | 2.79% | 100% | ~3.99% |
| NAB | $1.70 | $40.08 | 4.24% | 100% | ~6.06% |
| ANZ | $1.66 | $36.18 | 4.59% | 70% | ~5.97% |
| Westpac | $1.53 | $38.43 | 3.98% | 100% | ~5.69% |
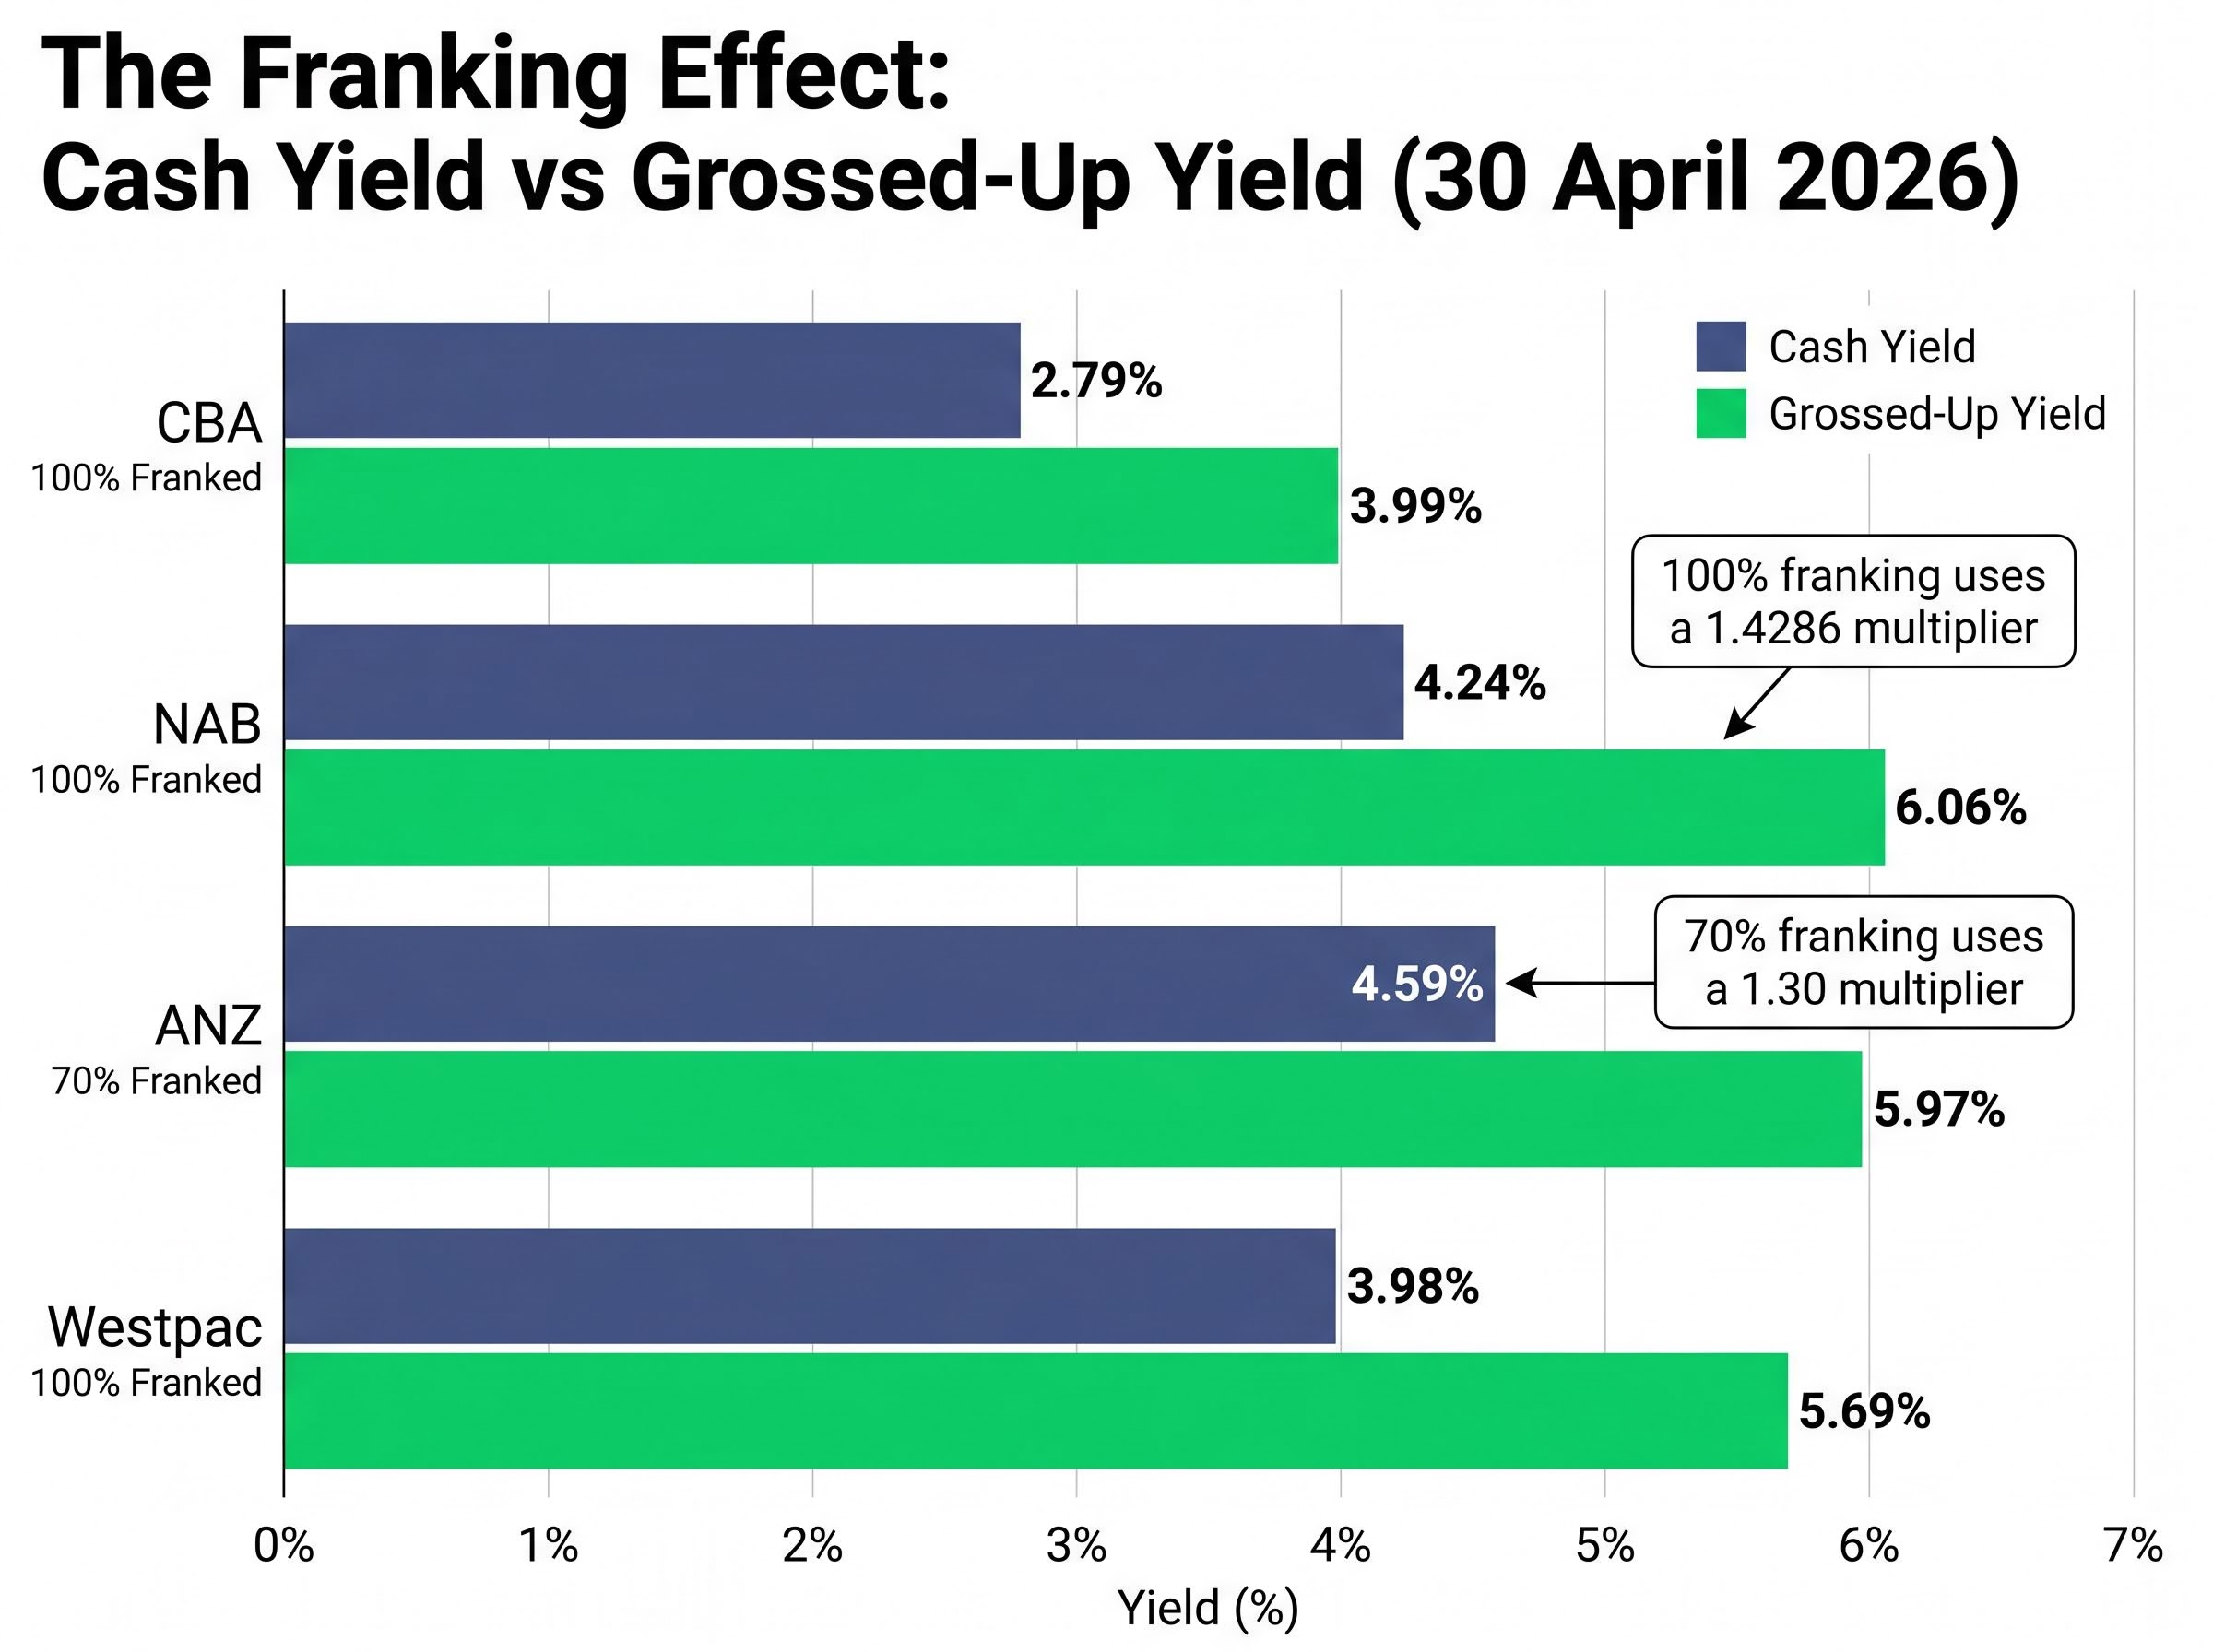
The table tells one story at headline level: ANZ offers the highest cash yield at 4.59%. But franking complicates the ranking. CBA, NAB, and Westpac are fully franked, meaning each dollar of dividend carries a full 30% corporate tax credit. ANZ is only 70% franked, which reduces its grossed-up advantage.
Once the franking adjustment is applied, NAB emerges as the strongest income proposition on a pre-tax basis, not ANZ.
NAB’s grossed-up yield of approximately 6.06% is the highest of the four on a tax-adjusted basis, despite ANZ carrying the higher headline cash yield. For Australian resident investors who can utilise franking credits, the cash yield comparison alone is misleading.
The concept starts with what the investor actually receives. When a company pays a fully franked dividend, it has already paid 30% corporate tax on the profits behind that distribution. The investor receives not just the cash payment but also a tax credit representing that 30% already paid. Depending on the investor’s marginal tax rate, the credit either reduces their tax bill or, for some superannuation structures, generates a cash refund.
The ATO guidance on franking credit refunds sets out the eligibility criteria and claim process for individuals and superannuation funds receiving excess imputation credits, including the cash refund mechanism that makes fully franked dividends particularly valuable for SMSF investors in pension phase.
The grossed-up yield captures this by expressing the total pre-tax value of the dividend as a percentage of the share price. Calculating it involves two steps:
That difference in multiplier is why ANZ’s cash yield of 4.59% grosses up to approximately 5.97%, while NAB’s lower cash yield of 4.24% grosses up to approximately 6.06%. Applying the full 1.4286 multiplier to ANZ would produce a figure around 6.7%, which would overstate the real pre-tax return for investors.
For SMSF investors in pension phase, franking credits are received as a cash refund, making fully franked stocks materially more valuable in that structure than the cash yield figure alone suggests.
Franking credit compounding can widen the gap between a price return and a total return substantially over multi-year holding periods; a CBA position entered in April 2024 illustrates this effect clearly, with four fully franked dividend payments and reinvestment lifting an estimated 52.5% price gain into a total return of approximately 72%.
The reassuring headline is that Morgan Stanley’s base case forecasts no dividend cuts across the big four through FY27. CBA is the only name with meaningful projected growth, rising from 485 cents (FY25) to 555 cents (FY27). NAB grows modestly from 170 to 177 cents. ANZ is flat at 166 cents across all three years. Westpac barely moves, sitting at 152-153 cents.
The less comfortable detail sits underneath those projections.
| Bank | FY25e DPS (c) | FY26e DPS (c) | FY27e DPS (c) | Payout Ratio (approx.) | Cut Risk Flag |
|---|---|---|---|---|---|
| CBA | 485 | 515 | 555 | ~79% | Lowest |
| NAB | 170 | 171 | 177 | ~76% | Moderate |
| Westpac | 152 | 152 | 153 | ~76% | Higher |
| ANZ | 166 | 166 | 166 | ~73% | Higher |
Average payout ratios across the big four sit at approximately 75%, up around 5 percentage points from FY22 levels. Both ANZ (approximately 73%, above its stated target of 60-65%) and Westpac (approximately 76%, above its target of 65-75%) carry the highest cut risk in stress scenarios, according to Morgan Stanley’s analysis. These are not forecasts of imminent reductions, but they signal that the margin of safety around current distributions is thinner than it was two years ago.
Note that Morgan Stanley’s forward DPS forecasts have not been independently verified against a live source and should be treated as indicative.
The H1 FY26 results for ANZ, NAB, and Westpac, expected around May 2026, will provide the first hard data on whether current payout ratios are sustainable. Interim dividend announcements will land alongside updated earnings guidance, offering the first look at whether net interest margin (NIM) pressure from the March 2026 RBA hike is feeding through to payout coverage.
One specific open question concerns Westpac’s FY26 DPS: Morgan Stanley estimates $1.52, while an alternative forecast sits at $1.605. The May result will settle that discrepancy and sharpen the forward income picture for Westpac holders.
Westpac’s Q1 FY26 earnings added a useful data point to the payout sustainability question: statutory net profit of $1.9 billion represented 5% growth on the H2 FY25 average, and a CET1 ratio of 12.3% sitting well above APRA minimums supports the view that capital is not the binding constraint on the dividend.
As of April 2026, competitive term deposit rates from non-major bank providers range from approximately 4.5% to 5.70% per annum. Against that benchmark, CBA’s grossed-up yield of approximately 3.99% falls below even the lower end of the range. NAB at 6.06% and ANZ at 5.97% sit above the upper end. Westpac at 5.69% is broadly in line with the top-tier deposit offerings. In a pointed irony, CBA’s own term deposit rates start as low as approximately 1.10% on some terms.
| Income Option | Approx. Yield | Franking / Notes | Risk Considerations |
|---|---|---|---|
| NAB (grossed-up) | ~6.06% | Fully franked | Moderate payout ratio risk; capital downside flagged |
| ANZ (grossed-up) | ~5.97% | 70% franked | Higher cut risk; partial franking |
| Westpac (grossed-up) | ~5.69% | Fully franked | Higher cut risk in stress scenarios |
| Term deposits (non-major) | 4.5-5.70% | Unfranked; taxed as income | No capital risk; no growth upside |
| Woodside | ~6.1% | Variable; commodity-linked | Earnings tied to oil and gas prices |
| Telstra | ~4.3% | Partially franked | Defensive; lower growth |
| CBA (grossed-up) | ~3.99% | Fully franked | Largest implied downside; lowest yield |
For investors currently overweight bank shares, analysts have flagged several diversification options worth consideration:
One bullish outlier worth noting: ANZ carries a highest analyst price target of $43, implying approximately 19% upside from current prices, a case that would transform the total return calculus if it eventuated.
The four big four banks present four distinct income propositions at current valuations, not a single trade.
Morgan Stanley’s base case holds that no cuts are likely through FY27. Morgans disagrees on valuation grounds, with sell ratings across all four. For conservative income investors who prioritise payout certainty over headline yield, that tension matters.
For SMSF investors in pension phase, the fully franked structures of CBA, NAB, and Westpac make their effective yields materially higher than the cash figures suggest. This investor segment receives franking credits as cash refunds, which can add meaningfully to the total income return.
The May 2026 results season for ANZ, NAB, and Westpac is the logical moment for income investors to revisit positions. It will provide the first hard data on whether FY26 earnings can support the current payout projections.
The income case for big four bank dividends is strongest for NAB, Westpac, and ANZ on a grossed-up basis at current prices. But the capital risk flagged by Morgans and others means holding should not be treated as a passive decision.
The May 2026 H1 results season will sharpen the picture. Interim dividend announcements from ANZ, NAB, and Westpac will either confirm payout sustainability or raise flags that prompt a reassessment. If payout ratios hold or improve alongside stable NIM guidance, the income thesis firms up. If earnings disappoint and coverage ratios deteriorate, the flat-to-modest DPS trajectory becomes harder to defend.
Income investors with heavy bank exposure may want to revisit the yield and payout ratio data after the May 2026 reporting period to update their own income calculus. Whether diversification into alternative income names, such as Telstra or Woodside, provides a better risk-adjusted income outcome at current prices is a question worth considering alongside the bank-specific results.
For income investors who want to hold capital in reserve while reassessing bank exposure after the May results, our full explainer on ASX ETFs for Australia’s inflation environment covers cash ETFs yielding 3.90%-4.24% alongside fixed income and global equity options, assessed against the current 4.10% RBA cash rate benchmark.
This article is for informational purposes only and should not be considered financial advice. Investors should conduct their own research and consult with financial professionals before making investment decisions. Past performance does not guarantee future results. Financial projections are subject to market conditions and various risk factors.
A grossed-up yield reflects the total pre-tax value of a dividend by including the franking credits attached to it, which represent corporate tax already paid on the profits. For Australian investors, particularly SMSFs in pension phase, this figure is more meaningful than the cash yield because franking credits can reduce your tax bill or be received as a cash refund.
On a cash basis, ANZ offers the highest yield at approximately 4.59% based on April 2026 prices, but on a grossed-up basis NAB leads at approximately 6.06% because it is fully franked while ANZ is only 70% franked.
Morgan Stanley's base case forecasts no dividend cuts across the big four through FY27, but both ANZ and Westpac are flagged as carrying higher cut risk in stress scenarios because their payout ratios of approximately 73% and 76% respectively sit above their own stated target ranges.
Competitive term deposit rates from non-major bank providers range from approximately 4.5% to 5.70% per annum as of April 2026, meaning NAB and ANZ's grossed-up yields of 6.06% and 5.97% sit above that range, while CBA's grossed-up yield of approximately 3.99% falls below it.
The H1 FY26 results from ANZ, NAB, and Westpac, expected around May 2026, will be the first hard test of whether current payout ratios are sustainable, with interim dividend announcements and net interest margin guidance offering clarity on whether the March 2026 RBA rate hike is pressuring earnings coverage.