Bendigo and Adelaide Bank shares surged more than 7% in a single session on 9 April 2026, one of the largest single-day moves the regional lender has produced in recent memory. The catalyst was a dual announcement: unaudited Q3 FY2026 figures showing cash earnings up 7.6%, and the launch of Productivity Programme Phase 2 anchored by two multi-year deals with global technology firms. Together, the results and the restructure signal that BEN is pursuing a materially different cost and capability profile than it has operated under in recent years.
What follows unpacks what the Q3 numbers actually show, what the Productivity Programme Phase 2 means in practice, why the ASX BEN share price gave back most of its gains in the weeks that followed, and what the combination of signals means for investors watching the stock heading into the second half of FY2026.
A quarter of broad-based improvement across every major metric
The standout figure from BEN’s Q3 FY2026 trading update is the one that matters most to earnings-focused investors: $137.9 million in cash earnings, up 7.6% on the H1 FY2026 quarterly average. Statutory net profit after tax came in at $109.4 million.
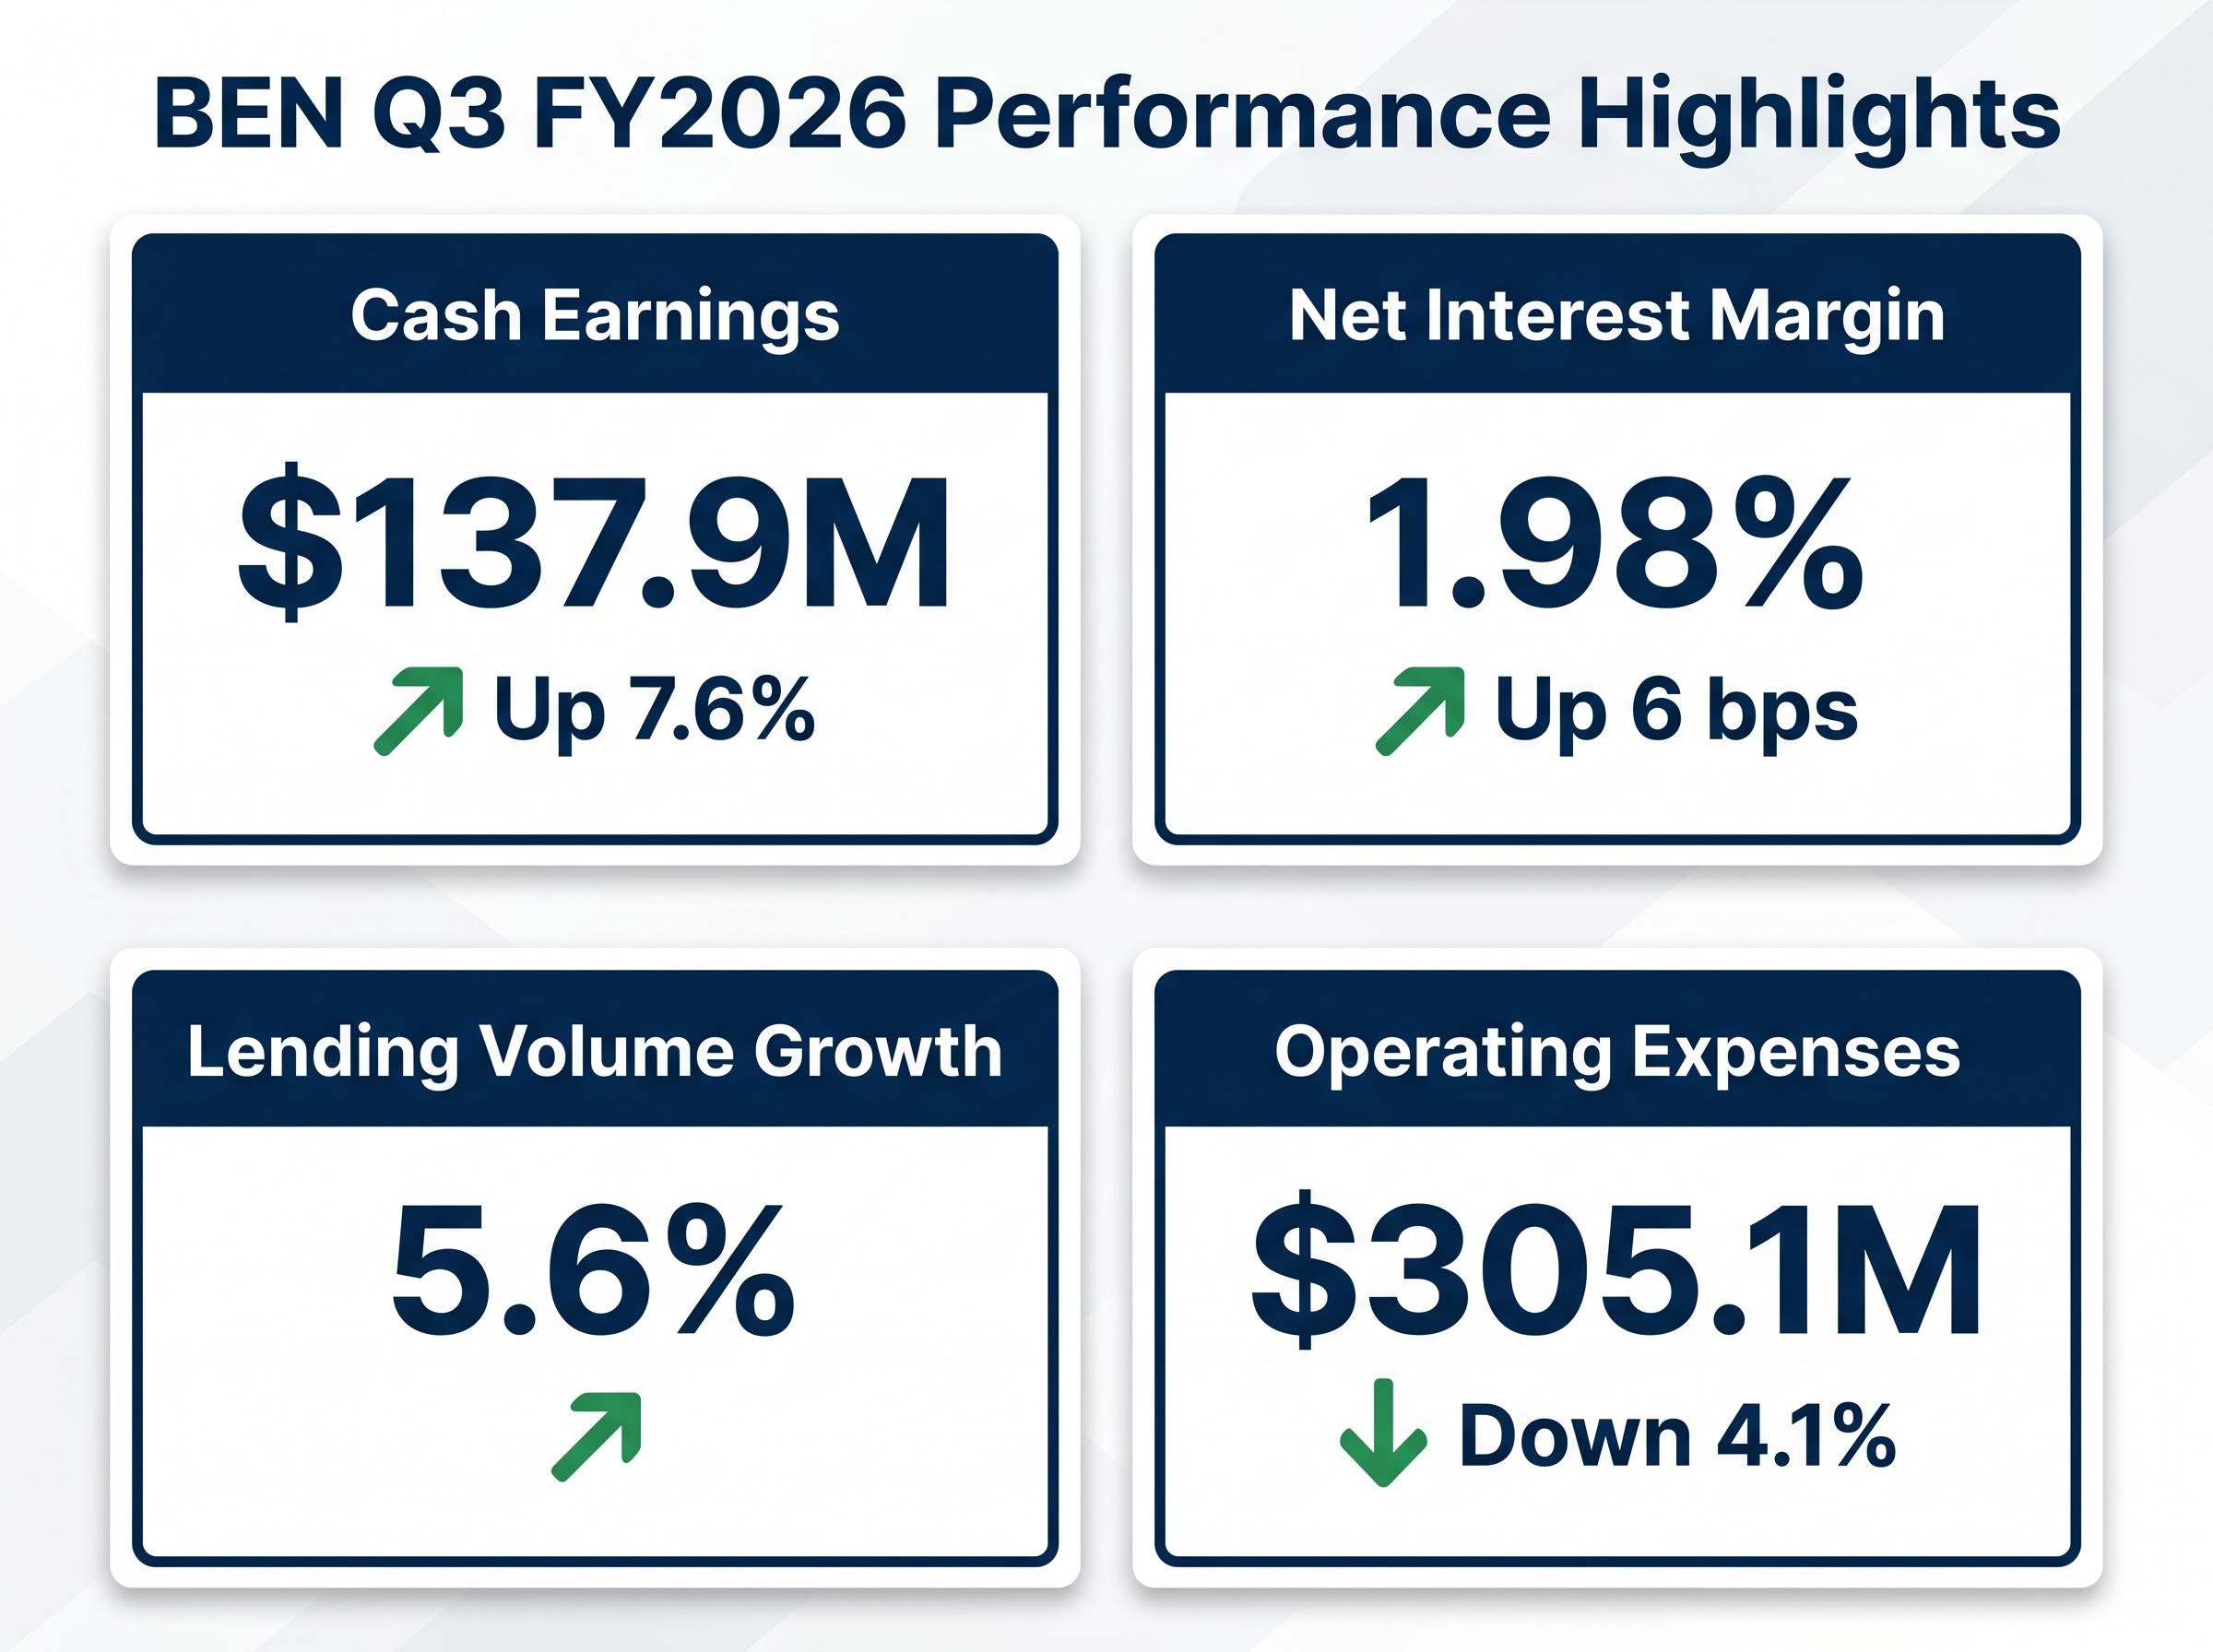
Q3 Cash Earnings: $137.9M Up 7.6% on the H1 FY2026 quarterly average, representing the strongest single-quarter result in the current financial year.
What makes the quarter notable is the breadth of improvement. Net interest margin (NIM) expanded 6 basis points to 1.98%. Lending volumes grew 5.6% for the quarter. According to the BEN ASX announcement of April 9, 2026, operating expenses fell to $305.1 million, a reduction of 4.1%. Margin, volume, and costs all moved in the right direction simultaneously, an uncommon combination for a regional bank operating in a fiercely competitive mortgage environment.
| Metric | Q3 FY2026 Result | Direction vs Prior Period |
|---|---|---|
| Cash Earnings | $137.9M | Up 7.6% on H1 quarterly average |
| Statutory NPAT | $109.4M | Reported (unaudited) |
| Net Interest Margin | 1.98% | Up 6 basis points QoQ |
| Lending Volume Growth | 5.6% | Quarterly increase |
| Operating Expenses | $305.1M | Down 4.1% |
For investors assessing BEN, this breadth of improvement is the most meaningful takeaway. When earnings, margin, lending, and costs all improve together in a single quarter, it suggests genuine operational momentum rather than a one-off tailwind.
When big ASX news breaks, our subscribers know first
What net interest margin expansion of 6 basis points actually means for BEN
What NIM is and why it commands attention
Net interest margin is the spread between what a bank earns on its loans and what it pays on deposits, expressed as a percentage of interest-earning assets. It is the single most watched profitability metric in Australian banking because it captures, in one number, how effectively a bank is pricing both sides of its balance sheet.
A higher NIM means a wider spread between earnings and costs on every dollar of lending. For a regional lender like BEN, where the loan book is the dominant revenue engine, small movements in NIM flow directly to the bottom line.
Why 1.98% matters for BEN specifically
BEN’s NIM improved to 1.98%, up 6 basis points from the prior quarter. Three factors drove the expansion:
- Rate repricing: Higher rates on variable-rate loans flowing through faster than deposit cost increases
- Deposit pricing discipline: Measured repricing of savings products relative to the cash rate
- Loan mix: A shift toward higher-margin lending categories within the book
For context, Commonwealth Bank reported a NIM of approximately 2.04%, placing BEN within striking distance of the largest domestic lender. The gap has narrowed, though BEN remains below the major bank average.
The Australian Banking Association’s customer trends analysis covering 2025 highlights intensifying competition in the mortgage market as a structural feature of the current environment, with NIM pressure from deposit repricing particularly pronounced among regional lenders competing against the majors for retail book share.
Why the RBA rate cycle matters more for regional banks than for the majors
The RBA cash rate stood at 4.1% as of late March 2026, with further hikes anticipated and a projected peak near 4.85%. Regional banks like BEN carry a proportionally larger retail and mortgage book relative to total assets than diversified majors with capital markets and institutional lending income. That concentration makes NIM more sensitive to the cash rate in both directions.
The dual nature of the rate cycle is worth noting: higher rates support NIM expansion but also raise credit stress risk in BEN’s core regional and retail lending markets.
Productivity Programme Phase 2 and the logic behind outsourcing to technology partners
BEN’s Productivity Programme Phase 2, announced alongside the Q3 results on 9 April 2026, is built around two new multi-year partnerships that sit within a deliberately constructed technology ecosystem:
- Google partnership (announced November 2025): Cloud infrastructure and data capability foundation
- A multi-year technology services agreement covering IT delivery and artificial intelligence capability
- A multi-year business operations agreement covering process optimisation and risk management
The sequencing matters. The Google deal established the cloud foundation; the subsequent technology and operations agreements layer operational and technology transformation on top of it. This is a constructed ecosystem, not a series of ad hoc vendor deals.
The Infosys and Genpact partnerships that underpin Phase 2 include a seven-year agreement with Infosys covering IT delivery and AI capability, and a six-year agreement with Genpact covering process optimisation and risk management, with business and agribusiness lending accelerating to 12.7% annualised growth in Q3 adding further momentum to the programme’s rationale.
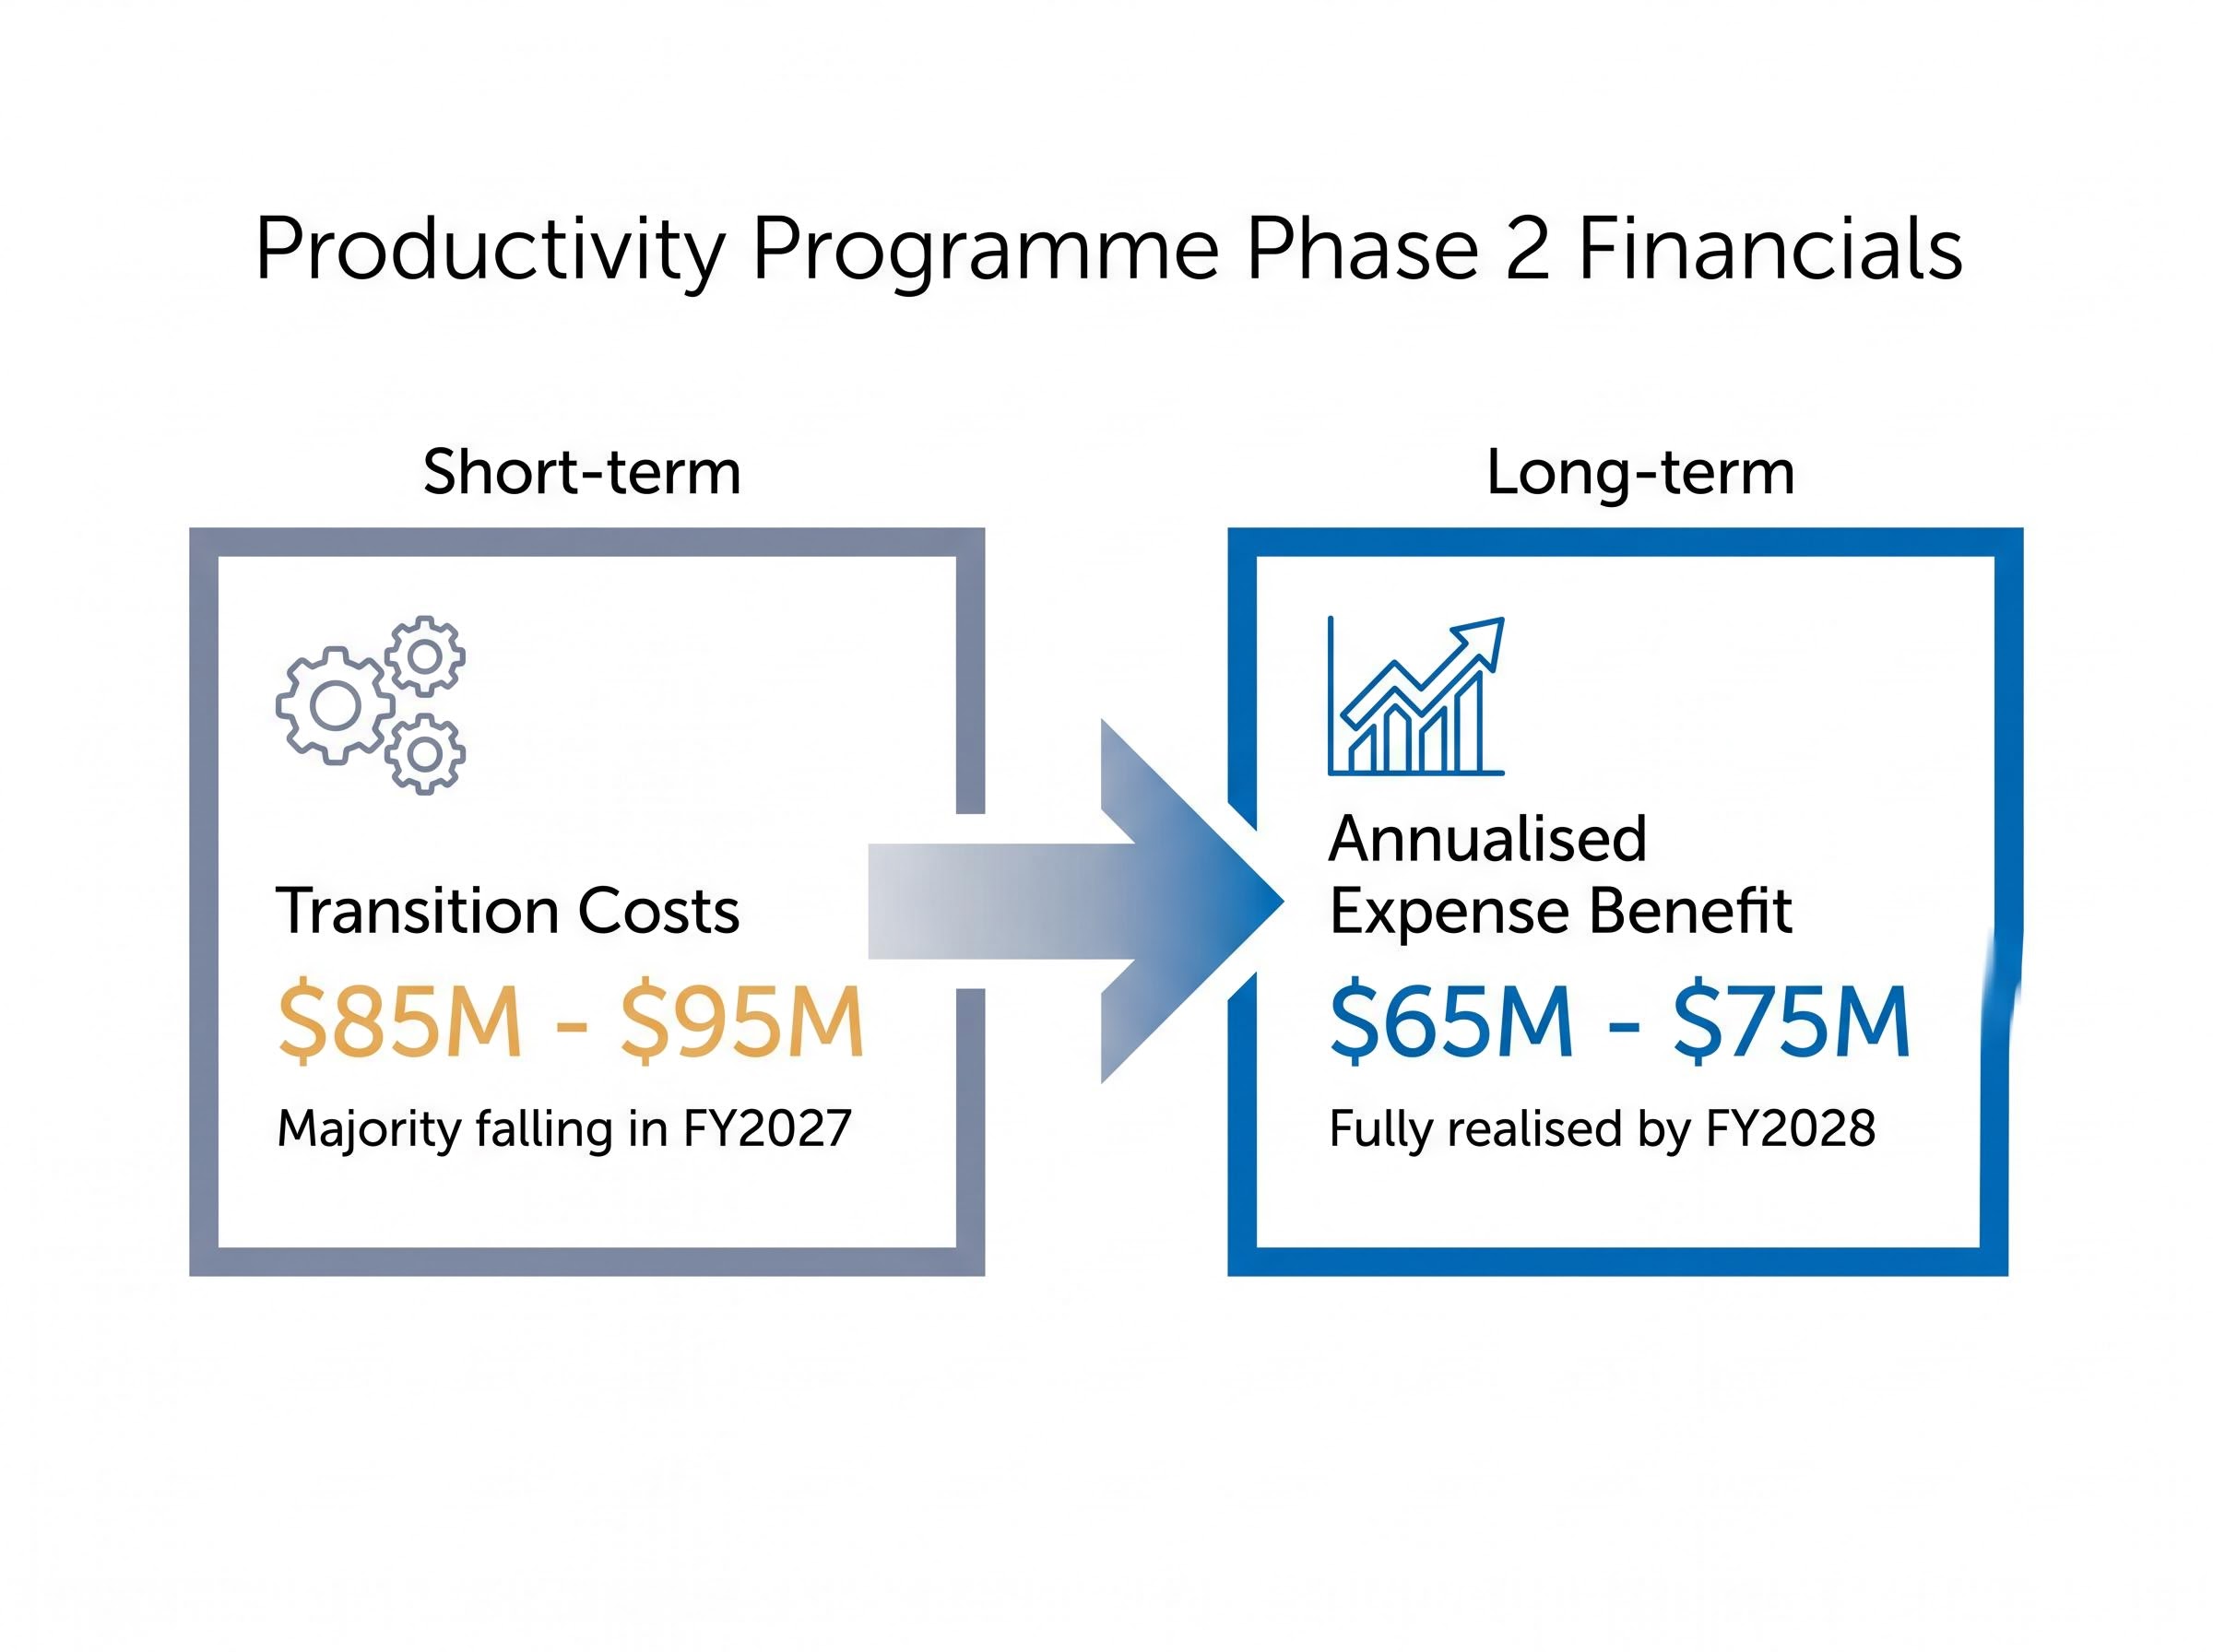
The financial targets give the programme credibility. BEN expects an annualised expense benefit of $65 million to $75 million, fully realised by FY2028. Transition costs are estimated at $85 million to $95 million, with the majority falling in FY2027.
| Financial Commitment | Amount |
|---|---|
| Transition Costs | $85M-$95M (majority in FY2027) |
| Annualised Expense Benefit | $65M-$75M (fully realised by FY2028) |
CEO Richard Fennell acknowledged the human impact of the programme, stating the bank is committed to managing the staff transition with care and respect.
The savings target is significant. If delivered, $65 million to $75 million in annualised cost reduction would represent a meaningful structural shift in BEN’s expense base, supporting the bank’s stated commitment to keeping business-as-usual expenses growing no faster than inflation across the economic cycle.
The share price surge and the fade: reading what the market actually decided
The first act was straightforward. BEN shares moved from approximately $10.45 pre-announcement to $11.34 at the close on 9 April, a gain of roughly 7-8%. The dual catalyst of strong Q3 results and a credible cost transformation programme drove the kind of single-session move regional bank investors rarely see outside of reporting season surprises.
Then came the second act. By late April, BEN had settled to approximately $10.61, giving back most of the initial gain. This retreat does not read as a rejection of the Q3 results. It reads as the market pricing in execution uncertainty: the Productivity Programme’s transition costs arrive in FY2027, and the savings do not fully materialise until FY2028.
Consensus 12-month analyst price target: $10.82 The high-end analyst target sits at $11.90. Some brokers have issued sell alerts given limited upside from current levels relative to consensus.
Three factors are weighing on sentiment after the initial pop:
- Near-term transition costs of $85 million to $95 million concentrated in FY2027
- Execution risk on the FY2028 savings timeline across three separate vendor partnerships
- Credit quality uncertainty in a rising-rate environment affecting BEN’s regional and retail mortgage book
The gap between the initial surge and the subsequent settlement is itself informative. Markets welcomed the results but are assigning a meaningful probability that the transformation period introduces near-term earnings volatility before the structural savings arrive.
The ASX bank sector rally that carried the ASX 200 Financials index up 8.87% year to date as of late April 2026 was heavily concentrated in the four majors, creating a sector backdrop where BEN’s single-session 7% move was notable partly because it occurred against a broader environment where price momentum and analyst consensus had diverged sharply across the sector.
How BEN’s Q3 compares to what regional banking peers are delivering
The most direct contrast available is on costs. Bank of Queensland (BOQ) reported H1 expense growth of approximately 6%, a trajectory moving in the opposite direction to BEN’s 4.1% reduction. On this single metric, BEN’s Q3 profile is materially stronger, and in an environment where expense management is a primary driver of regional bank re-rating, the gap is meaningful.
On margin, CBA reported a NIM of approximately 2.04%, placing BEN’s 1.98% within reach but still below the largest domestic lender. BEN’s lending growth of 5.6% for the quarter adds a volume dimension to the comparison, though without equivalent quarterly data from peers, direct volume comparisons are limited.
| Bank | NIM | Expense Trend |
|---|---|---|
| BEN | 1.98% | Down 4.1% (Q3 FY2026) |
| CBA | ~2.04% | Reference period estimate |
| BOQ | Not available | Up ~6% (H1) |
Note: BOQ and CBA figures are partial or reference-period estimates and may not reflect the most current quarter.
Readers comparing BEN against the broader peer set should be aware of three data gaps:
- Full peer NIM data for Q3 2026 is not yet comprehensively available
- Credit quality metrics across the regional bank sector have not been uniformly reported
- Sector-wide sentiment data from broker research remains incomplete for this period
ASX filings and investor relations pages for BOQ and Suncorp are the recommended sources for definitive comparisons.
Momentum is real, but the second half of FY2026 carries its own tests
Three genuine positives emerged from Q3:
- Cash earnings growth of 7.6% on the H1 quarterly average
- NIM expansion of 6 basis points to 1.98%
- Operating expense reduction of 4.1%, delivered alongside rising lending volumes
Against these sit two forward risks that will determine whether the Q3 trajectory holds:
- Transition costs of $85 million to $95 million (majority in FY2027) will begin flowing through before the $65 million to $75 million annualised savings materialise by FY2028
- The RBA’s projected peak rate near 4.85% could pressure credit quality in BEN’s regional and retail mortgage book, particularly on arrears and impairments
- BEN’s stated expense guidance, keeping business-as-usual costs growing no faster than inflation, will face its first real test as transformation spending begins
The Productivity Programme’s annualised savings target of $65M-$75M is expected to be fully realised by FY2028. The transition cost period between now and then is the key horizon for judging programme success.
The H2 FY2026 result will be the next material test. It will reveal whether BEN can sustain margin and cost discipline while absorbing the initial transformation spend, or whether the transition period softens the earnings trajectory that Q3 established.
A strong quarter that earns cautious optimism, not a re-rating
BEN’s Q3 FY2026 delivered a genuinely strong set of numbers. Cash earnings of $137.9 million, a NIM recovering to 1.98%, and a 4.1% expense reduction tell a coherent story of a regional bank building operational momentum. The Productivity Programme Phase 2 announcement adds a credible structural dimension to the cost discipline narrative.
The analyst consensus tells a more measured story. A 12-month price target of $10.82 against a current price near $10.61 implies limited near-term upside. The high-end target of $11.90 remains a possibility, but the next meaningful re-rating catalyst is likely the delivery of the first Productivity Programme savings evidence in FY2027.
For investors wanting to contextualise BEN’s $10.82 consensus target against the broader analyst landscape, our dedicated guide to Big Four analyst consensus covers the specific price targets, CET1 ratios, and valuation arguments across CBA, NAB, ANZ, and Westpac, including the extreme bear case scenarios that show how far stretched major bank valuations are relative to earnings growth expectations.
The core tension for BEN investors: Q3 demonstrated genuine operational momentum, but the Productivity Programme’s financial payoff sits on the other side of a significant transition cost period. The costs arrive first; the savings follow.
The question to track is whether the H2 FY2026 result maintains the Q3 trajectory on margin and costs as transition spending begins to flow. That result will determine whether this quarter marks the start of a structural re-rating story, or a strong quarter that stands on its own.
This article is for informational purposes only and should not be considered financial advice. Investors should conduct their own research and consult with financial professionals before making investment decisions. Past performance does not guarantee future results. Financial projections are subject to market conditions and various risk factors.