Cook Warns Memory Costs Will Force Apple Price Increases in 2026
49 mins ago

Westpac reported a $1.9 billion quarterly profit for Q1 FY26, covering the three months to December 2025, delivering 5% statutory profit growth on the H2 FY25 average. With the share price sitting at $38.43 and the RBA cash rate holding at 4.1%, the result offers the first substantive read on whether the bank’s FY26 dividend trajectory is credible or merely optimistic. The FY26 interim dividend has not yet been declared; confirmation is expected alongside the half-year results on 5 May 2026. What follows is an assessment of what the Q1 data signals about earnings sustainability, how the projected yield compares against peers and risk-free alternatives, and which specific metrics income investors should track in the May release.
The headline figure is settled: $1.9 billion in statutory net profit, up 5% on the H2 FY25 average. Strip out notable items, and the same $1.9 billion base shows 6% growth, a slightly stronger reading that points to cleaner underlying momentum.
Westpac’s official 1Q26 ASX announcement confirms the $1.9 billion statutory net profit figure, the 1.94% NIM, and the 6% growth excluding notable items, providing the primary data foundation for the earnings sustainability analysis that follows.
The 6% growth figure excluding notable items is the more informative number for dividend sustainability analysis. It strips out one-off charges and gains that do not recur, giving a closer approximation of the earnings run rate available to fund distributions.
That gap between 5% and 6% matters. When statutory profit grows more slowly than profit excluding notable items, notable items are acting as a drag. For income investors, the ex-notable-items figure is the better anchor for projecting forward earnings capacity.
The operational drivers beneath the numbers lean structural rather than opportunistic. Revenue rose 1%, powered by 2% net interest income growth, while non-interest income declined 4%. Direct-channel lending growth and institutional lending expansion suggest margin retention rather than volume-at-any-cost strategy, a distinction that supports earnings quality.
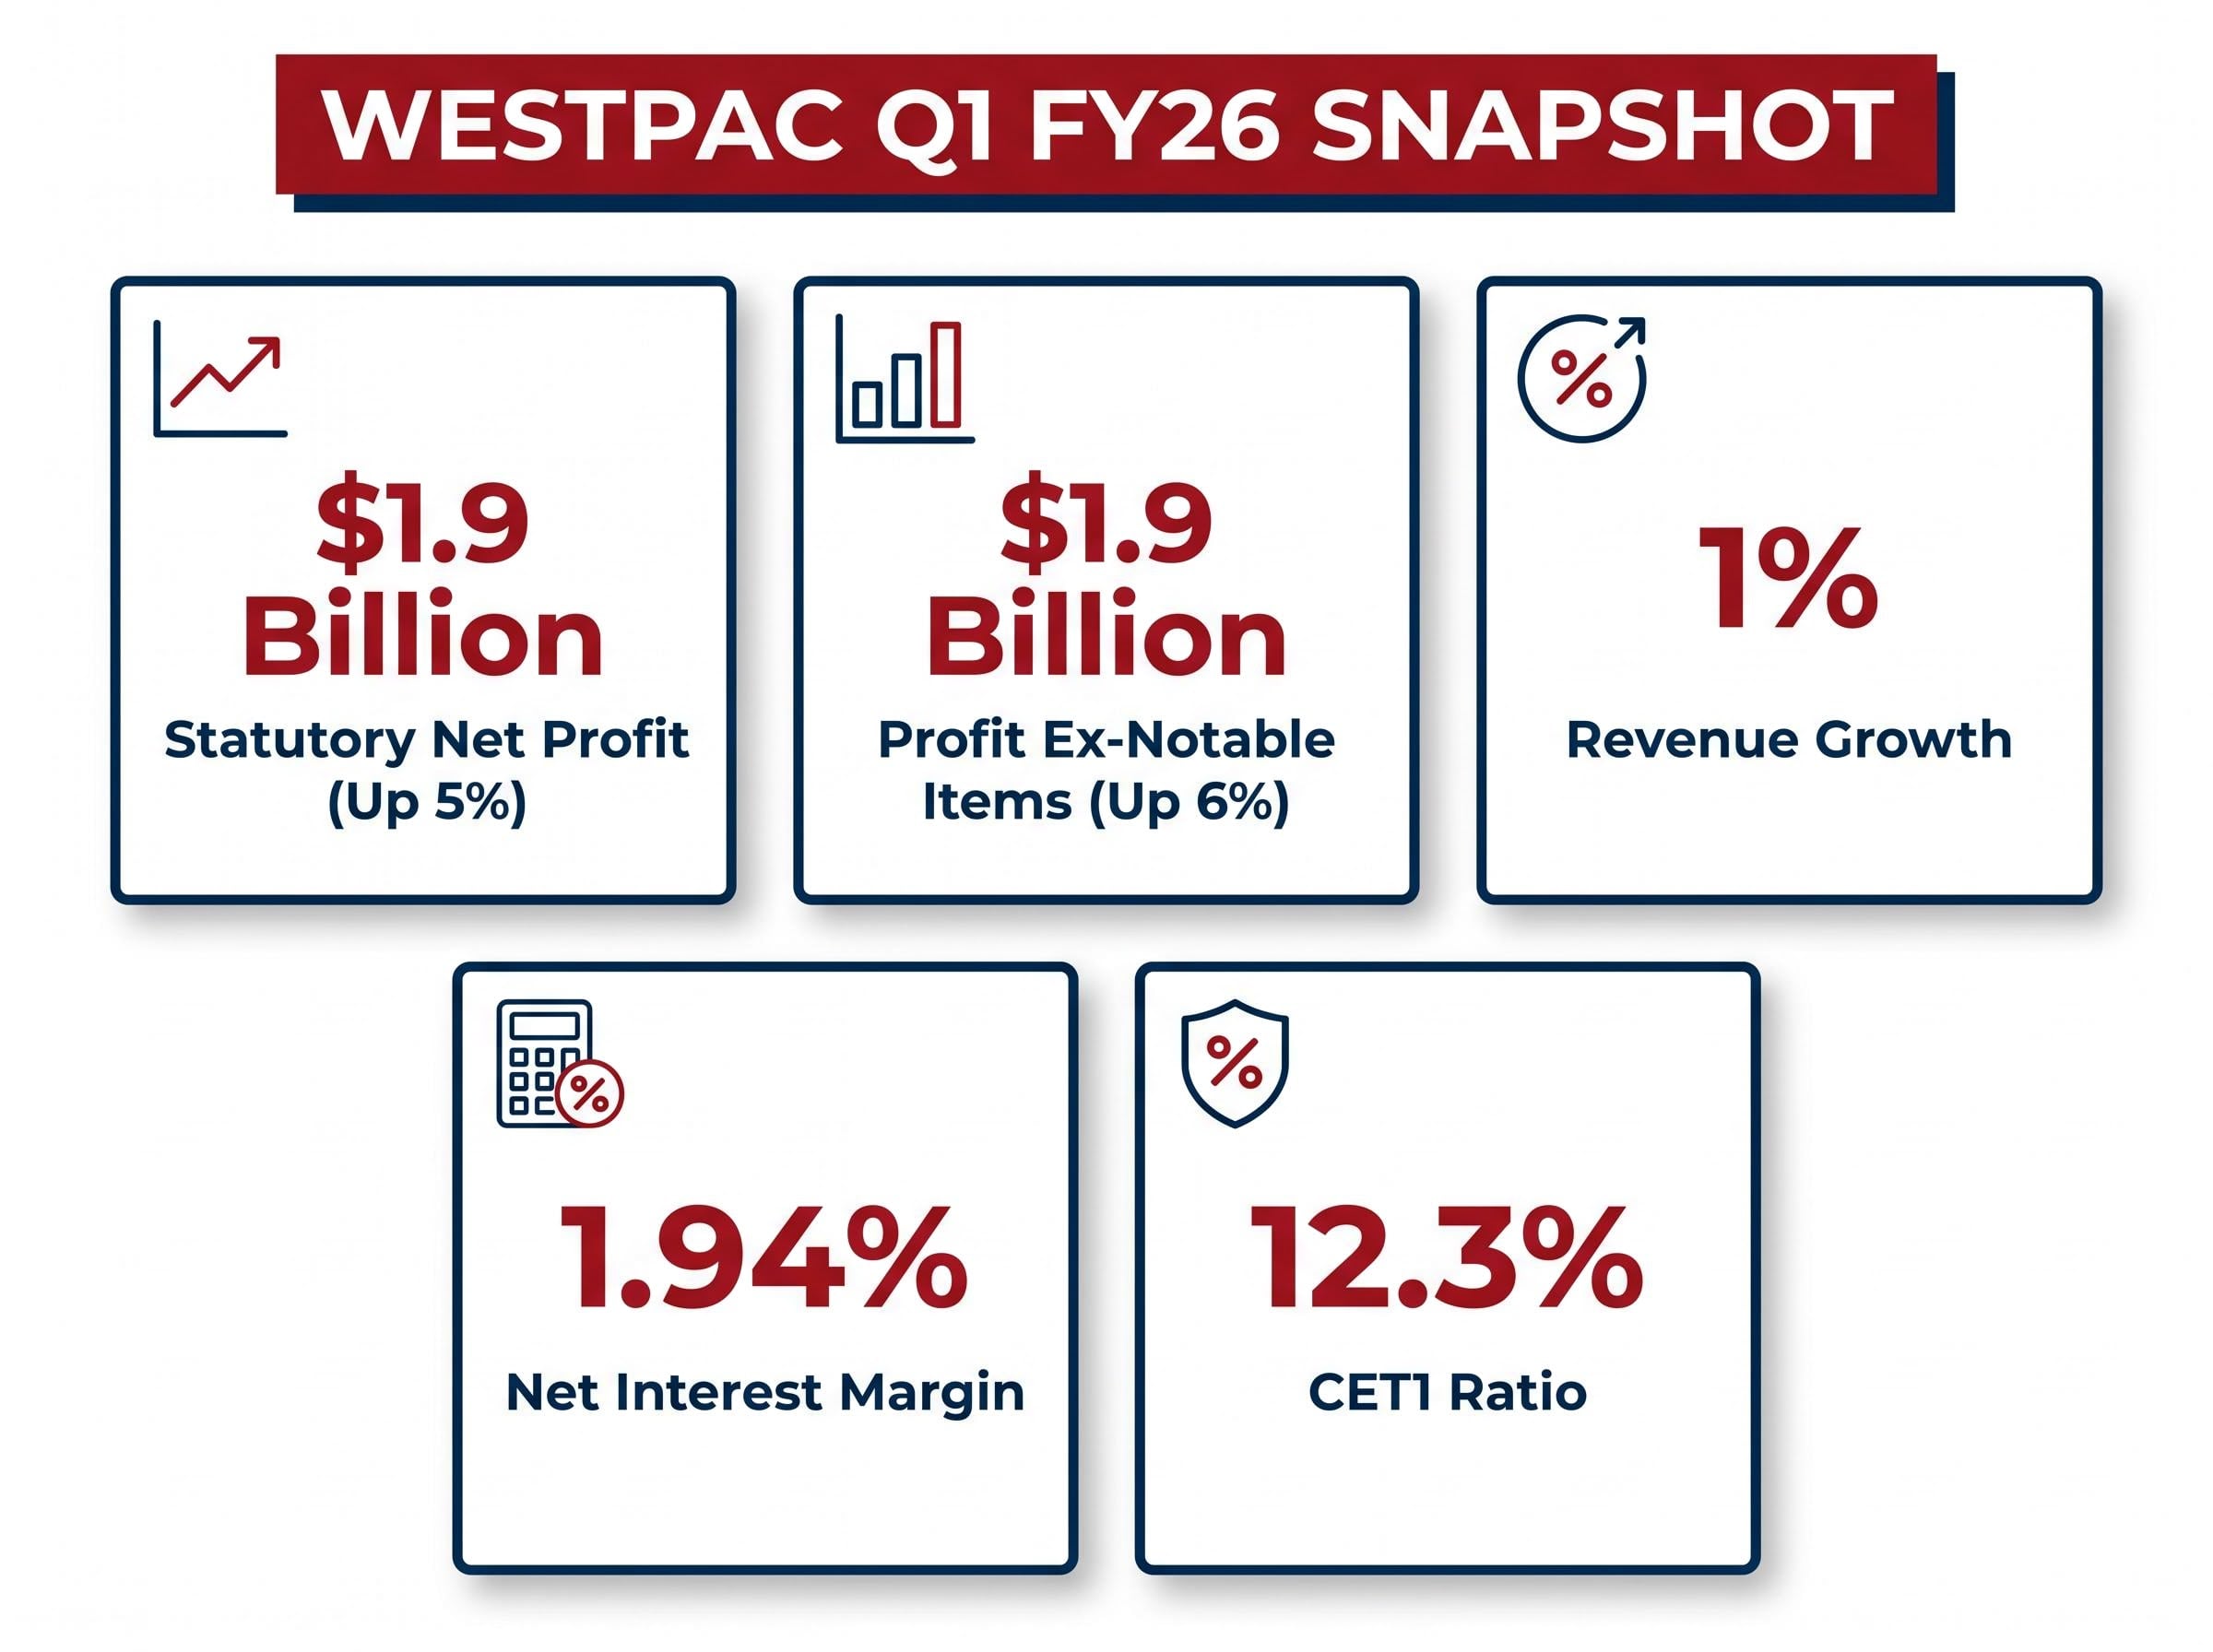
The net interest margin of 1.94% held steady in a competitive lending environment, a result that matters more than it appears. Margin compression is the primary threat to bank dividend capacity during rate-hold periods, and holding close to 1.94% through Q1 is a data point that supports, without confirming, the FY26 earnings trajectory.
A 4.7% headline yield and a 4.7% total return are not the same thing. For Australian shareholders in higher tax brackets, franking credits close the gap between gross yield and after-tax income in a way that materially changes the comparison with alternatives.
Franking credits represent tax the company has already paid on its profits. When a fully franked dividend is received, the shareholder claims a credit for that corporate tax, reducing their personal tax liability or generating a refund. At a 30% corporate tax rate, a fully franked dividend effectively comes with a tax credit worth approximately 43% of the cash dividend received.
Applied to Westpac’s current situation: scattered broker estimates place the FY26 full-year dividend in the range of $1.55-$1.605 per share (low-medium confidence; no confirmed consensus figure is available). Against the $38.43 share price as of 30 April 2026, that implies a headline forward yield of approximately 4.0-4.7%.
According to CMC Invest projections, the grossed-up yield (inclusive of franking credits) lifts to approximately 5.4% for FY26. That spread between 4.7% headline and 5.4% grossed-up is the franking credit premium, and it is the number that matters for after-tax portfolio income decisions.
| Year | Projected DPS | Headline Yield (at $38.43) | Grossed-Up Yield (approx.) |
|---|---|---|---|
| FY26 | $1.55-$1.605 | ~4.0-4.7% | ~5.4% |
| FY27 | $1.64 | ~4.3% | ~6.1% |
| FY28 | $1.70 | ~4.4% | ~6.3% |
Source: CMC Invest projections. FY27 and FY28 figures are not independently verified. The FY26 interim dividend has not been declared; confirmation is expected 5 May 2026. All yield figures assume the $38.43 share price and are illustrative only.
These estimates carry low-medium confidence. Until Westpac declares the FY26 interim dividend on 5 May 2026, the $1.55-$1.605 range remains an unverified projection, not a confirmed forecast.
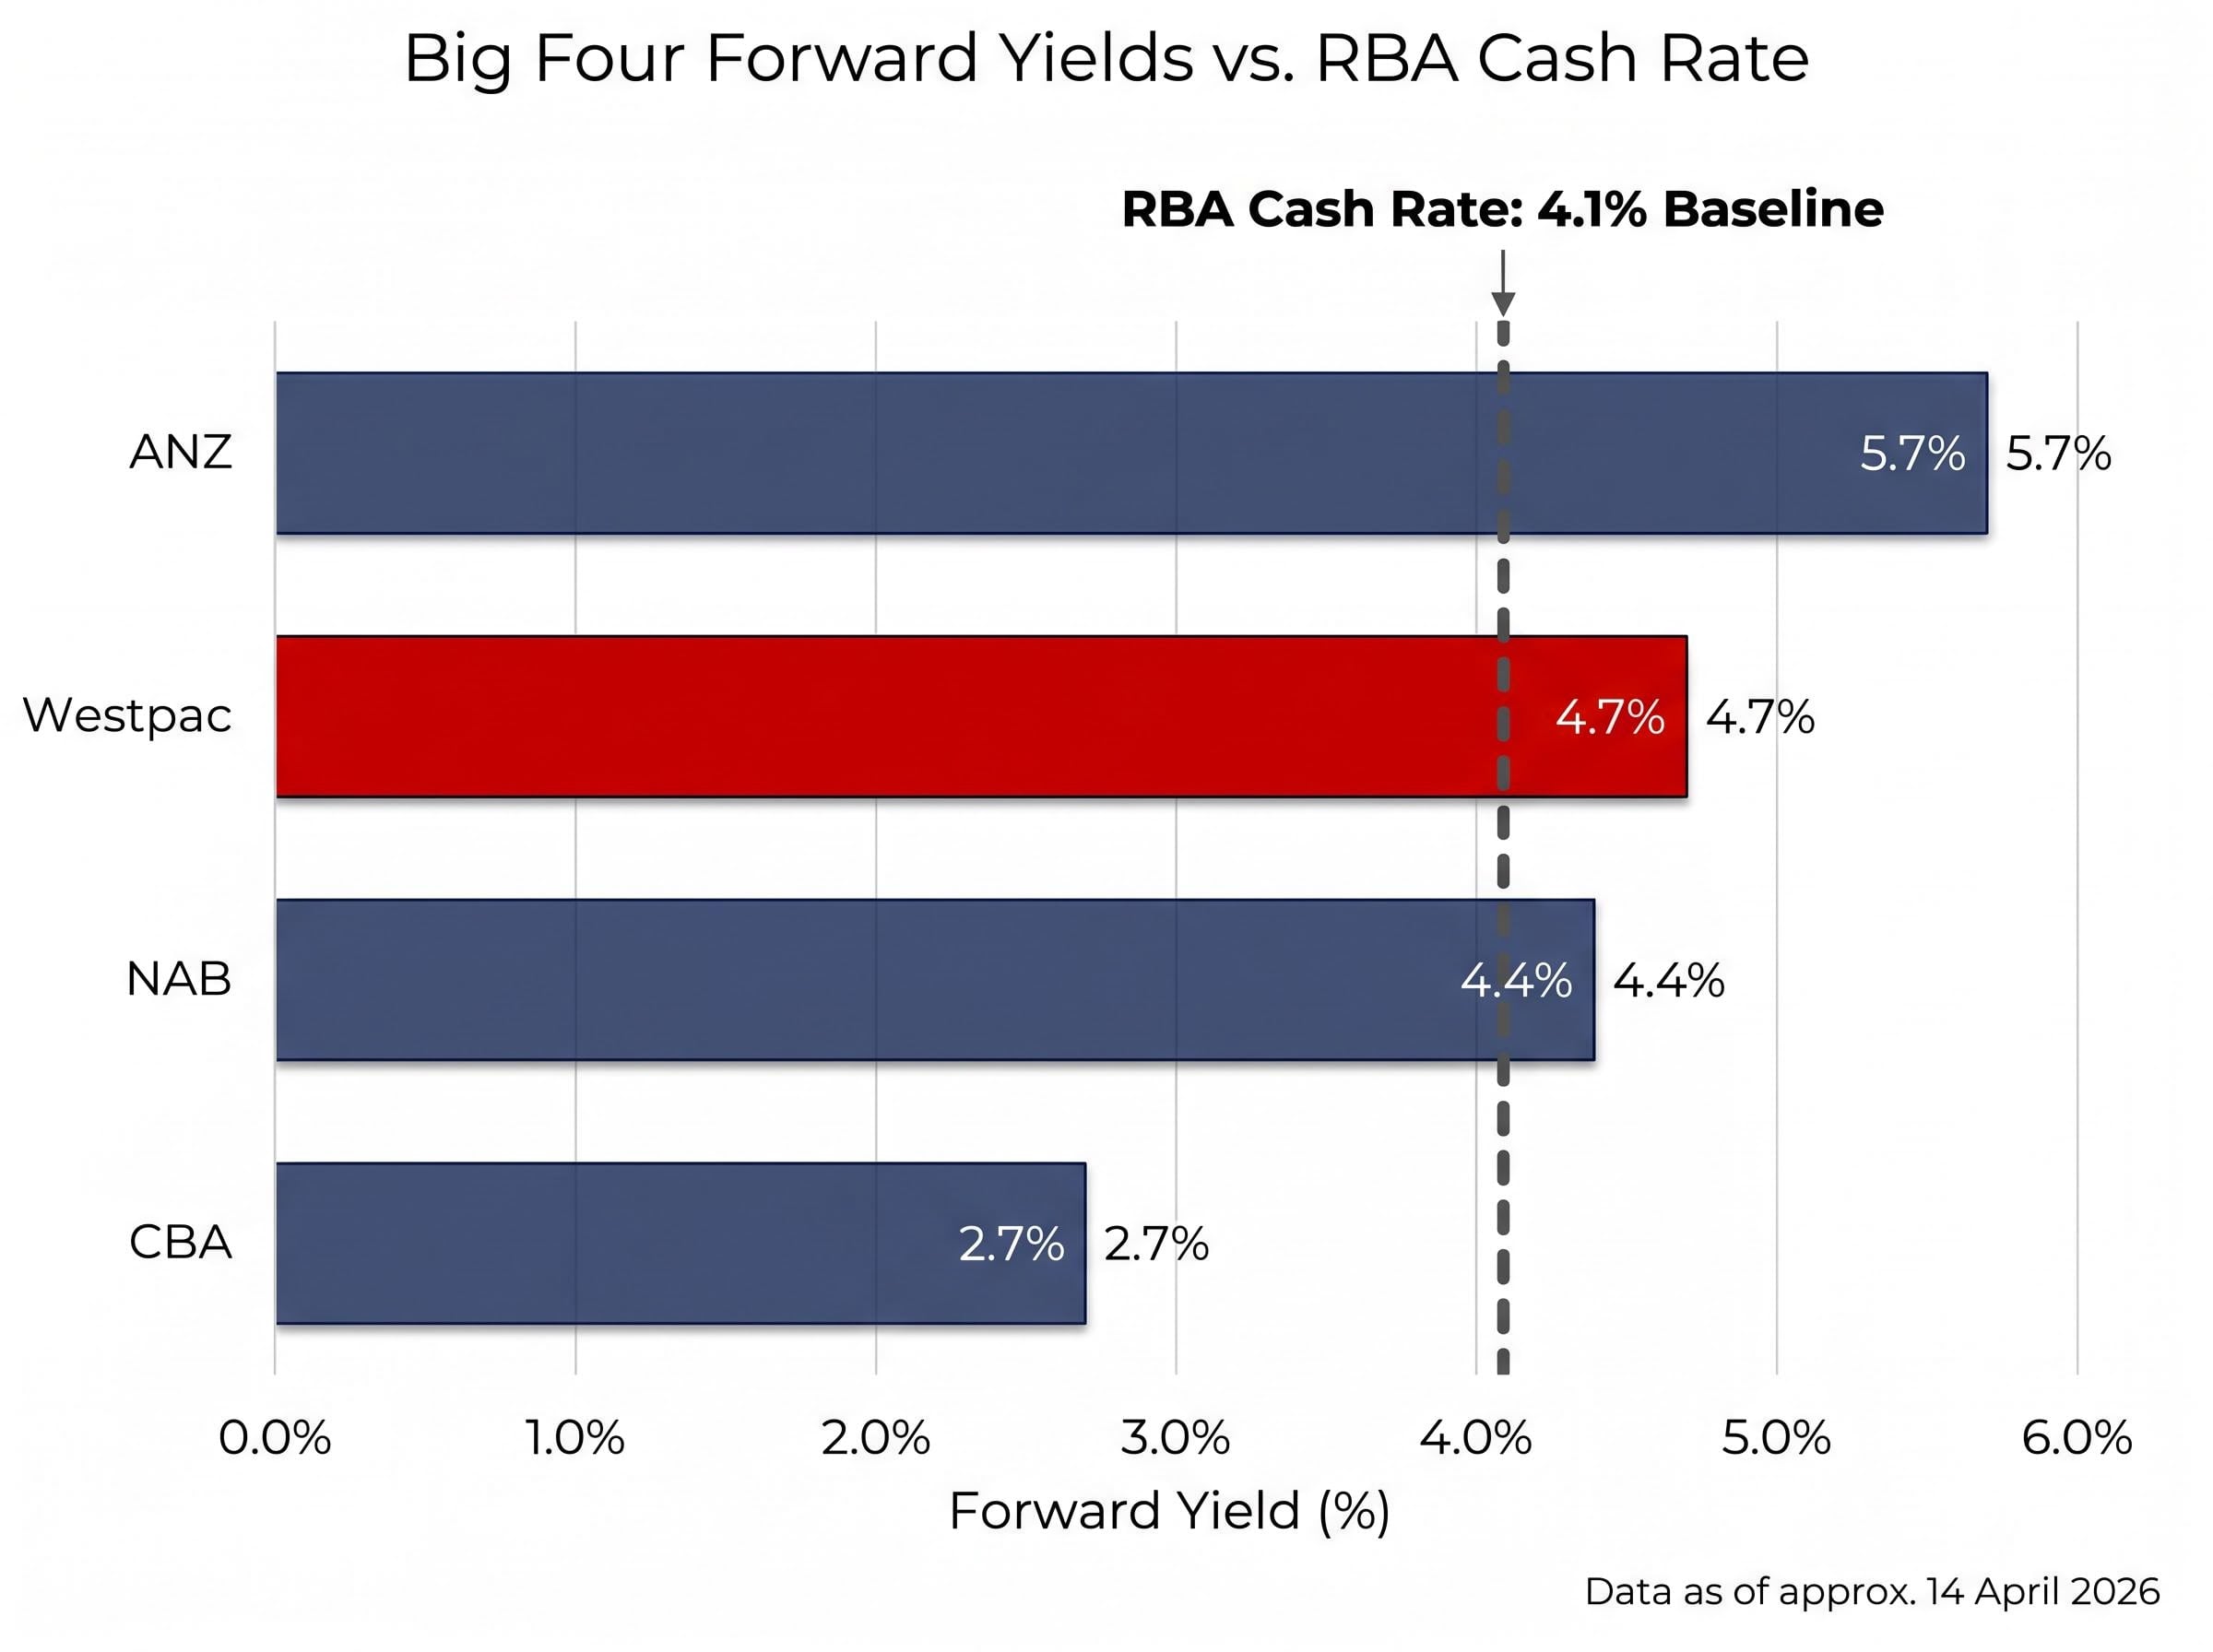
Yield differences across the Big Four reflect different market assessments of risk and growth, not simply different dividend policies. Placing Westpac’s approximately 4.7% forward yield alongside its peers reveals an analytical tension rather than a straightforward ranking.
| Bank | Approx. Forward Yield | Yield Driver |
|---|---|---|
| ANZ | ~5.7% | Higher yield reflects earnings uncertainty discount |
| Westpac | ~4.7% | Mid-range yield; efficiency programme supports trajectory |
| NAB | ~4.4% | Business banking strength supports moderate premium |
| CBA | ~2.7% | Premium valuation compresses yield despite strong payout |
Figures as of approximately 14 April 2026, assuming ~80% payout ratios. Cross-reference with current ASX pricing before making investment decisions.
CBA’s 2.7% yield does not mean it pays less in dividends than peers. It means the market prices CBA at a premium valuation driven by growth expectations, compressing the yield relative to its actual payout. The inverse applies to ANZ: its 5.7% yield reflects a lower share price relative to expected dividends, which can signal either value opportunity or market scepticism about earnings durability.
CBA’s dividend mechanics illustrate the valuation-yield tension across the Big Four most clearly: the stock’s premium multiple compresses its forward yield to approximately 2.7%, while pension-phase SMSF holders receive a grossed-up effective yield closer to 4.0% through refundable franking credits, a gap that explains why income-focused investors continue to hold a stock that virtually every broker rates a sell.
Westpac sits in the middle of this spectrum, offering a yield that is neither the cheapest nor the most discounted in the peer set.
The 4.1% RBA cash rate, unchanged since the March 2026 meeting with no cuts expected until late 2026, sets the risk-free baseline against which all bank dividend yields should be assessed. A term deposit returning close to 4.1% with zero capital risk compresses the yield premium that bank equities need to offer to justify their additional risk.
The RBA monetary policy decision confirmed in March 2026 held the cash rate at 4.10%, with the Board’s statement noting that underlying inflation remained the primary determinant of the rate path, a stance that underpins the late-2026 timeline for any expected easing.
A yield projection is only as durable as the balance sheet behind it. Westpac’s capital and cost data from Q1 FY26 provide three anchor points for assessing dividend sustainability.
The 12.3% Common Equity Tier 1 (CET1) ratio, a measure of a bank’s core capital relative to its risk-weighted assets, positions Westpac with a buffer of more than one percentage point above APRA’s requirements. That buffer is the capital from which both dividends and buybacks are funded. No new capital management announcements have been made since February 2026, but the buyback extension through November 2026 signals management confidence that surplus capital remains available for shareholder returns.
The buyback itself serves as a second channel of capital return. By reducing shares on issue, it increases earnings per share, which in turn supports dividend per share growth even if total profit growth moderates.
The $195 million invested in the UNITE technology transformation programme during Q1 reflects Westpac’s commitment to digital platform consolidation aimed at reducing the cost-to-income ratio over the medium term. A March 2026 update signalled continued momentum, with further investment expected across the remainder of FY26.
Execution risk is real. Technology transformation programmes in large banks have a mixed track record, and the costs are immediate while the benefits accrue over years. Progress to date, however, supports the efficiency component of the FY26 earnings trajectory. If UNITE delivers on its cost reduction targets, it expands operating leverage, giving Westpac more room to sustain and grow dividends without relying solely on revenue growth.
The Q1 result is a prologue. The half-year release on 5 May 2026 will convert several of the assumptions underpinning the dividend thesis into confirmed or contradicted figures.
The operational picture heading into the 5 May release carries one notable complication: the RAMS portfolio sale will produce a $75 million post-tax charge to 1H26 reported profit, a transaction cost that will weigh on statutory earnings even as core operating metrics, including 4% lending growth and 2% expense reduction, point in the other direction.
Three metrics deserve specific attention:
As of 30 April 2026, the FY26 interim dividend has not been declared. The 5 May 2026 half-year results announcement is the authoritative source for the confirmed payout figure. Until then, the $1.55-$1.605 full-year estimate remains an unverified range.
Investors who understand what to monitor on 5 May can assess the half-year release in real time rather than waiting for secondary commentary, giving them a more informed basis for any portfolio decision.
The Q1 FY26 data supports the case for Westpac as an income holding, but it does not close it. Earnings grew 6% excluding notable items. The 12.3% CET1 ratio sits comfortably above regulatory minimums. The buyback extension and UNITE programme investment signal management commitment to both shareholder returns and long-term cost efficiency.
The yield arithmetic, however, operates in a compressed environment. At a 4.1% RBA cash rate with no cuts expected until late 2026, the risk-free alternative narrows the premium that Westpac’s approximately 4.0-4.7% headline yield offers. It is the franking credit component that widens the gap: the grossed-up yield of approximately 5.4% for FY26, according to CMC Invest projections, represents the more relevant comparison for taxable Australian investors.
Grossed-up yield estimate for FY26: approximately 5.4%, according to CMC Invest. This figure is based on unconfirmed dividend estimates and a $38.43 share price. It should not be treated as a guaranteed return.
The income case has structural support but remains conditional. The 5 May 2026 half-year result will either confirm the trajectory or force a recalibration. Until then, the evidence supports cautious optimism, not conviction.
The analyst consensus on Westpac adds an important counterweight to the income case: the average 12-month price target sits around $34.75-$34.87, roughly 9-10% below the current share price, meaning that even a fully confirmed dividend trajectory could be offset by capital erosion if the stock reprices toward where brokers believe fair value sits.
This article is for informational purposes only and should not be considered financial advice. Investors should conduct their own research and consult with financial professionals before making investment decisions. Past performance does not guarantee future results. Financial projections are subject to market conditions and various risk factors. Readers are directed to Westpac’s official ASX announcements for confirmed dividend figures and financial data.
Scattered broker estimates place Westpac's FY26 full-year dividend in the range of $1.55 to $1.605 per share, implying a headline forward yield of approximately 4.0-4.7% at the $38.43 share price, though the interim dividend has not yet been declared and confirmation is expected on 5 May 2026.
A grossed-up yield adds the value of franking credits to the cash dividend, reflecting the tax already paid by the company on its profits; for Westpac, CMC Invest projects a grossed-up FY26 yield of approximately 5.4%, compared to a headline yield of around 4.7%.
Among the Big Four, ANZ offers the highest forward yield at approximately 5.7%, followed by Westpac at approximately 4.7%, NAB at approximately 4.4%, and CBA at approximately 2.7%, with CBA's lower yield reflecting its premium market valuation rather than a smaller dividend payout.
Income investors should focus on three data points in the May release: the declared interim dividend per share, the updated net interest margin trajectory from the Q1 figure of 1.94%, and any changes to the UNITE technology programme spending schedule that could affect future cost efficiency.
Yes, Westpac's CET1 ratio of 12.3% sits materially above APRA's effective minimum requirement of approximately 10.5-11%, providing a buffer of more than one percentage point from which both dividends and an on-market buyback extended to November 2026 are funded.