
SpaceX IPO Triples Saudi Aramco’s Record With $75 Billion Raise
1 hr ago
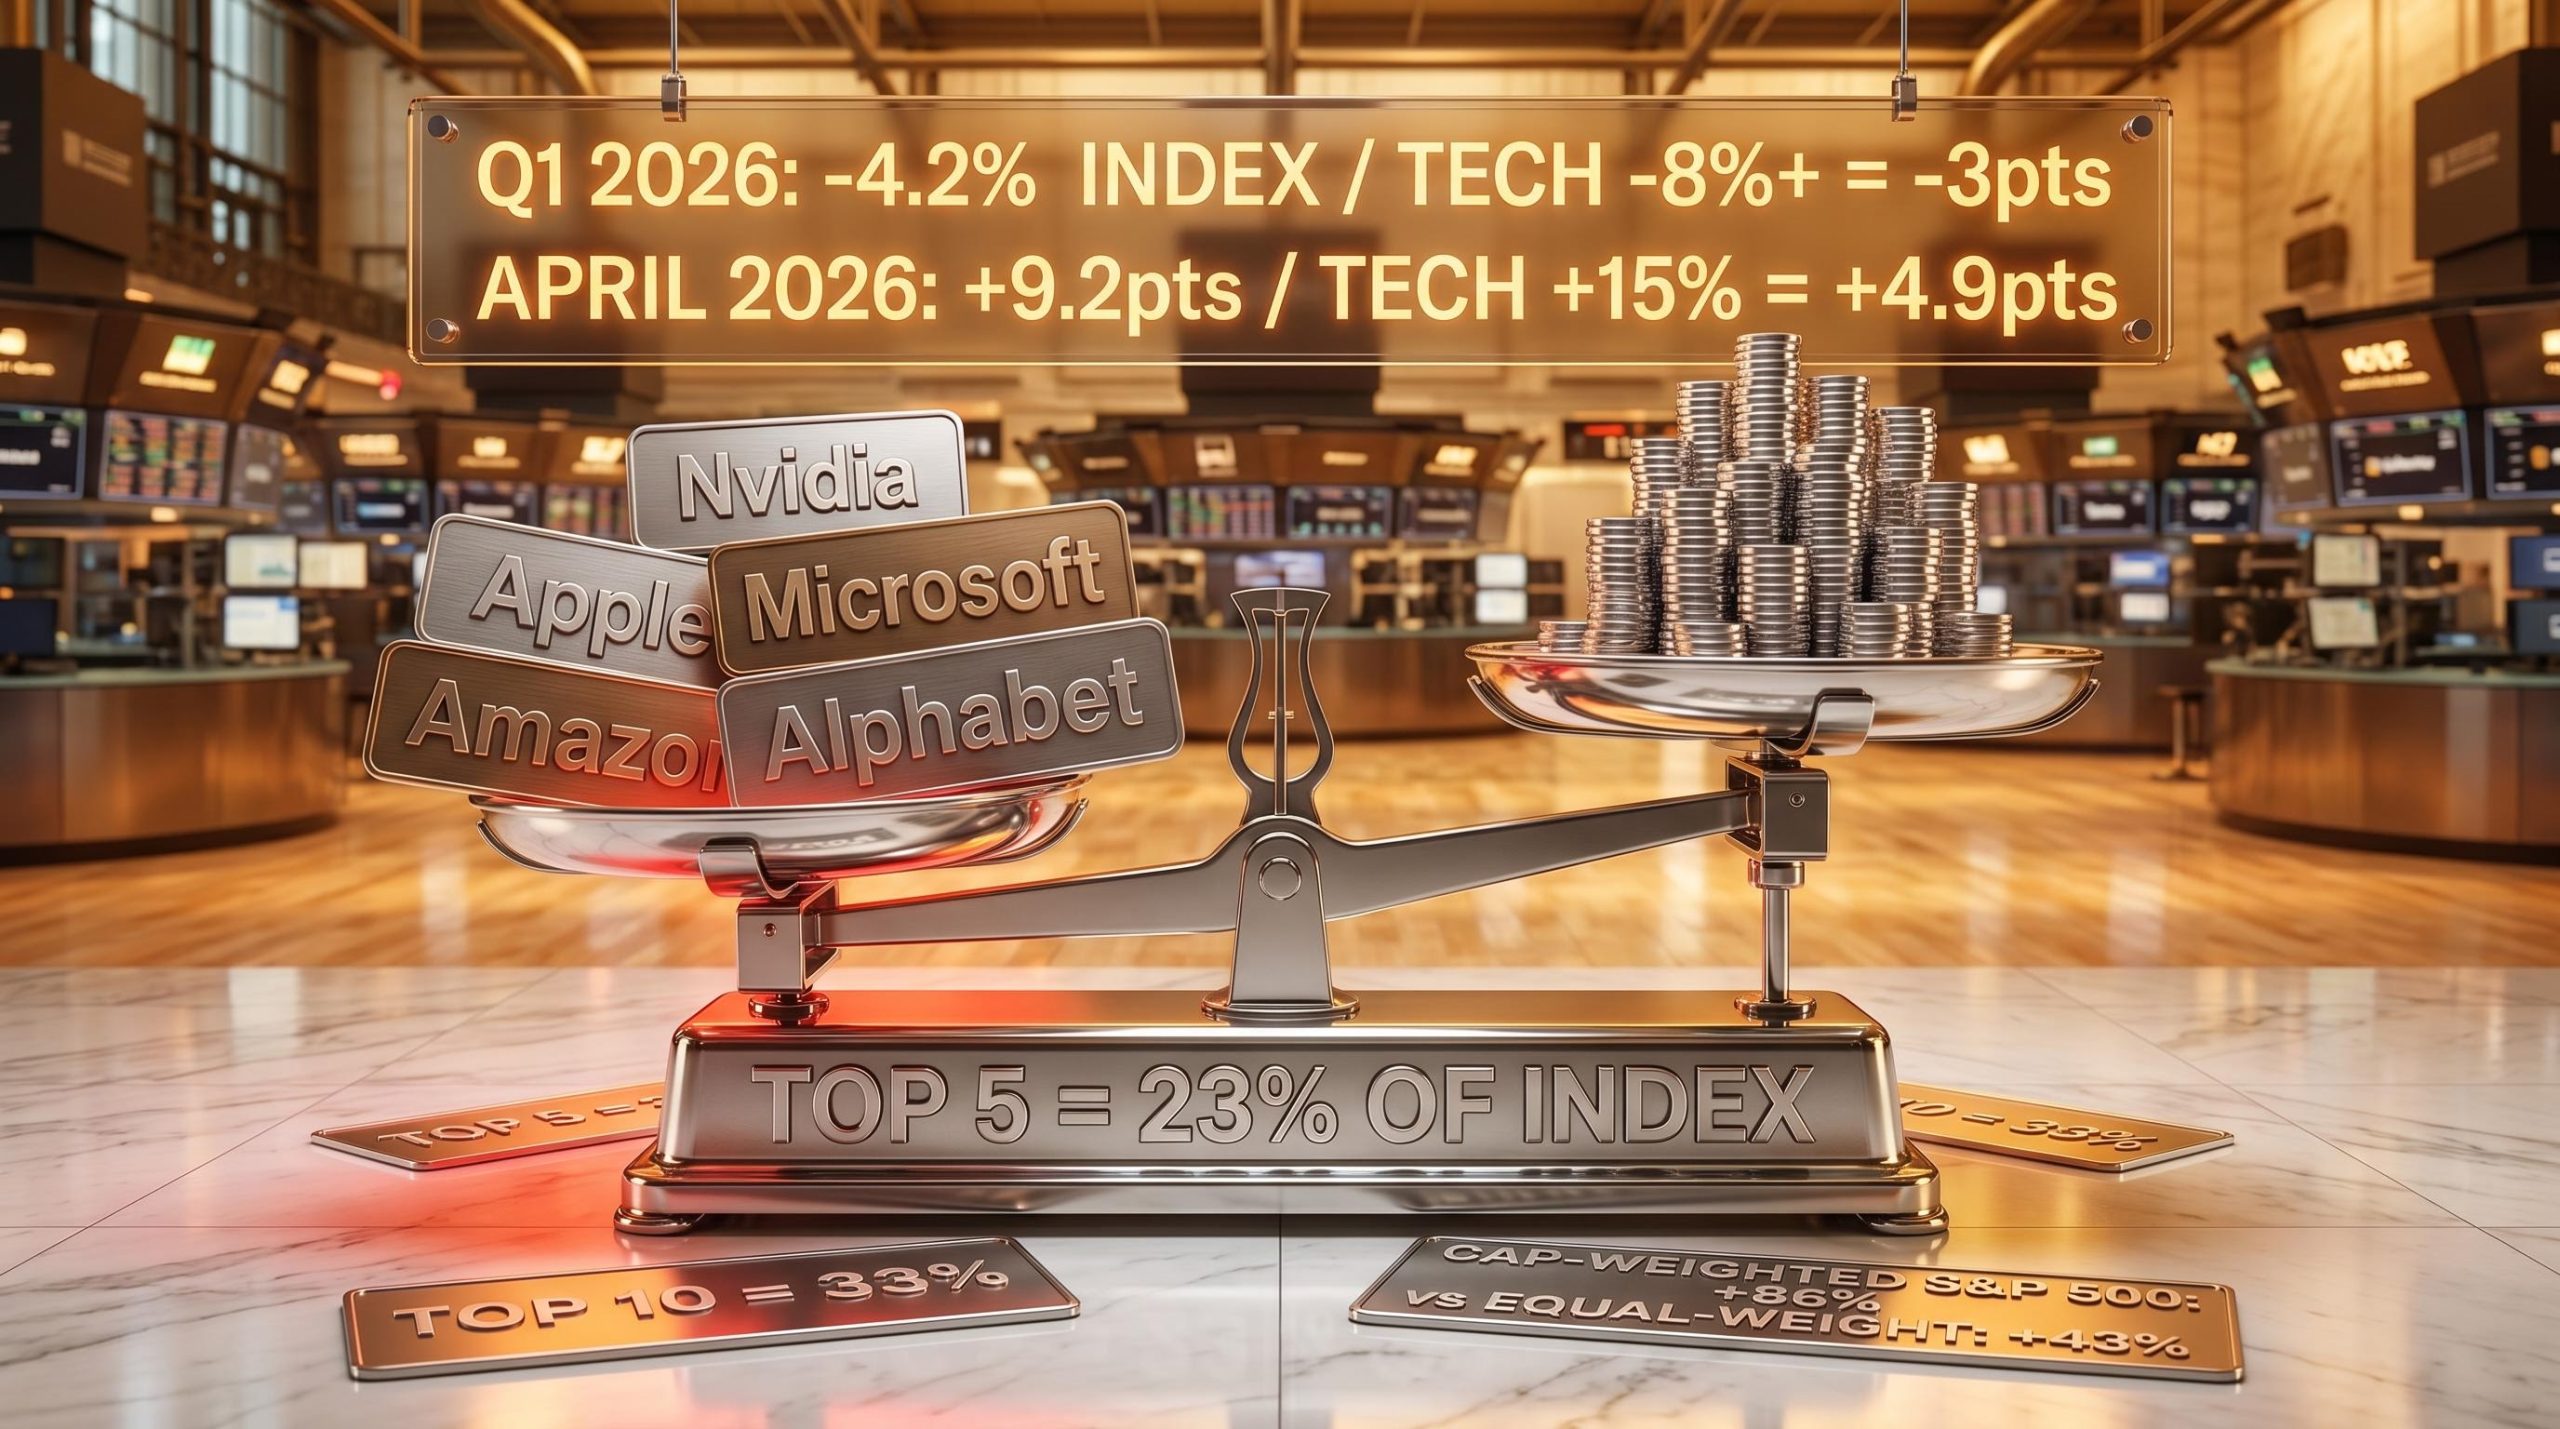
Technology stocks contributed nearly 3 percentage points of the US market’s 4.2% first-quarter loss in 2026, then reversed course and delivered 4.9 points of April’s 9.2-point recovery. One sector, representing roughly a third of the index, dictated the direction of the entire market in both directions within 120 days. This is not an anomaly. It is the structural reality of how US equities now operate. The concentration of five mega-cap stocks in benchmark indexes has more than doubled over the past decade, and the gap between what an index fund label promises (broad market exposure) and what it actually delivers (a five-stock bet wrapped in 495 other names) has never been wider. What follows is an analysis of how this concentration developed, what the Q1-April 2026 episode reveals about its mechanics, what institutional analysts are warning, and what it means for investors whose retirement savings sit inside these structures.
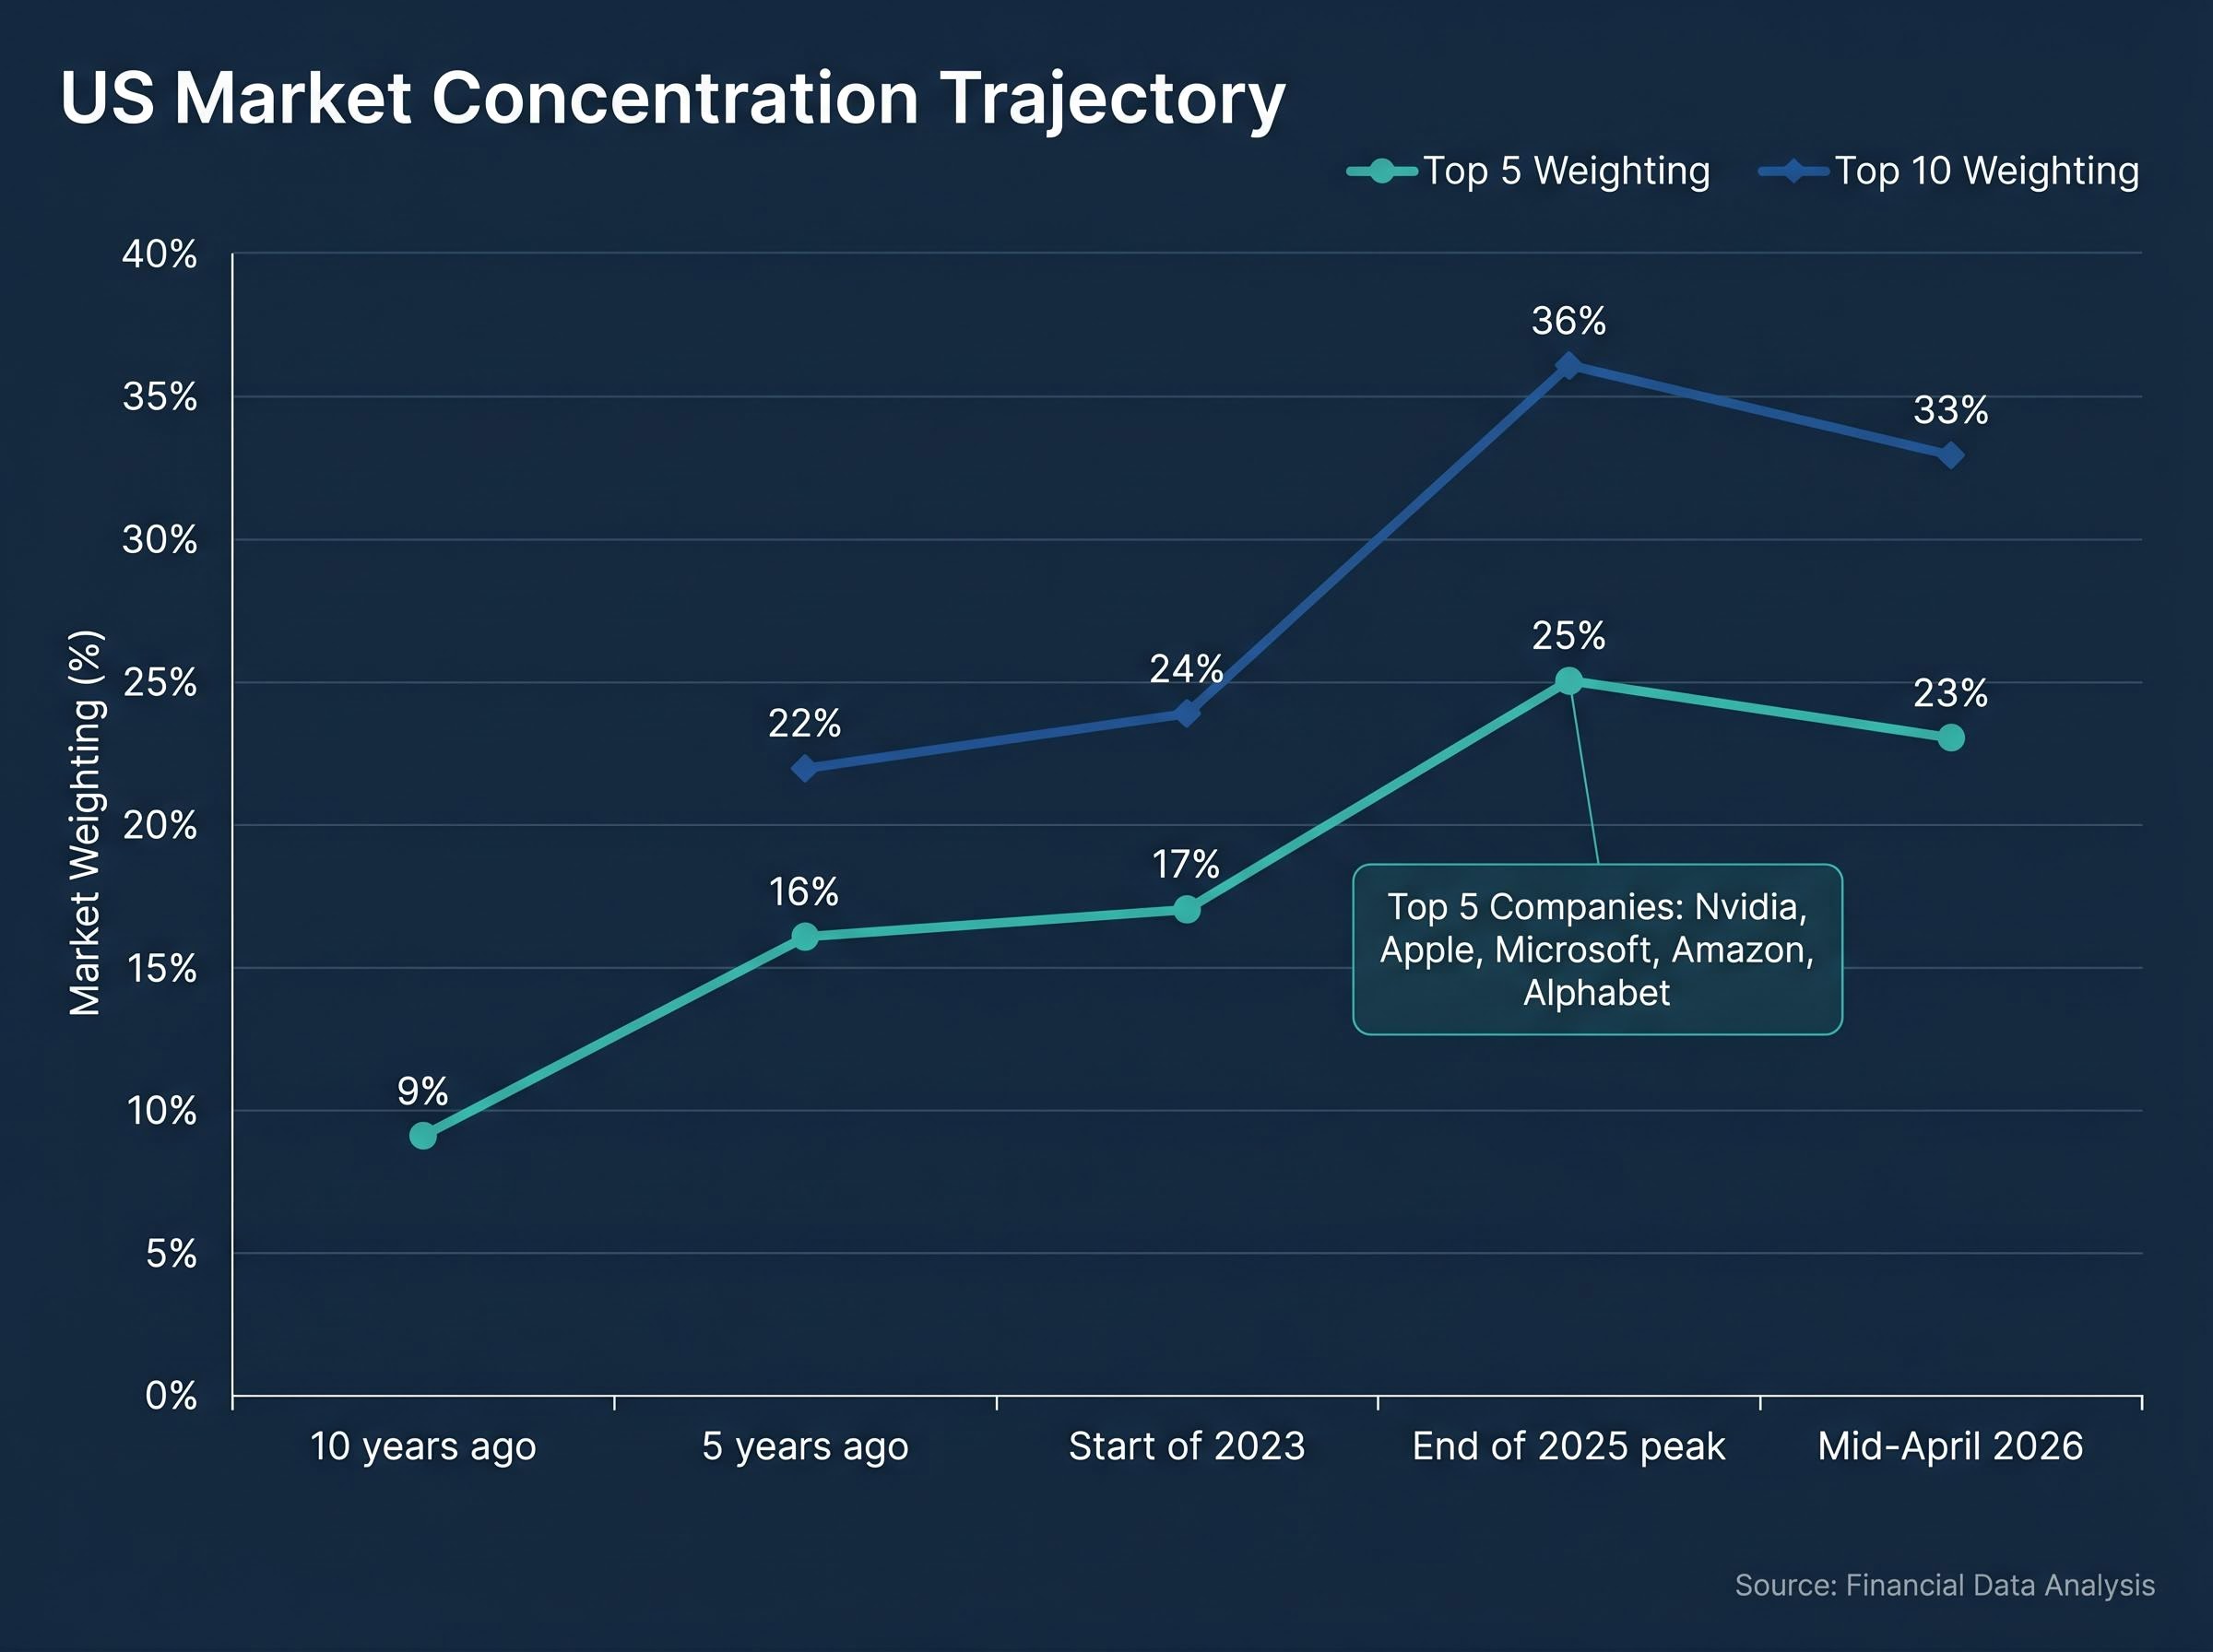
The concentration did not arrive suddenly. According to Morningstar index research, the five largest US stocks accounted for roughly 9% of market capitalisation a decade ago. Five years later, that figure had climbed to 16%. By the start of 2023, it reached 17%. Then the pace accelerated. The artificial intelligence investment cycle, combined with sustained mega-cap earnings growth, pushed the top-five weighting to 25% by the end of 2025 before a Q1 correction brought it back to approximately 23% in mid-April 2026.
The top-ten weighting followed the same trajectory, moving from 22% five years ago to 36% at its end-of-2025 peak and settling at 33% after the first quarter’s pullback. The S&P 500 tells a similar story: the top ten names now account for approximately 37.4% of index value, with the Magnificent 7 at roughly 33%.
Morningstar’s February 2026 analysis concluded that US equity concentration has surpassed its 1930s historical peak.
The five names at the centre of this weight are Nvidia, Apple, Microsoft, Amazon, and Alphabet. Together, they held approximately 23% of the Morningstar US Market Index as of mid-April 2026.
| Timeframe | Top 5 Weighting | Top 10 Weighting |
|---|---|---|
| 10 years ago | ~9% | N/A |
| 5 years ago | ~16% | ~22% |
| Start of 2023 | ~17% | ~24% |
| End of 2025 (peak) | ~25% | ~36% |
| Mid-April 2026 | ~23% | ~33% |
Every investor holding a standard index fund has been accumulating this concentration for a decade without necessarily choosing it. The trajectory clarifies why this is a present-tense concern rather than a perennial talking point.
The first quarter of 2026 provided the clearest demonstration yet of how concentration translates into market-level outcomes.
The Morningstar US Market Index declined 4.2% over the quarter. Technology, which carries a 32.6% index weight, fell more than 8%, contributing approximately 3 percentage points of the total loss, roughly 70% of the damage. Energy, measured by the Morningstar US Energy Sector Capped Index, gained 38% over the same period. It could not move the needle. Energy’s index weight sits at 3.4%.
Energy posted a 38% quarterly gain from a 3.4% index weight. Technology’s 8%+ decline from a 32.6% weight overwhelmed it entirely. Sector performance did not determine the market’s direction; sector weight did.
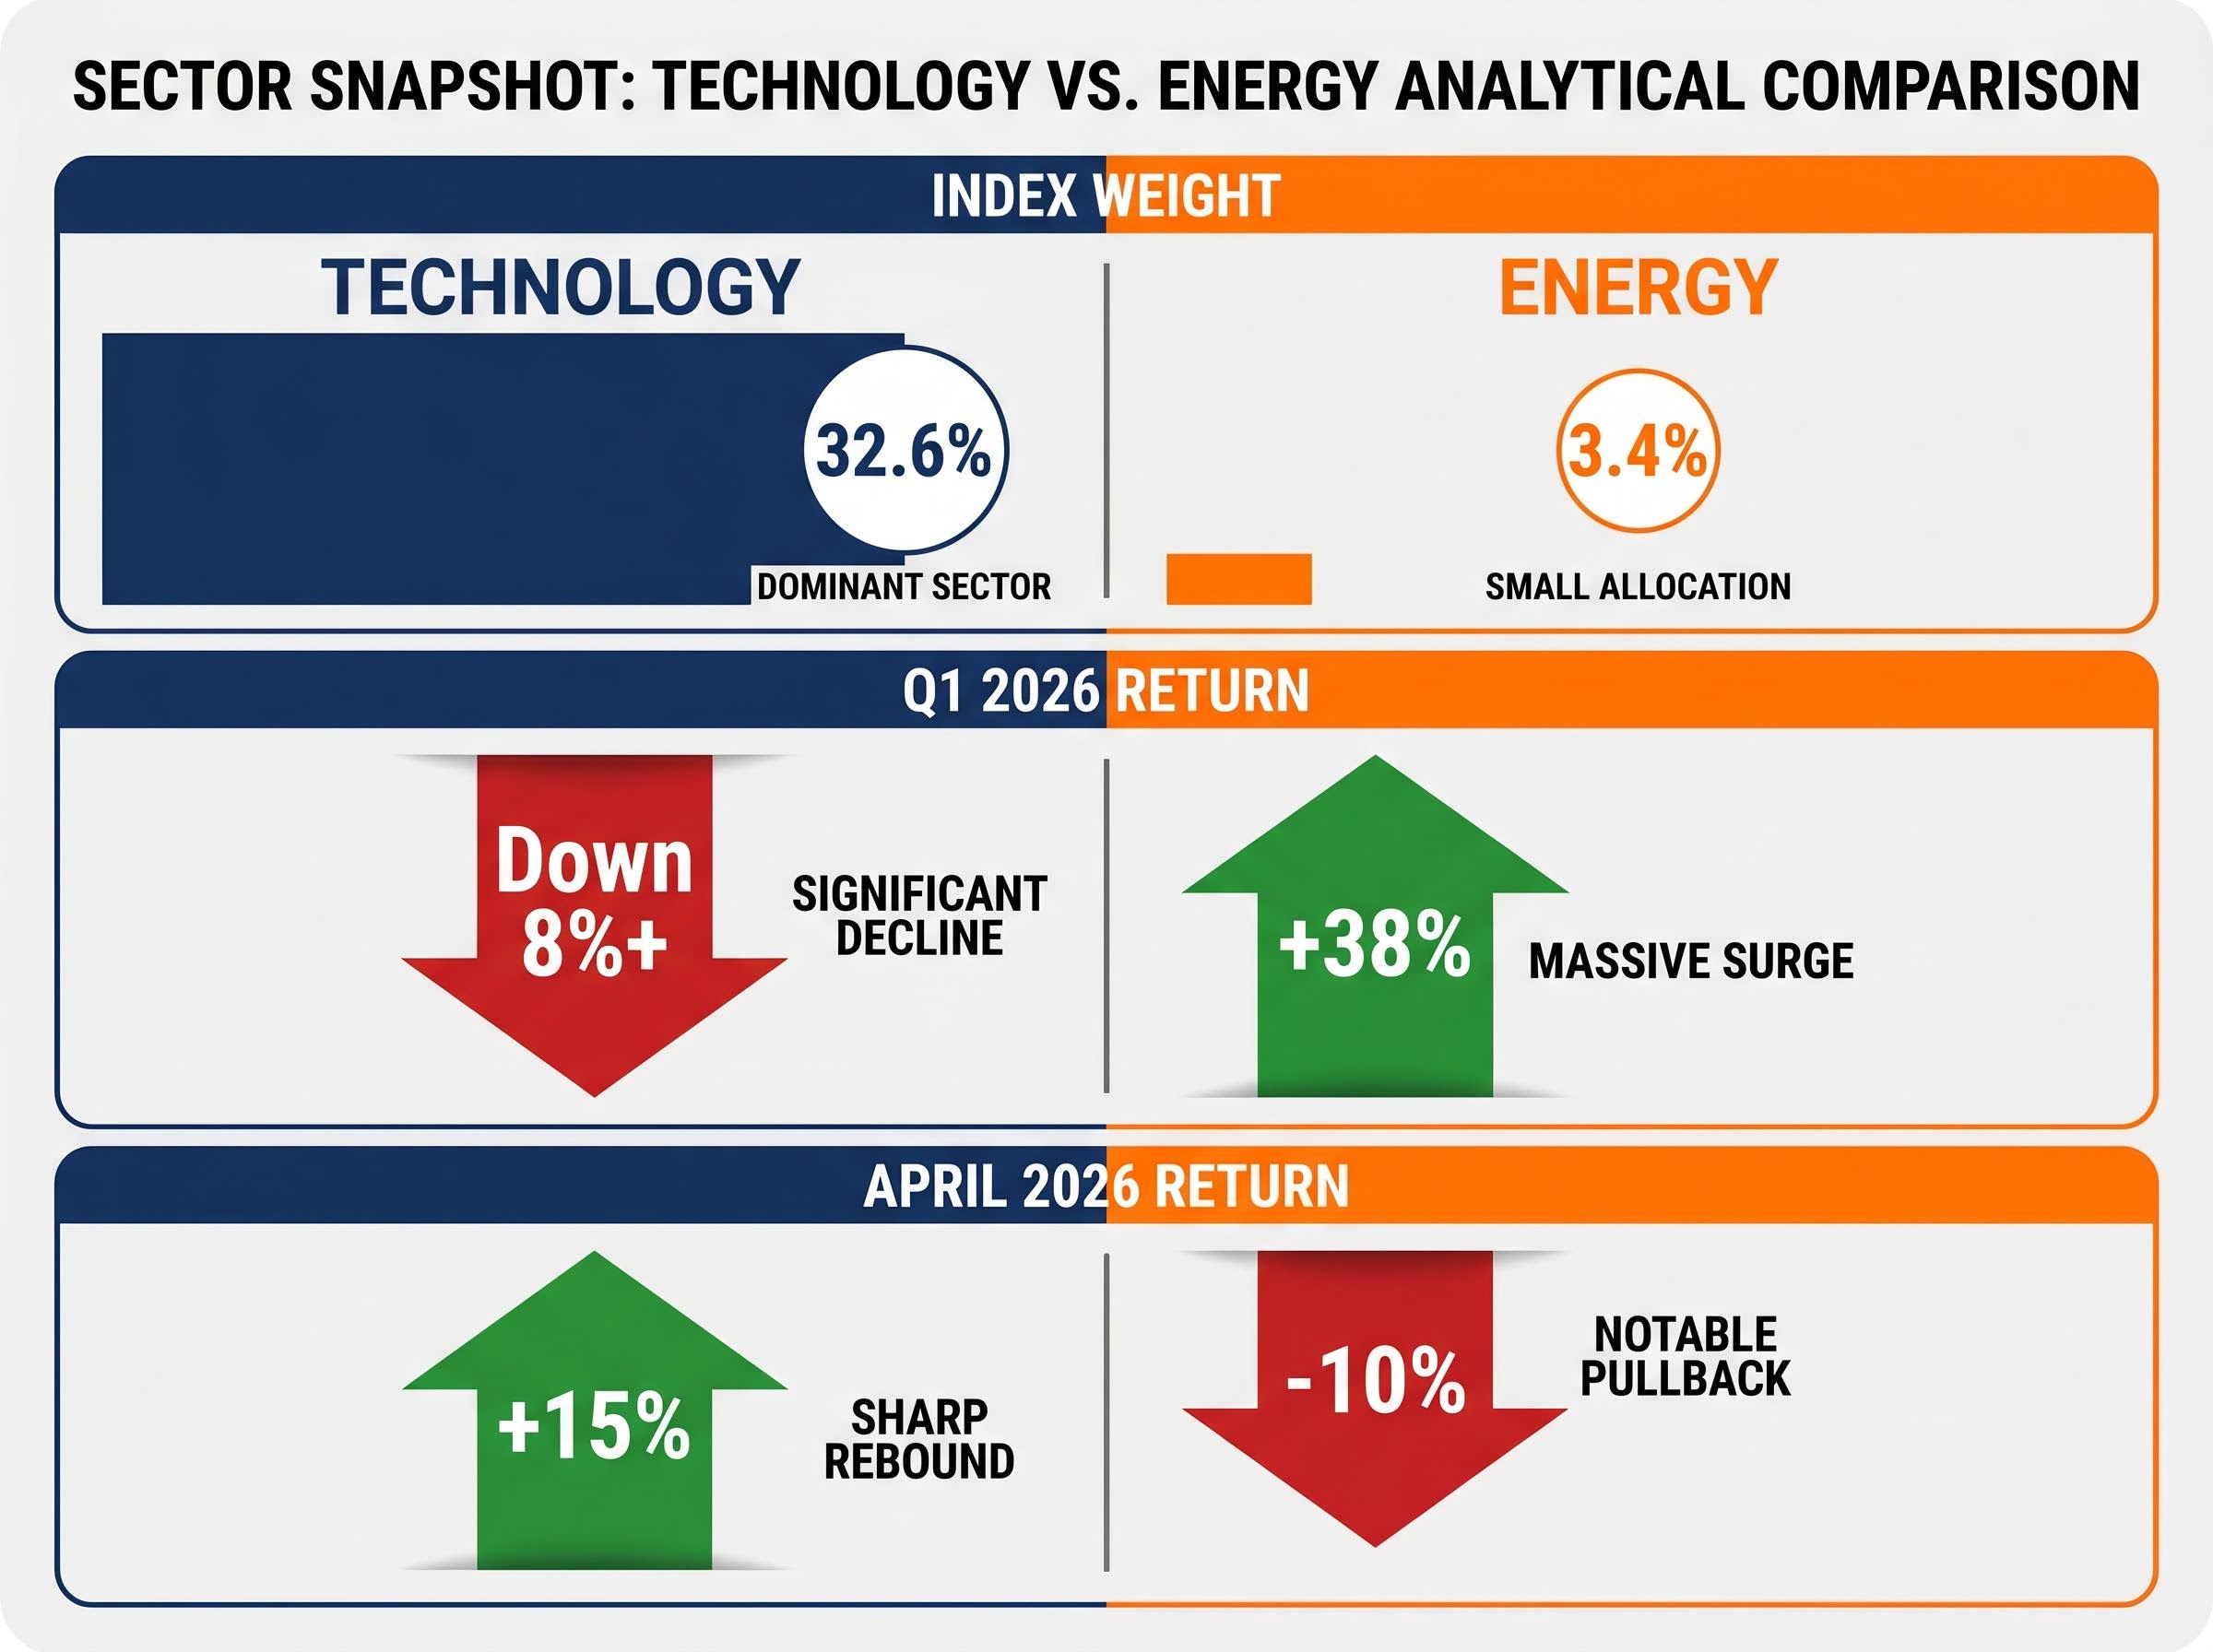
Then April arrived. Technology surged 15% in a single month, contributing 4.9 percentage points of the index’s 9.2-point advance, more than half the total recovery from one sector. Consumer cyclical rose 12%. Energy, which had carried Q1, fell 10% in April (though it remained up 24% year-to-date). Financial services and communication services contributed supporting gains.
| Sector | Q1 2026 Return | April 2026 Return | Index Weight |
|---|---|---|---|
| Technology | Down 8%+ | +15% | 32.6% |
| Energy | +38% | -10% | 3.4% |
| Consumer Cyclical | N/A | +12% | N/A |
| Communication Services | N/A | Positive | N/A |
The symmetry is the point. The same structural feature that amplified Q1 losses amplified the April recovery. This is concentration risk operating as designed.
The sector rotation dynamics visible in Q1 and April 2026 reflect something more deliberate than momentum: capital was actively repositioning away from dominant technology leaders toward value sectors between late 2025 and April 2026, a shift that derivatives markets had been signalling through elevated implied volatility on individual Magnificent 7 names well before the index-level move became apparent.
Morningstar’s April 2026 concentration analysis confirms the specific mechanics observed across Q1 and April, including the technology sector’s outsized contribution to both the quarterly loss and the subsequent recovery, validating the structural interpretation rather than treating the episode as a one-off event.
Concentration risk refers to the degree to which a portfolio’s returns are determined by a small number of holdings rather than broad market participation. When the Magnificent 7 account for roughly 33% of the S&P 500, a single earnings miss from a top-five name now moves the entire index measurably.
Morgan Stanley has warned that the top 10 S&P 500 stocks, at roughly 37-40% of index value, leave limited cushion if earnings disappoint. Fidelity Investments has separately noted that seven stocks representing approximately a third of the market have front-loaded index gains, making diversification a priority for managing the resulting risk. The SEC’s Fiscal Year 2026 Examination Priorities document has also signalled enhanced focus on registered investment companies given their systemic importance to retail investors.
Elevated implied volatility in mega-cap positions translates directly into S&P 500 index-level volatility rather than remaining isolated within individual stock options chains, a transmission mechanism that compounds the weight-driven amplification described above and gives institutional hedging desks a structural reason to treat a single earnings miss from a top-five name as a portfolio-wide event.
The SEC’s 2026 Examination Priorities signal enhanced scrutiny of registered investment companies, reflecting regulatory recognition that the systemic importance of index funds to retail retirement savings warrants closer oversight as concentration levels reach historic extremes.
The reason this concentration exists is structural, not accidental.
In a cap-weighted index, as a stock rises, its market capitalisation grows, its index weight increases, and index funds tracking the benchmark must buy more of it. The mechanic is self-reinforcing: success begets a larger share of investor capital, which supports the price, which increases the weight further.
This is not a flaw. It is an intended feature of market-cap construction. It becomes a risk factor when concentration reaches the levels now observed, because a reversal in those same names triggers the mechanic in the opposite direction.
The outperformance of the cap-weighted S&P 500 over its equal-weighted counterpart has been striking. According to Oppenheimer, the cap-weighted index delivered an 86% total return over three years compared with 43% for the equal-weighted version.
The cap-weighted S&P 500 returned 86% over three years versus 43% for the equal-weighted index, according to Oppenheimer. Annual EPS growth was approximately 9% for both. The entire performance gap was driven by valuation expansion, not earnings differentiation.
| Metric | Cap-Weighted S&P 500 | Equal-Weighted S&P 500 |
|---|---|---|
| Three-year total return | 86% | 43% |
| Approximate annual EPS growth | ~9% | ~9% |
The S&P 500 forward price-to-earnings ratio stands at 20.87x as of 28 April 2026, reflecting the multiple expansion that has fuelled cap-weighted outperformance. Q1 2026 blended earnings growth came in at 15.1%, and consensus EPS growth projections for 2025-2026 sit at approximately 12-15%. Those are healthy figures, but Morgan Stanley notes that non-Magnificent 7 stocks would need to roughly double their 2025 EPS growth pace to meet broader consensus expectations.
Oppenheimer has explicitly predicted that 2026 will mark a rotation toward broader market leadership as mega-cap valuations normalise. JPMorgan’s 2026 outlook flags a potential “Metaverse moment” for hyperscalers, warning that cumulative capex and R&D expenditures approaching $1.3 trillion could yield disappointing profit returns. Goldman Sachs anticipates lower overall S&P 500 returns going forward.
When outperformance is built on multiple expansion rather than earnings, the foundation is more fragile than the headline return suggests.
Three historical reference points frame the current moment:
Morningstar’s index research team found in February 2026 that US equity market concentration has surpassed its 1930s historical peak, a level that had stood as the extreme for nearly a century.
The dispersion within the current market reinforces the concentration theme. Year-to-date through mid-April 2026, the Morningstar Global Semiconductor Equipment and Materials index has risen 47.6% and the computer hardware index has gained 45.3%, with SanDisk surging 284.6%. On the opposite end, the Morningstar Global Software Application index has fallen 22.7% amid AI disruption fears, with SAP and Salesforce each down approximately 30%.
Historical analogies do not predict outcomes. They calibrate risk. Each prior US concentration peak resolved through some combination of rotation and correction, and the current level exceeds all prior peaks except through the lens of individual stock names rather than sector composition.
For investors who want to stress-test the hyperscaler spending thesis before the next earnings cycle, our deep-dive into AI capex return on investment risk examines the $630 billion combined AI infrastructure commitment across major tech firms, the historical parallel with dot-com-era semiconductor concentration, and which cash-flow metrics analysts are using to separate credible ROI timelines from speculative infrastructure hoarding.
Concentration in itself is not a reason to exit markets. The five largest stocks hold their index weight because they have delivered sustained earnings growth and attracted sustained capital. The issue is not whether these are successful companies; it is whether a portfolio built around a cap-weighted index fund provides the diversification its label implies.
Many investors hold both a “US Total Market” fund and an “S&P 500” fund under the assumption they are diversifying. In practice, both may carry similar concentration profiles and should be examined together rather than treated as complements. Nvidia and Broadcom together contributed approximately 1 percentage point (roughly 21%) of the market’s year-to-date advance through mid-April 2026, illustrating that even within the top ten, two names can dominate.
Three concrete steps can help manage concentration exposure:
A March 2026 survey found that nearly 70% of individual investors expect stock market gains this year, even as approximately half cite recession risk. Morningstar’s Q2 2026 outlook, titled “Don’t Panic, Readjust,” identifies undervalued non-tech sectors as opportunities and recommends navigating volatility rather than exiting.
Five stocks now function as the de facto engine of US market returns in both directions. This is a structural condition that passive investors can no longer treat as background noise.
Institutional analysts disagree on timing. Oppenheimer sees rotation beginning this year. JPMorgan warns the hyperscaler spending cycle could produce its own correction catalyst. Goldman Sachs expects lower aggregate returns. Concentration could persist or deepen before it narrows; no institution is offering a precise date.
Concentration risk compounds when it coincides with macro warning signals embedded in current valuations: the S&P 500 closed at an all-time high of 7,173.91 on 27 April 2026 even as Brent crude traded above $112 per barrel and Goldman Sachs and JPMorgan assigned 30-35% recession probability over the next 12 months, a combination that has historically preceded average equity declines of approximately 32%.
JPMorgan’s 2026 outlook warns of a potential “Metaverse moment” for hyperscalers, with cumulative capex and R&D approaching $1.3 trillion and the risk of disappointing profit returns echoing the 2022 mega-cap bear market.
The distinction that separates informed investors from reactive ones is not the ability to predict when concentration reverses. It is ensuring a portfolio is positioned to absorb the reversal if it comes.
This article is for informational purposes only and should not be considered financial advice. Investors should conduct their own research and consult with financial professionals before making investment decisions. Past performance does not guarantee future results. Financial projections are subject to market conditions and various risk factors.
US stock market concentration refers to the degree to which a small number of stocks dominate index returns; today, five mega-cap stocks control roughly 23% of the broad market, meaning a single earnings miss from one of these names can move the entire index measurably.
Technology stocks, carrying a 32.6% index weight, fell more than 8% in Q1 2026 and contributed approximately 3 percentage points of the market's 4.2% quarterly loss, then surged 15% in April and delivered 4.9 points of the index's 9.2-point recovery.
A cap-weighted index assigns each stock a weight based on its market capitalisation, so larger companies have greater influence on returns, while an equal-weighted index gives every constituent the same weight regardless of size, reducing concentration in the largest names.
Investors can audit the actual weighting of their top five holdings across all index funds they hold, consider adding equal-weight or sector-diversified funds as complements to a cap-weighted core, and reassess expectations ahead of earnings seasons given the outsized market impact of a handful of names.
According to Morningstar's February 2026 analysis, current US equity market concentration has surpassed its 1930s historical peak, a level that had stood as the prior extreme for nearly a century.