Australia’s Inflation Hits 4.6%, RBA Rate Hike Odds Near 62%
36 mins ago
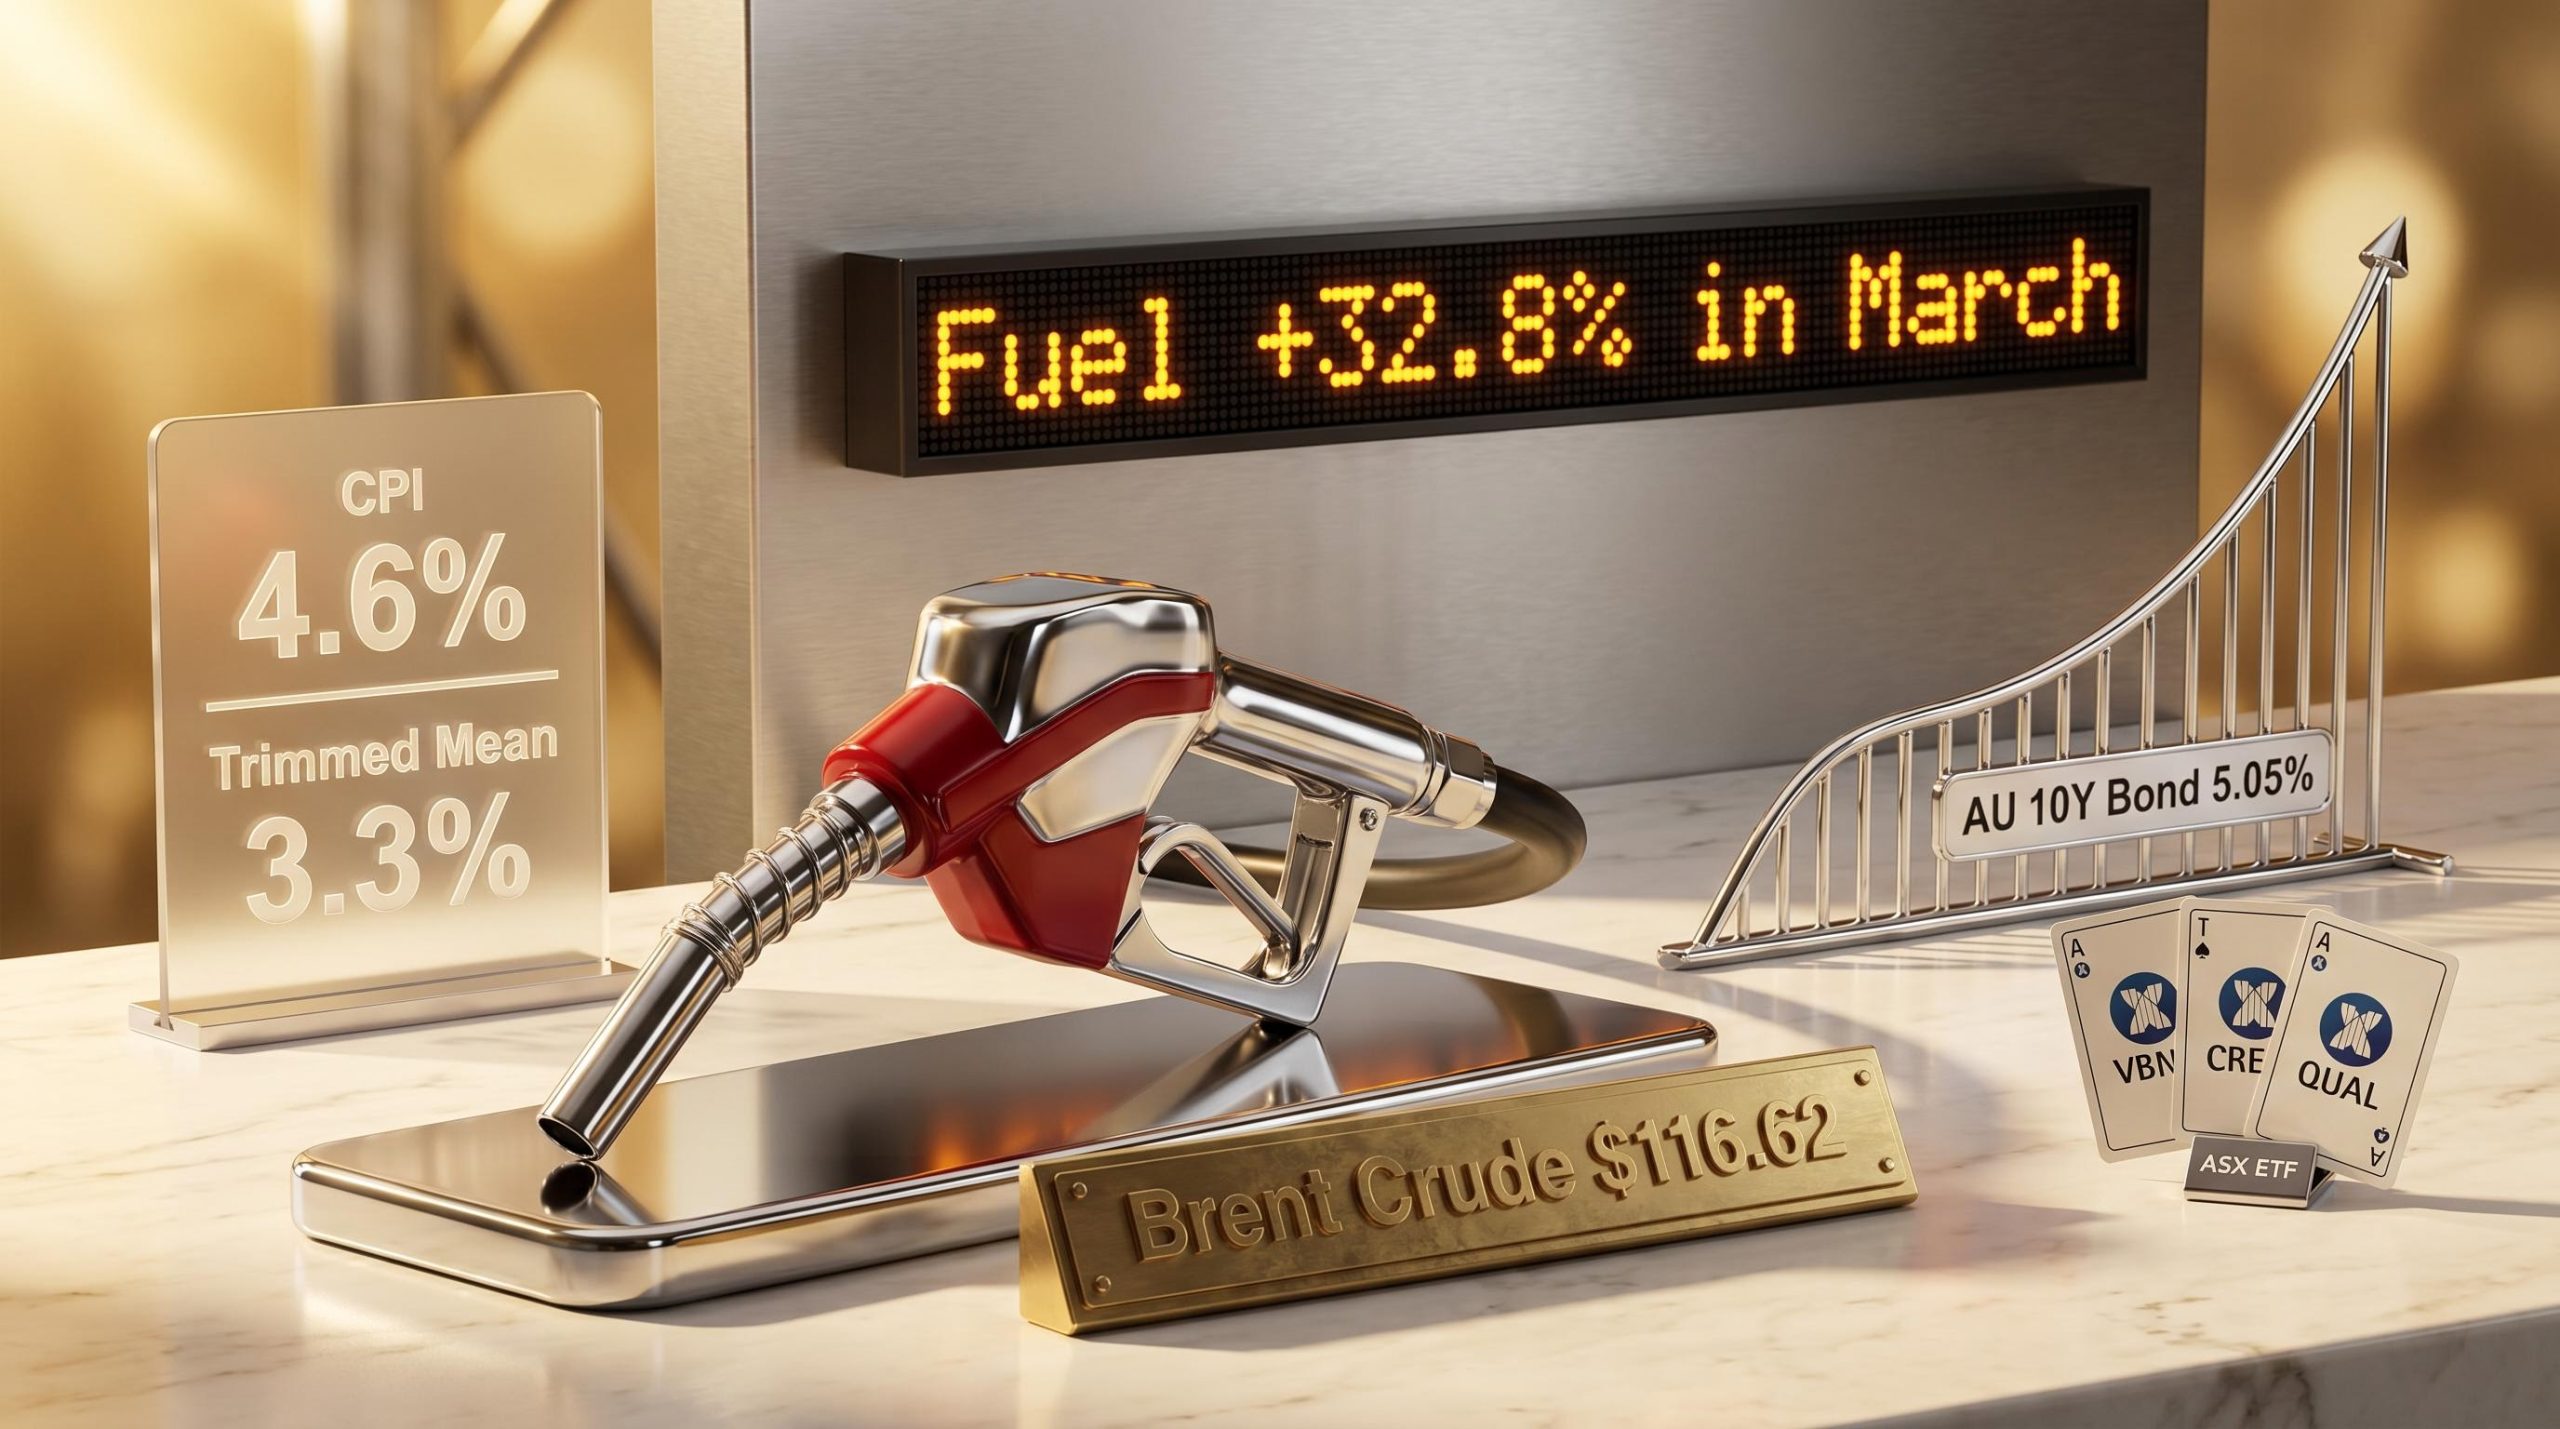
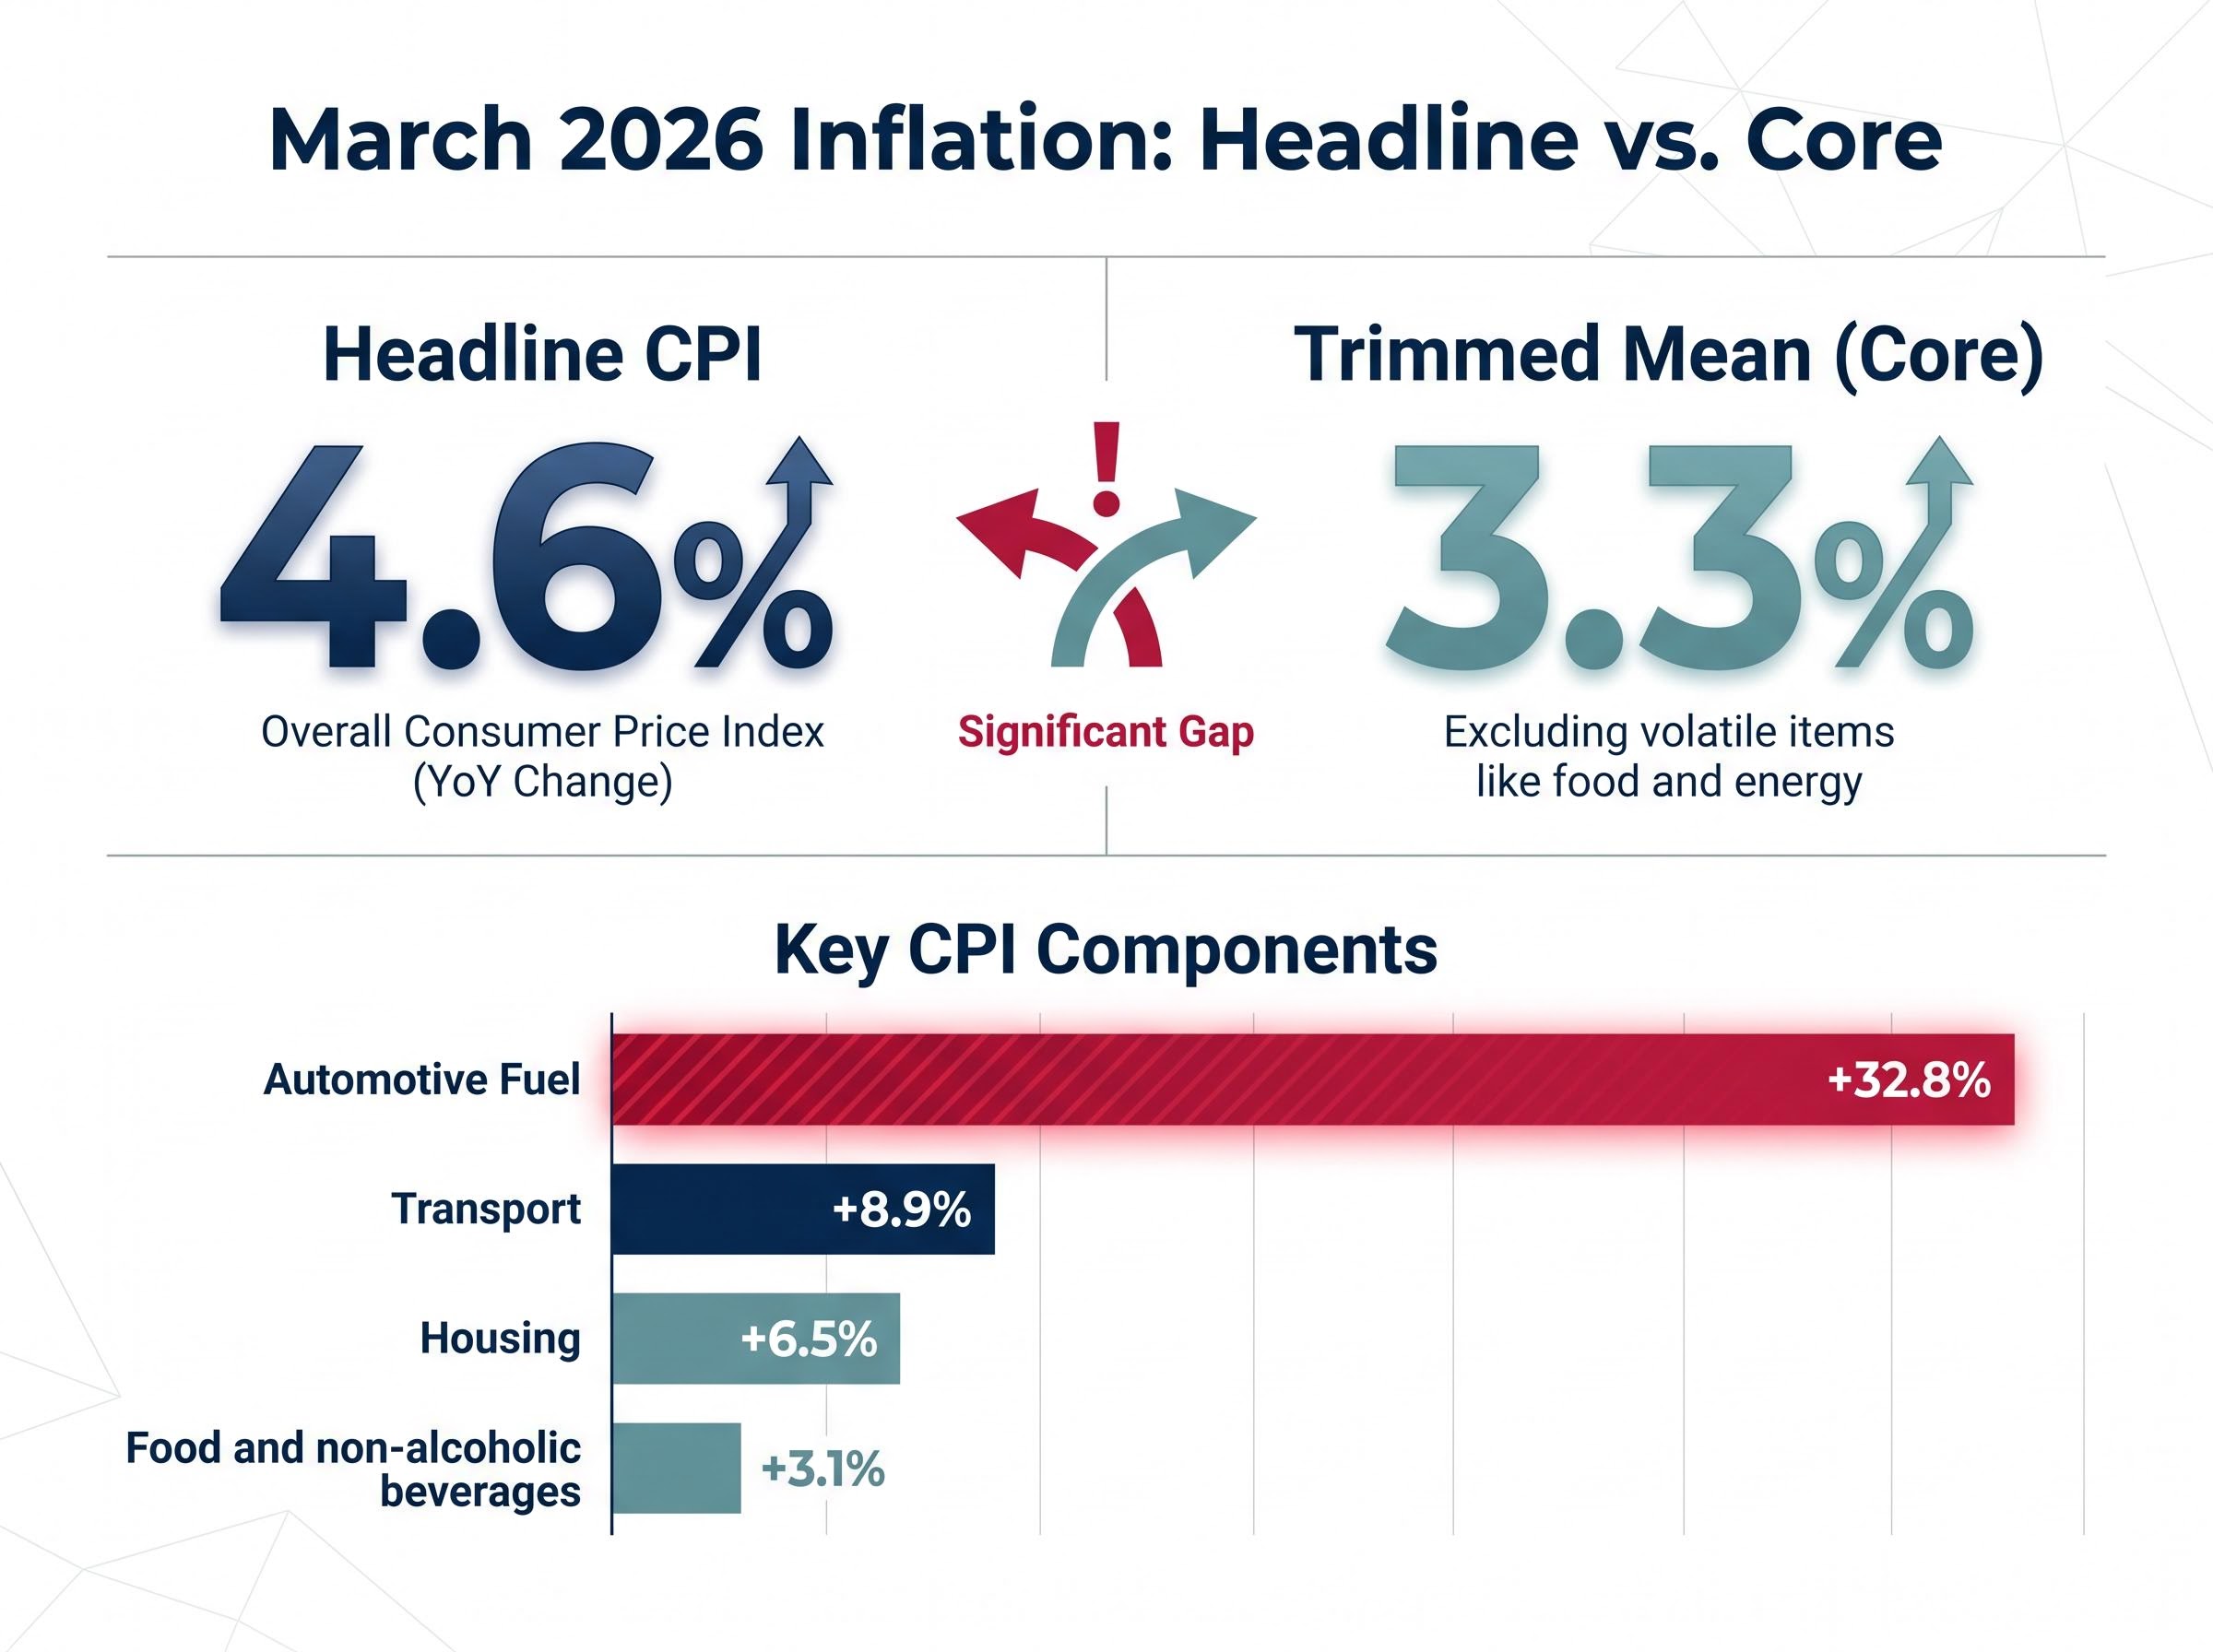
Australia’s headline inflation rate hit 4.6% in March 2026, its sharpest monthly acceleration in years. A 32.8% single-month surge in automotive fuel costs, driven by the Middle East conflict that has pushed Brent crude to $116.62 per barrel, did most of the heavy lifting. Markets are pricing in Reserve Bank of Australia (RBA) rate rises, and investor anxiety about a sustained tightening cycle is compressing ASX 200 sentiment.
The headline number is alarming. The underlying picture is more nuanced. Trimmed mean inflation held steady at 3.3%, oil futures are in backwardation, and a suite of disinflationary forces remain structurally in play. This is not a simple inflation story, and reacting to it as one carries real portfolio risk.
This guide unpacks what the March 2026 data actually says, explains why the current rate environment may be shorter-lived than markets assume, and translates that analysis into six specific ASX-listed exchange-traded funds (ETFs) across fixed income, global equities, and cash that Australian retail investors can use to position portfolios right now.
The Australian Bureau of Statistics (ABS) Monthly CPI Indicator, released 29 April 2026, showed annual inflation at 4.6% for March. That figure arrived after readings of 3.8% in January and 3.7% in February, meaning the acceleration was not gradual. It was concentrated in a single month.
Transport inflation hit 8.9% annually. Automotive fuel rose 24.2% on an annual basis and 32.8% in March alone.
The 32.8% monthly increase in automotive fuel was the strongest since the ABS series began in 2017, directly attributable to the US-Iran conflict and sustained Strait of Hormuz disruption that pushed Brent crude to $116.62 per barrel.
Housing costs rose 6.5%, while food and non-alcoholic beverages increased 3.1%. The table below places these components side by side.
| CPI Component | Annual Change (March 2026) |
|---|---|
| Transport | +8.9% |
| Housing | +6.5% |
| Food and non-alcoholic beverages | +3.1% |
Trimmed mean inflation, the RBA’s preferred measure, strips out the most volatile price movements from both ends of the distribution. It held flat at 3.3% in March, unchanged from February. That stability, while headline CPI jumped nearly a full percentage point, signals that the underlying economy is not running hot in the way the headline implies. The spike is concentrated in energy, not broad-based consumer demand.
Investors who react to the 4.6% figure without understanding this composition risk making poorly timed decisions. Knowing that core inflation sits at 3.3% is the single most useful data point before deciding how aggressively to reposition.
For investors who want to build the conceptual foundation before evaluating specific ETF positions, our full explainer on CPI and RBA rate hikes covers how the trimmed mean is calculated, why rate hikes work differently against cost-push versus demand-pull inflation, and what the RBA’s stated inflation target means for households with variable mortgages and savings accounts.
Supply-driven oil price shocks follow a pattern that has repeated across decades. Energy costs spike, headline inflation jumps, central banks face pressure to tighten, and then the growth slowdown caused by higher energy costs becomes the dominant concern. Historically, this sequence produces a rate reversal within six to twelve months of the initial shock.
The current disruption fits this pattern. US-Iran tensions escalated materially in March 2026. A 14-day ceasefire was agreed in early April 2026, though peace talks remain fragile and Strait of Hormuz concerns have persisted into late April. The oil market’s own forward curve offers a concrete signal about how traders view the disruption’s duration.
Oil futures are in backwardation as of late April 2026, meaning near-term contracts are priced above longer-dated ones. In plain terms, traders are paying a premium for immediate oil delivery but expect supply conditions to ease over the coming months. Backwardation is the market’s way of pricing a disruption as temporary rather than structural.
CME Group analysis of WTI oil futures backwardation published in April 2026 confirmed the steep curve inversion following Strait of Hormuz disruption and concluded that market pricing reflected an expectation of near-term supply normalisation rather than a permanent structural shift in crude availability.
The contrast with genuine structural inflation episodes is instructive. During the 1970s oil shocks, inflation expectations became unanchored because energy costs stayed elevated for years, triggering a second wave that proved far more damaging than the first. In response, the US Federal Reserve’s aggressive tightening in 1980-1982 brought inflation from 14% to 3%, but at the cost of unemployment exceeding 10%. Central banks today are acutely aware of that trade-off, which makes over-tightening into a temporary supply shock a risk the RBA would prefer to avoid.
Three disinflationary forces remain structurally in play alongside the current energy spike:
If markets have over-priced rate rises and the RBA reverses course within six to twelve months, investors who locked into defensive positioning too aggressively may miss the subsequent fixed income and equity recovery.
The type of inflation matters as much as its level. Two distinct mechanisms drive prices higher, and the appropriate investment response differs for each.
The March 2026 situation is clearly cost-push, driven by the energy supply disruption in the Middle East. The question investors need to answer is whether it stays that way or triggers a wage-price spiral.
The latest ABS Wage Price Index (WPI) data, from December 2025, showed 3.4% annual wage growth. That figure sits below the headline CPI of 4.6%, meaning real wages are negative. Historically, negative real wages suppress consumer demand, which is itself a disinflationary force.
The March 2026 WPI release is due 13 May 2026. If wage growth has accelerated toward or above 4%, the spiral risk becomes more credible and the RBA’s hand is forced further toward rate rises. If it remains around 3.4%, the cost-push thesis holds and the case for a shorter rate cycle strengthens.
International Monetary Fund research suggests each additional percentage point of inflation beyond 3% in a developed economy is associated with a 0.1-0.2% reduction in real GDP growth, reinforcing why the RBA will be watching the wage data closely before committing to further tightening.
Rising bond yields, driven by rate rise expectations, have made fixed income meaningfully more attractive as an income source. The Australian 10-year government bond yield stood at 5.05% as of 30 April 2026, a level that represents a materially different income environment compared to the near-zero rate era of 2015-2021.
A 5.05% yield on the Australian 10-year government bond offers income that was unavailable for much of the past decade. For investors who spent the 2010s earning negligible returns on fixed income allocations, this represents a generational shift in the asset class’s utility.
Two ASX-listed ETFs offer distinct approaches to capturing this opportunity.
| ETF Name | ASX Code | Focus | Currency Risk | Suitable For |
|---|---|---|---|---|
| Vanguard Global Aggregate Bond Index (Hedged) ETF | VBND | Global government and corporate investment-grade bonds | AUD-hedged | Investors seeking diversified global fixed income without currency exposure |
| BetaShares Australian Investment Grade Corporate Bond ETF | CRED | Senior fixed-rate bonds from high-quality Australian issuers | None (AUD-denominated) | Investors favouring domestic exposure as rates approach their peak |
VBND provides broad, AUD-hedged exposure to global investment-grade bonds. The currency hedge is particularly relevant with the AUD/USD at 0.7081 as of 29 April 2026; without it, movements in the Australian dollar could overwhelm fixed income returns.
CRED focuses on senior fixed-rate bonds from Australian issuers. If interest rates are approaching their peak, as the historical supply-shock pattern suggests, locking in current yields through domestically focused fixed-rate bonds positions the holder to benefit as rates eventually decline and bond prices rise.
CRED distribution yield currently sits at 5.2%, with a yield to maturity of 6.26%, figures that place it above both the headline CPI rate and the RBA cash rate and make it the only confirmed above-inflation fixed income option among the six ETFs commonly grouped for this environment.
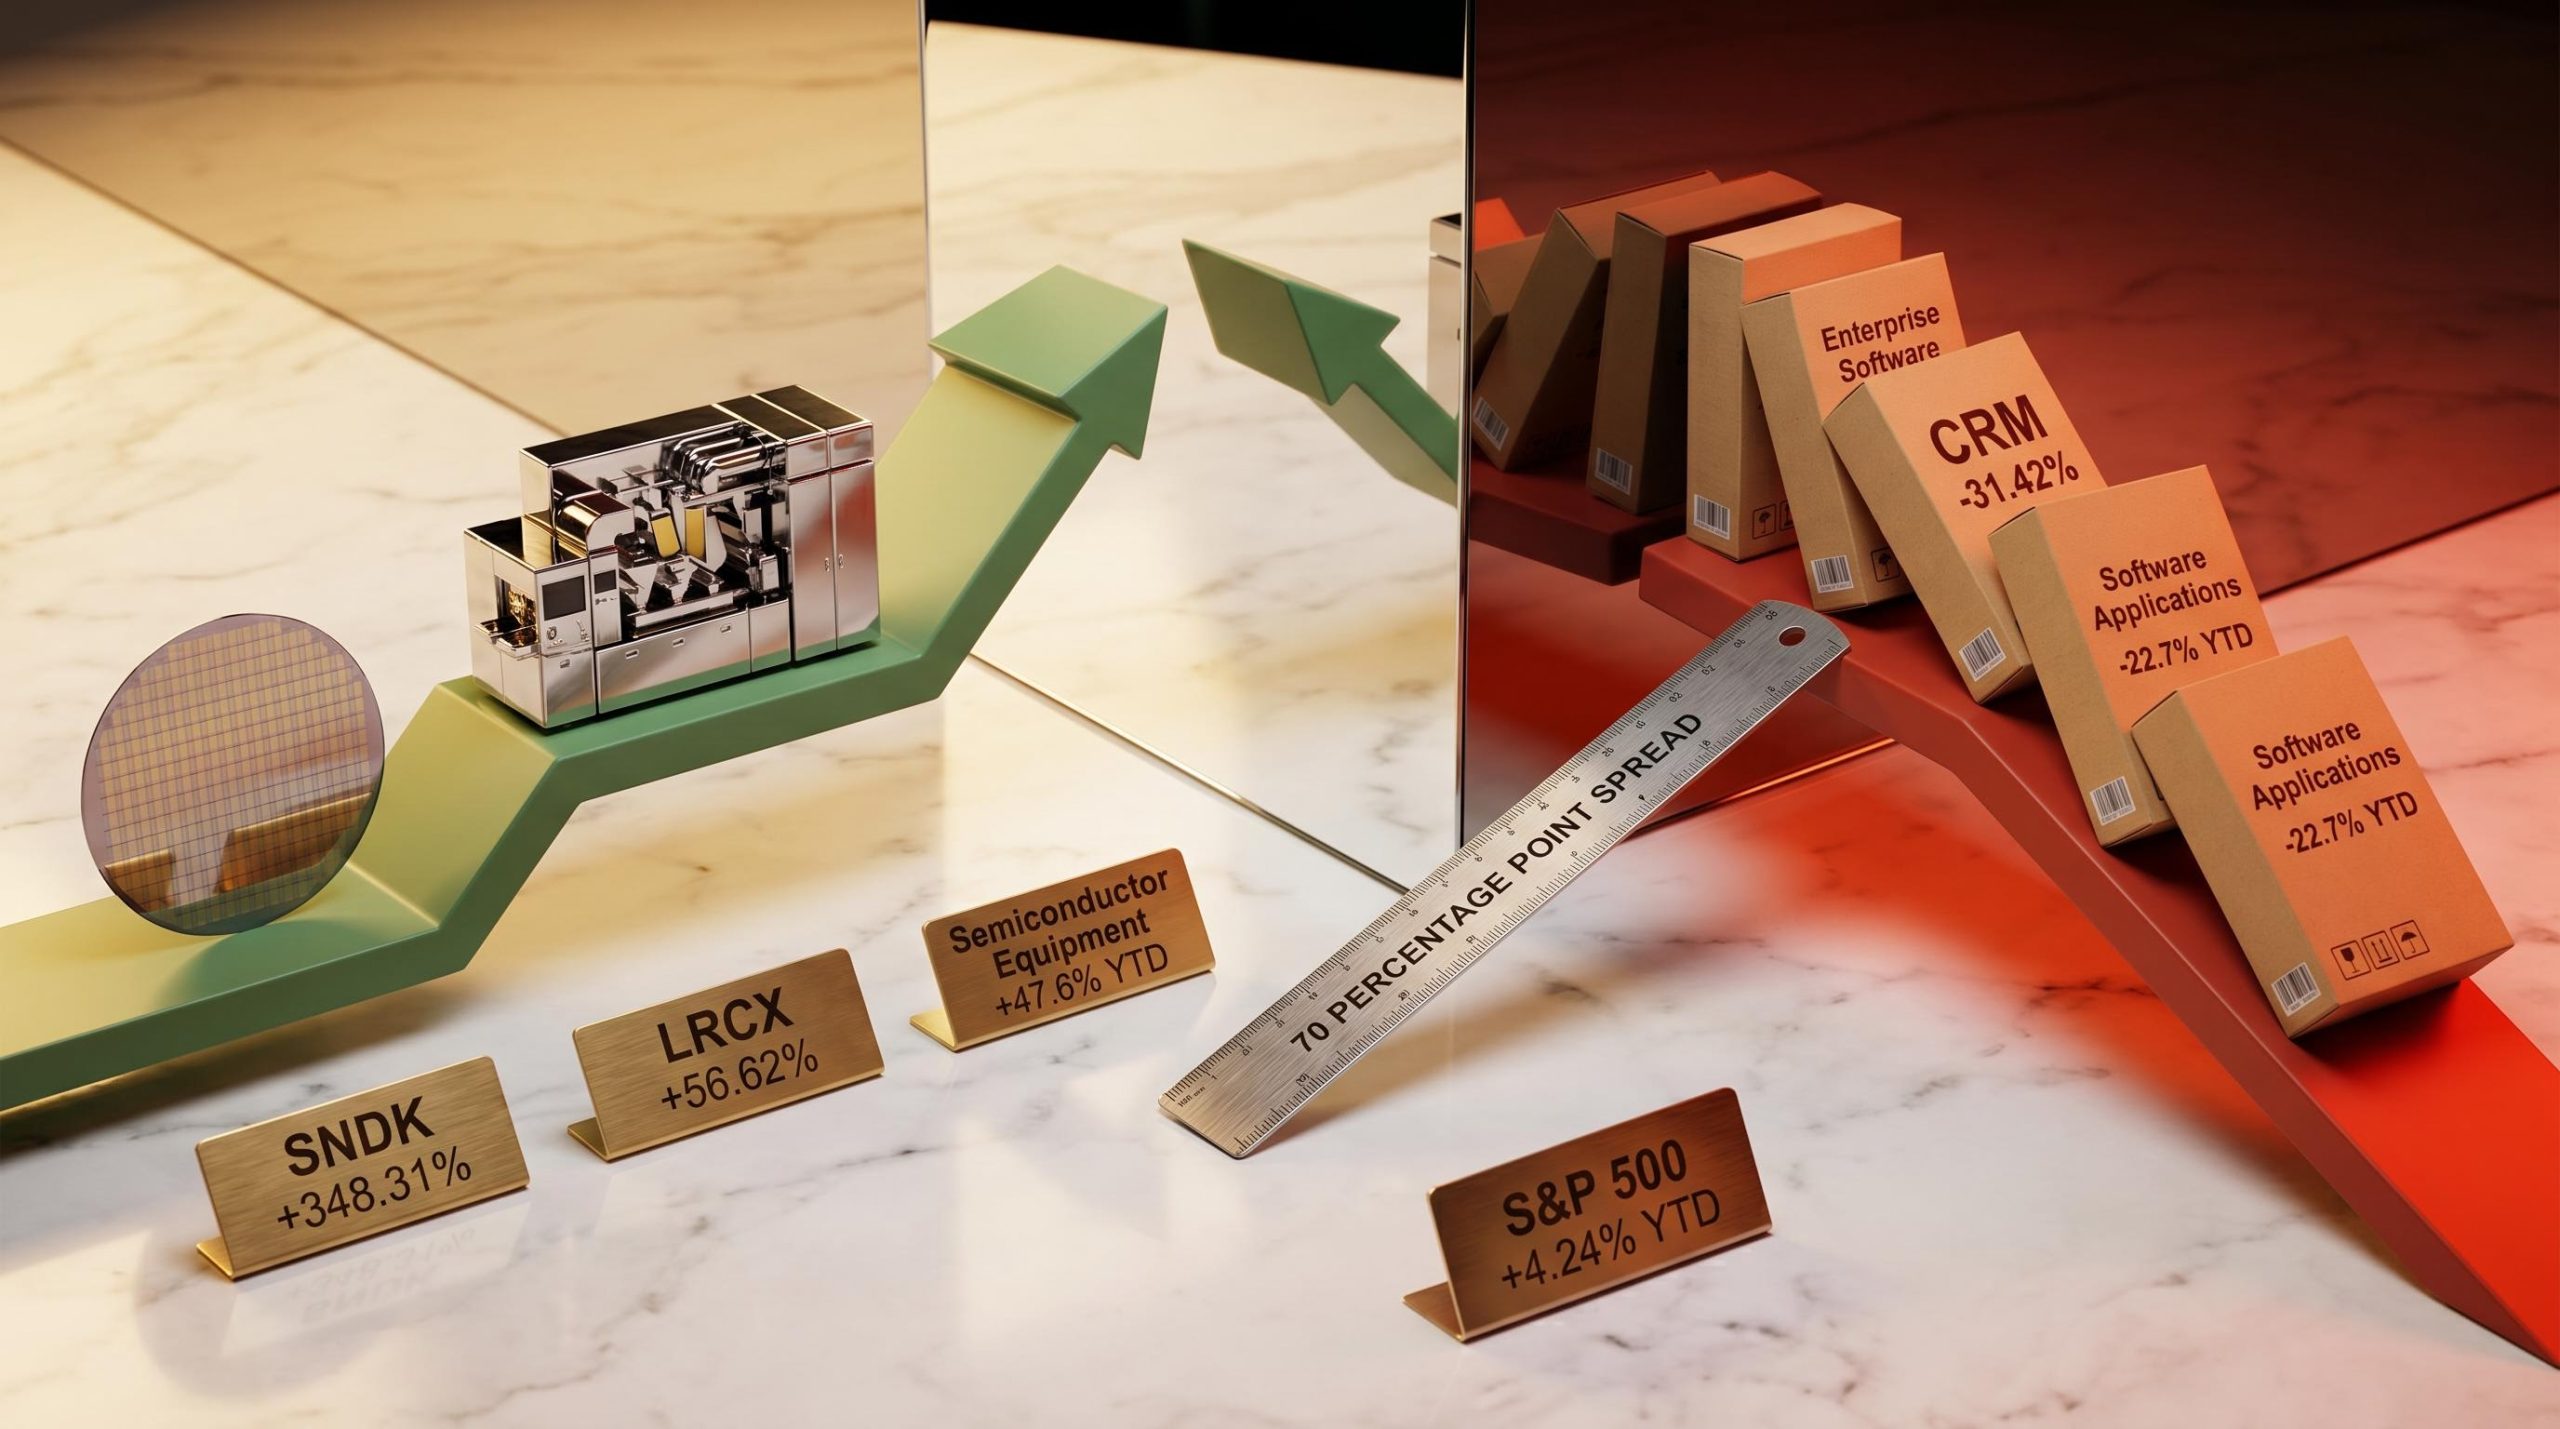
Two global equity ETFs address different aspects of the current inflation environment, while two cash ETFs preserve the flexibility to act when conditions shift.
Vanguard MSCI Index International Shares ETF (ASX: VGS) provides exposure to over 1,000 large-cap companies across developed markets excluding Australia. For investors who want to participate in a global recovery regardless of where it materialises geographically, VGS is the broadest available ASX-listed tool for that purpose.
VanEck MSCI International Quality ETF (ASX: QUAL) takes a more targeted approach. It screens developed-market equities for three characteristics that allow companies to protect margins during inflationary periods:
Quality factor screening, which selects for high return on equity, low financial leverage, and demonstrated pricing power, is structurally better positioned than broad market exposure in a stagflationary environment because companies meeting all three criteria can protect margins without relying on volume growth that rising input costs are simultaneously compressing.
Companies that can raise prices without losing customers, while carrying minimal debt that becomes more expensive in a rising-rate environment, are structurally better positioned than the broader market when input costs are elevated. The ASX 200 closed at 8,622 points on 30 April 2026, with the energy sector outperforming amid elevated oil prices. QUAL’s quality screen offers a complementary approach for investors who want inflation resilience beyond pure energy exposure.
Maintaining a cash allocation is not a retreat from markets. It is a positioning tool. Dollar cost averaging (DCA), the practice of deploying capital in regular increments rather than a single lump sum, allows investors to buy more units when prices are lower during sell-offs and fewer when prices are elevated.
BetaShares Australian High Interest Cash ETF (ASX: AAA) holds AUD bank deposit accounts, offering capital preservation and consistent income. iShares Enhanced Cash ETF (ASX: ISEC) holds short-duration money market instruments and corporate bonds, providing a marginally higher yield than deposit-based alternatives.
Both products generate income while the cash waits to be deployed, eliminating the drag of sitting in a non-interest-bearing account. In a market environment where gold has averaged approximately $7,110.98 per ounce in AUD through April 2026, reflecting the broader flight to inflation hedges, a cash buffer provides optionality that a fully invested portfolio does not.
| ETF Name | ASX Code | Category | Key Characteristic | Role in Portfolio |
|---|---|---|---|---|
| Vanguard MSCI Index International Shares ETF | VGS | Global equities | 1,000+ developed-market large caps | Broad recovery participation |
| VanEck MSCI International Quality ETF | QUAL | Global equities (quality tilt) | High profitability, low leverage, pricing power | Inflation-resilient equity exposure |
| BetaShares Australian High Interest Cash ETF | AAA | Cash | AUD bank deposits | Capital preservation and deployment flexibility |
| iShares Enhanced Cash ETF | ISEC | Cash | Short-duration money market instruments | Marginally higher yield with liquidity |
The core thesis is straightforward: energy-driven headline inflation is real, but the evidence points to it being temporary. Oil futures are in backwardation. The ceasefire, however fragile, has established a framework for de-escalation. Trimmed mean inflation has held steady at 3.3%. The portfolio response should be calibrated to that temporariness, not to a worst-case scenario of sustained structural inflation.
Three conditions would change the calculus toward a more persistent inflationary cycle:
Until those conditions materialise, the investment logic remains: fixed income for income generation at historically attractive yields, quality equities for pricing-power protection against margin compression, and a cash buffer for the flexibility to deploy capital during dislocations, with DCA as the execution mechanism.
Portfolio construction summary: VBND and CRED capture fixed income at 5.05% yields. VGS and QUAL provide global equity exposure with an inflation-resilient quality tilt. AAA and ISEC hold cash that earns income while preserving optionality to act on further market weakness.
Investors who understand the signals that confirm or refute the transitory thesis are positioned to adjust dynamically rather than making a single defensive bet that may cost them the recovery upside.
Investors wanting to stress-test this thesis against quantitative modelling will find our deep-dive into the RBA rate cycle peak, which applies the Taylor Rule to current data, examines Oxford Economics modelling on potential back-to-back Australian GDP contractions in mid-2026, and maps historical supply-shock rate cycles against the current Hormuz disruption timeline.
Past performance does not guarantee future results. Financial projections are subject to market conditions and various risk factors.
The combination of 5.05% bond yields, quality equities under pressure, and a likely temporary oil shock creates a simultaneous opportunity across multiple asset classes that does not appear in normal market conditions. Six ASX-listed ETFs provide the building blocks: VBND and CRED for income, VGS and QUAL for equity participation, AAA and ISEC for flexibility.
The 13 May wage data release is the next input that will confirm or challenge this framework. Investors who have built their position before then will be better placed to respond to whatever the data shows, rather than reacting after the market has already priced it in.
This article is for informational purposes only and should not be considered financial advice. Investors should conduct their own research and consult with financial professionals before making investment decisions.
Headline inflation includes all price movements, including volatile items like fuel, while core inflation (trimmed mean) strips out extreme price swings. In March 2026, Australia's headline CPI hit 4.6% largely due to a 32.8% fuel spike, while trimmed mean inflation held steady at 3.3%, indicating the spike was not broadly based.
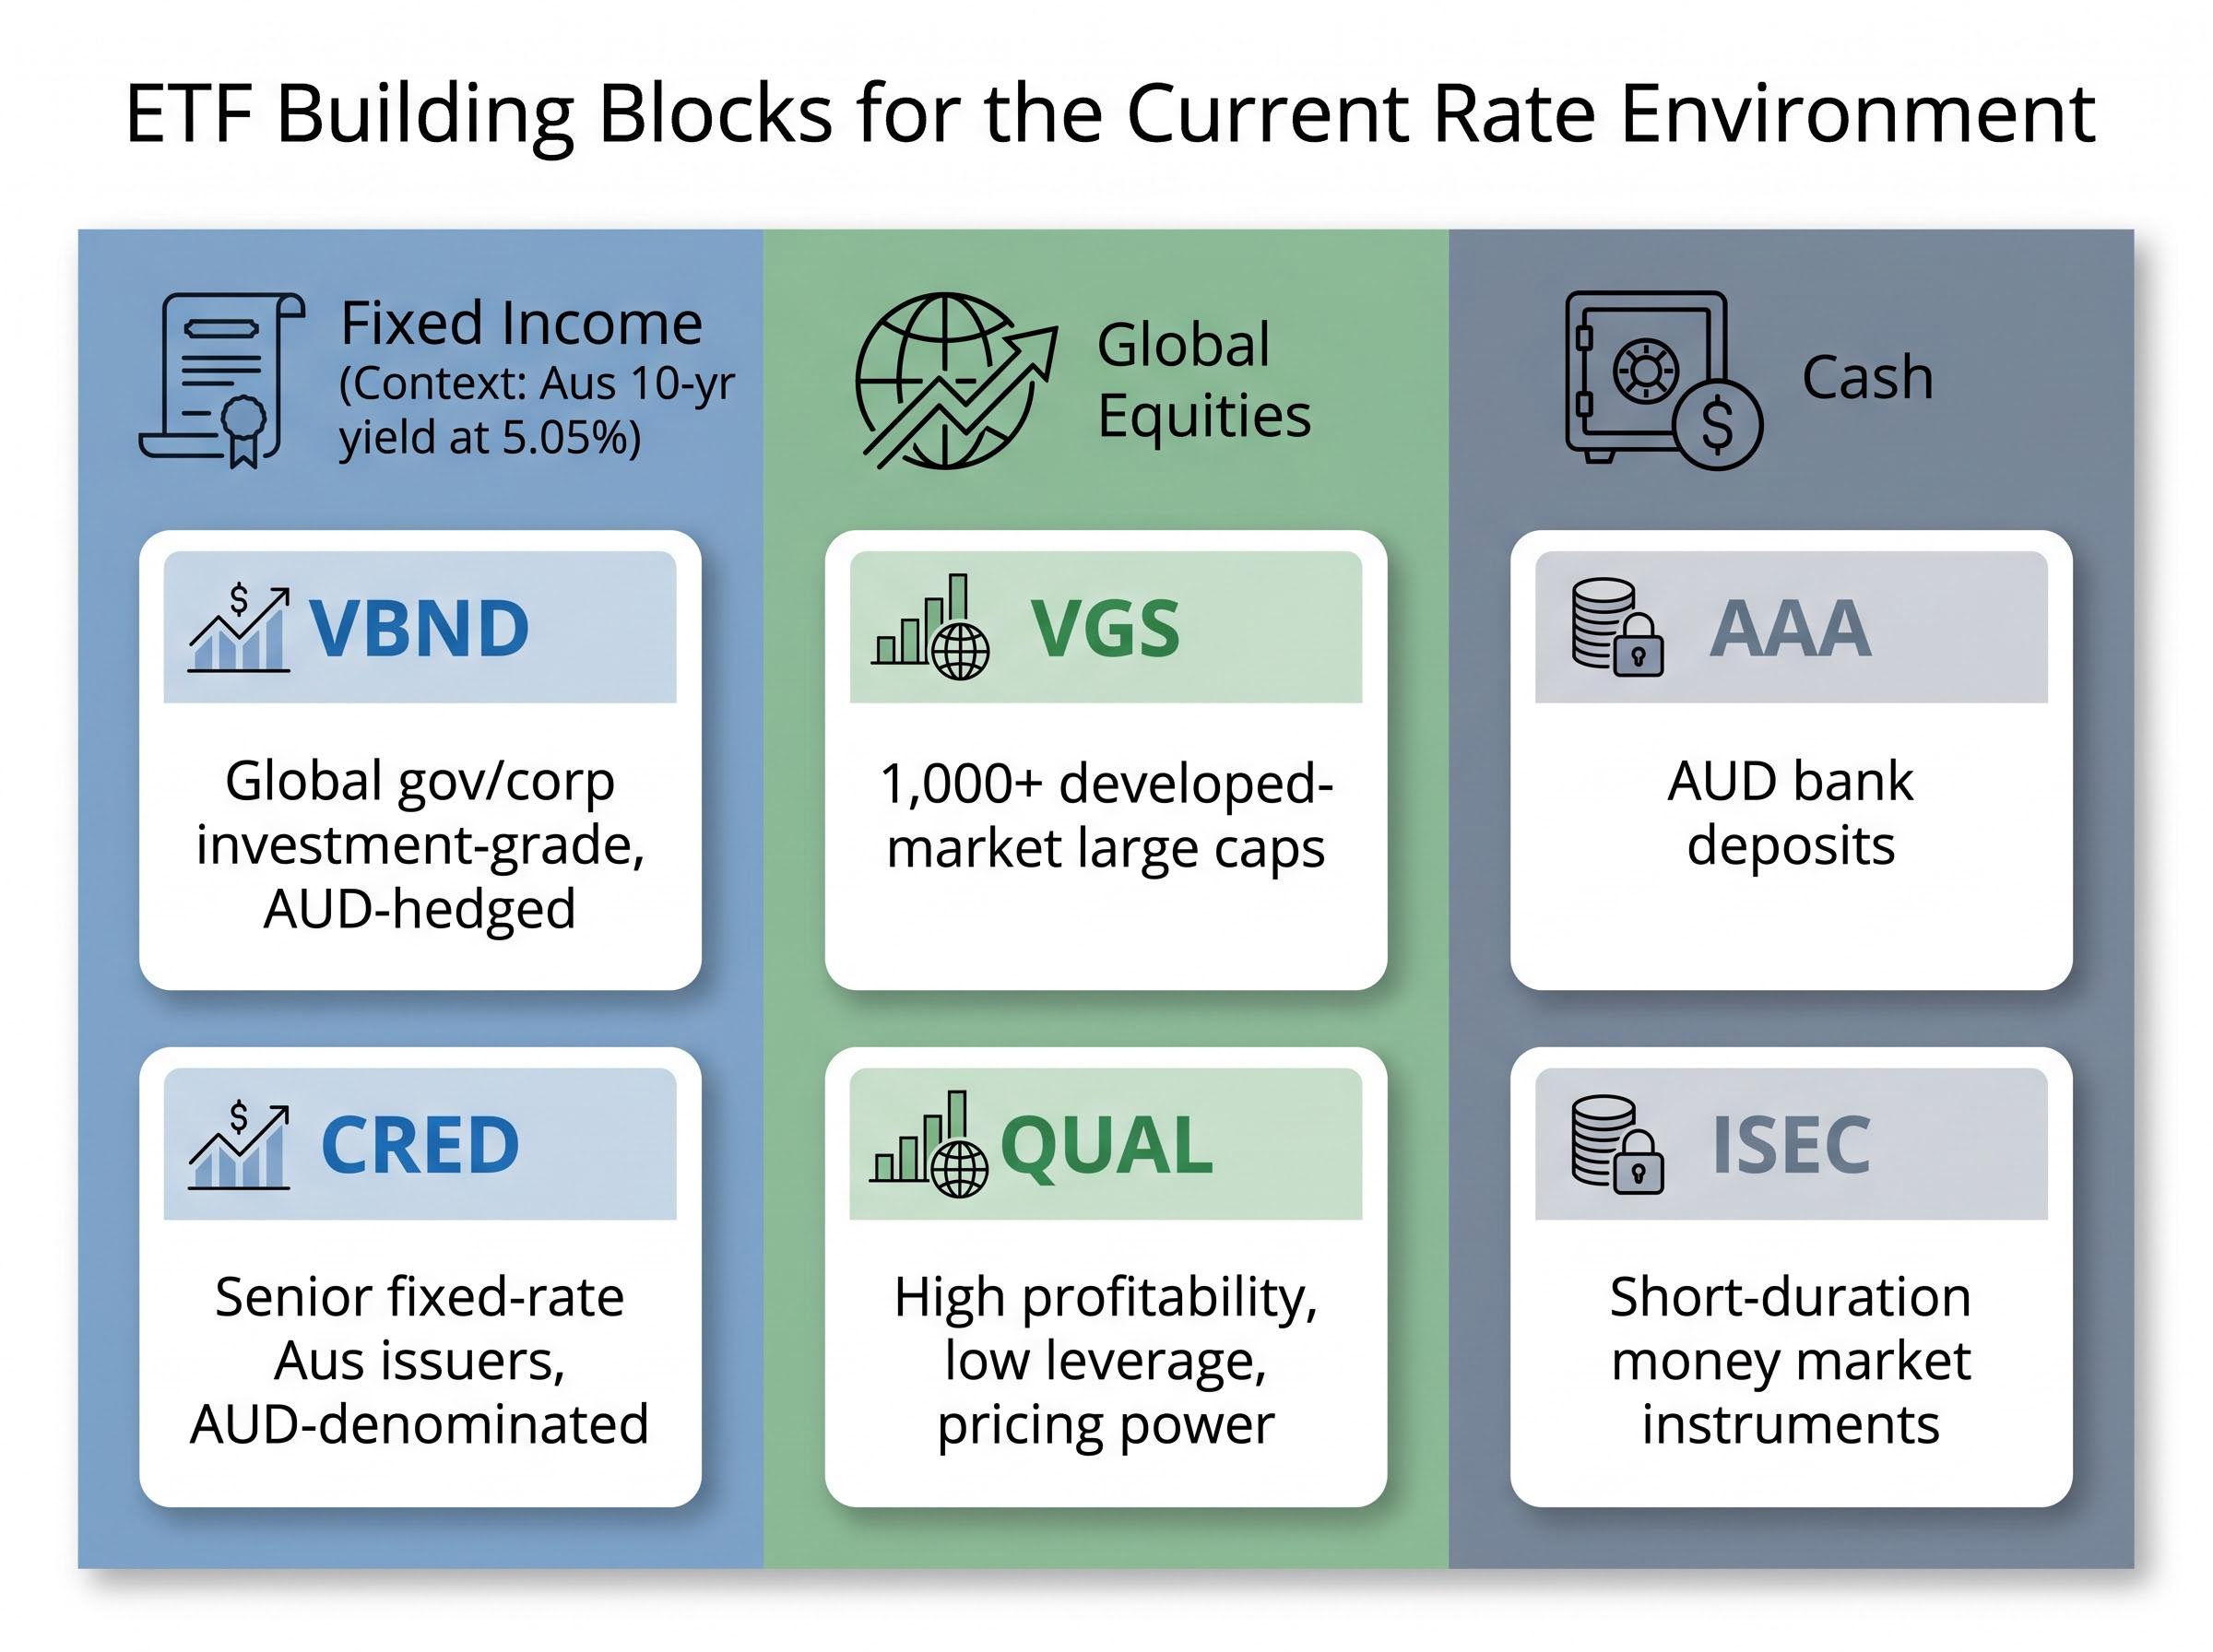
Six ASX ETFs are commonly cited for the current inflation environment: VBND and CRED for fixed income income generation, VGS and QUAL for global equity exposure with an inflation-resilient quality tilt, and AAA and ISEC for cash preservation and deployment flexibility.
Oil futures in backwardation means near-term contracts are priced higher than longer-dated ones, signalling that traders expect the current supply disruption to be temporary. For Australian investors, this supports the view that the current energy-driven inflation spike may be short-lived, reducing the likelihood of a prolonged RBA rate-tightening cycle.
Cost-push inflation is driven by rising input costs such as energy or raw materials rather than excess consumer demand, and it often reverses when the supply disruption resolves. The March 2026 Australian inflation spike is cost-push in nature, which means the appropriate portfolio response differs from a genuine overheating economy scenario.
The ABS Wage Price Index release on 13 May 2026 is the next critical signal: if wage growth accelerates above 4%, the risk of a wage-price spiral becomes more credible and the case for persistent RBA rate rises strengthens, while wage growth remaining near 3.4% supports the view that the current inflation episode is temporary.