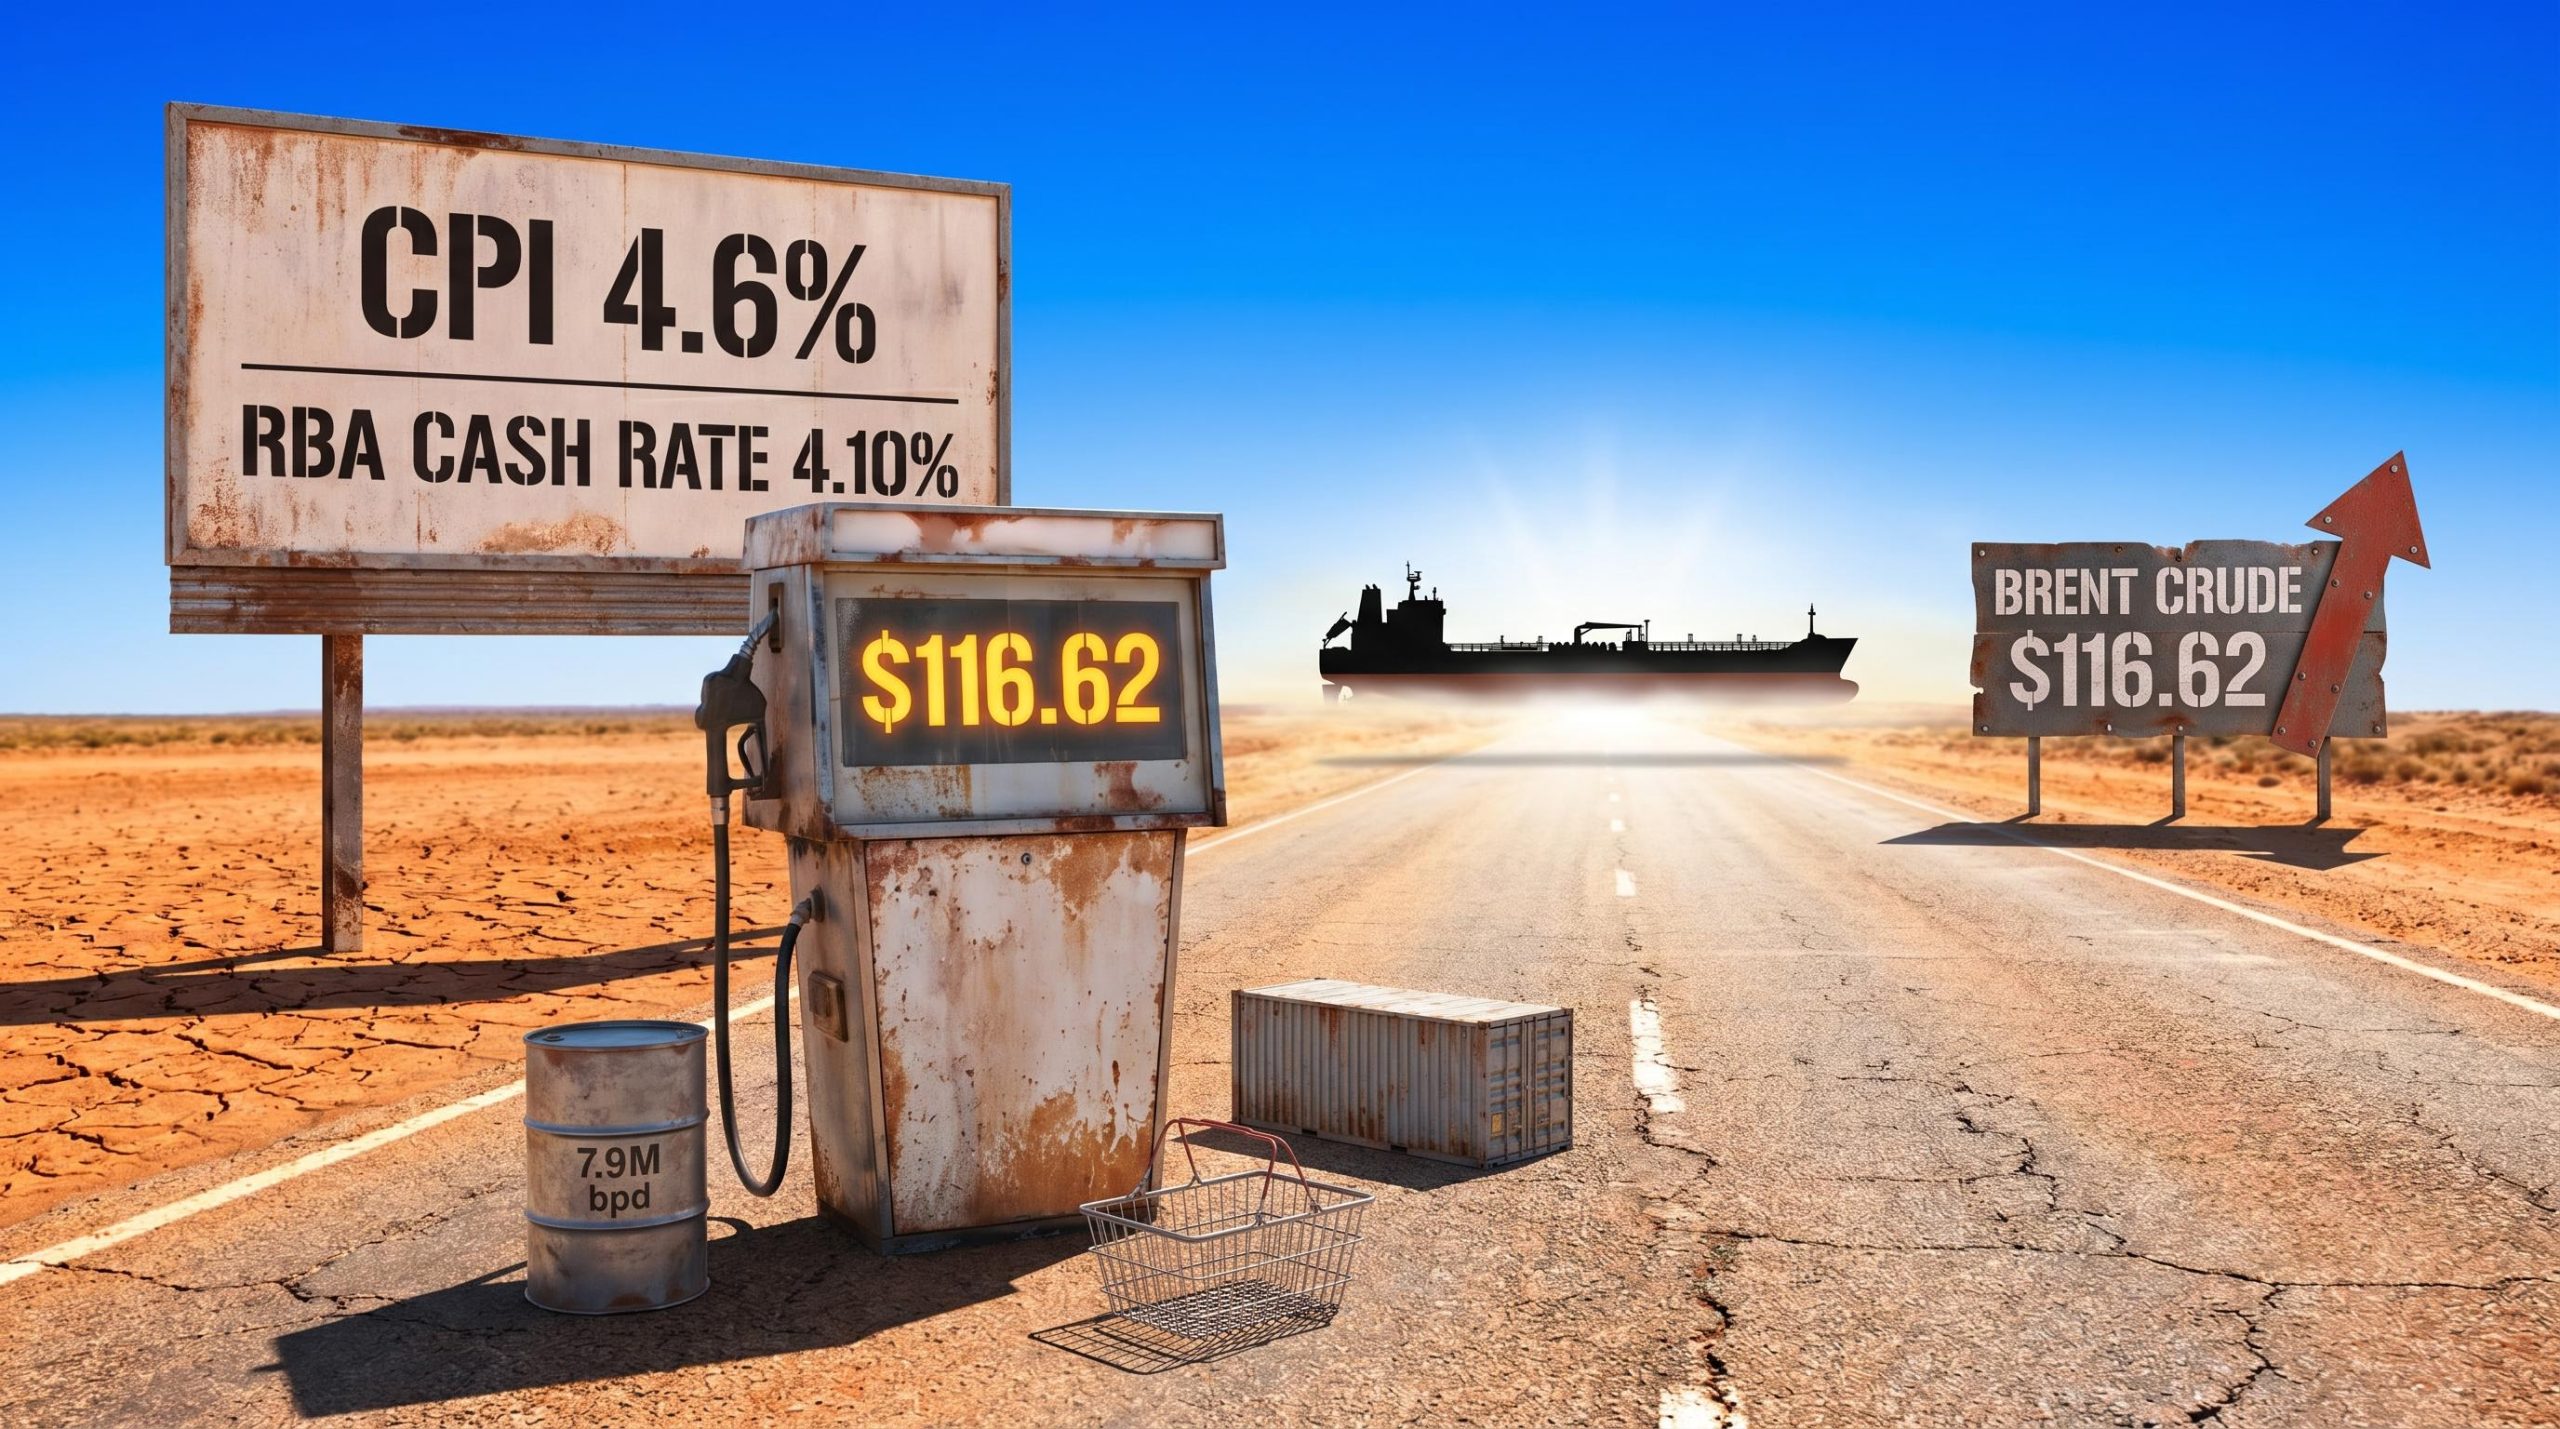
Australia’s headline consumer price index surged to 4.6% in the 12 months to March 2026, its highest level in roughly two and a half years. The acceleration is directly traceable to Iran war oil disruptions that the International Energy Agency has called the greatest global energy security challenge in history. The Reserve Bank of Australia has already responded, lifting the cash rate to 4.10% in March 2026, and markets now expect two further hikes to approximately 4.7% by September 2026.
Yet the historical relationship between supply-driven oil shocks and interest rates is more complicated than a simple upward trajectory. Australian investors face a genuine dilemma: position for sustained inflation, or prepare for the growth slowdown that usually follows. This guide explains the mechanics driving current conditions, examines what history says about how oil shocks typically resolve, identifies the disinflationary forces still at work, and provides a concrete inflation investing strategy for navigating both outcomes on the ASX.
Why a closed strait is driving prices at the checkout
The Strait of Hormuz handles approximately 20% of global oil supply. When strikes began in late February 2026 and the strait closed, the physical removal of crude from global markets was immediate and unprecedented.
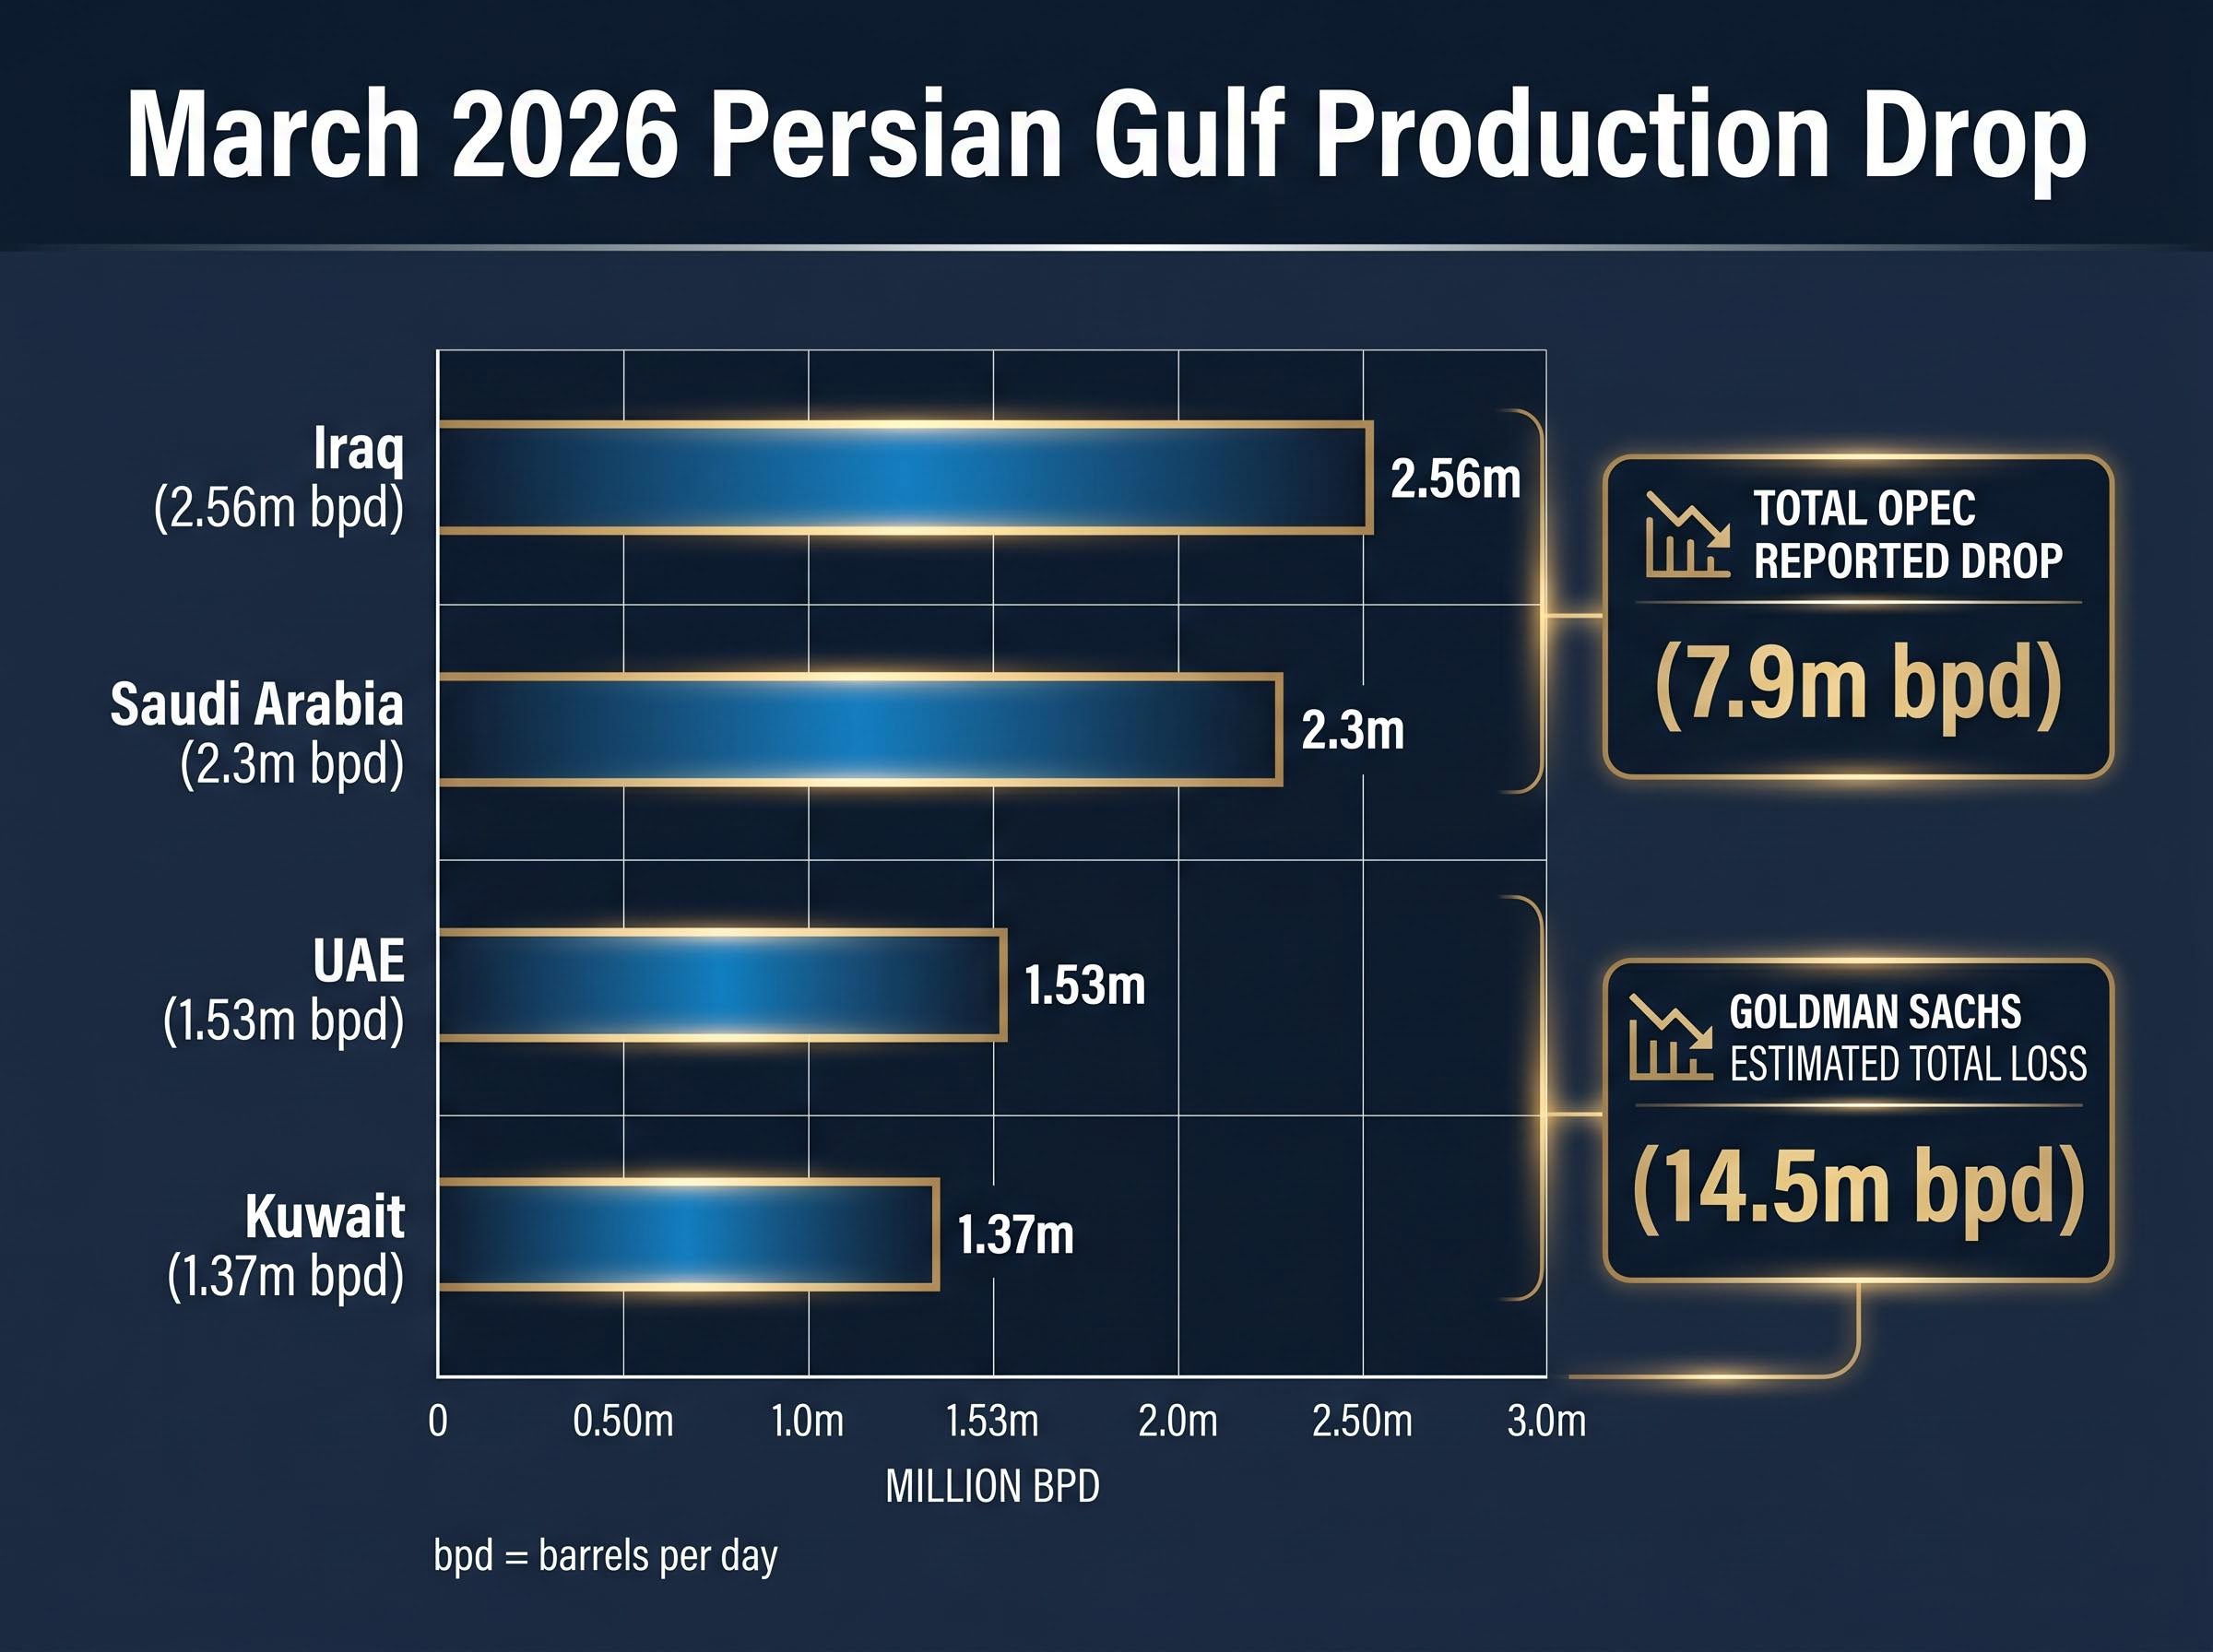
OPEC reported a total crude production drop of 7.9 million barrels per day in March 2026, with Iraq losing approximately 2.56 million bpd, Saudi Arabia 2.3 million bpd, the UAE 1.53 million bpd, and Kuwait 1.37 million bpd. Goldman Sachs estimated a broader loss of 14.5 million bpd from Persian Gulf production overall. QatarEnergy declared force majeure on exports.
The IEA characterised the disruption as the “greatest global energy security challenge in history.”
Brent crude sat at approximately $116.62 per barrel on 29 April 2026, with June futures trading at $120.53. Those prices do not stay at the refinery gate.
The global oil supply deficit driving current prices reflects more than the strait closure alone; Goldman Sachs projects a 9.6 million barrel per day shortfall when storage depletion timelines, cartel fragmentation from the UAE’s impending exit, and Iranian field shut-in risks are combined, a structural picture that extends the potential duration of the disruption beyond what a pure logistics recovery would imply.
From Persian Gulf to petrol pump: the price transmission chain
The mechanism from crude price to consumer shelf follows a direct chain:
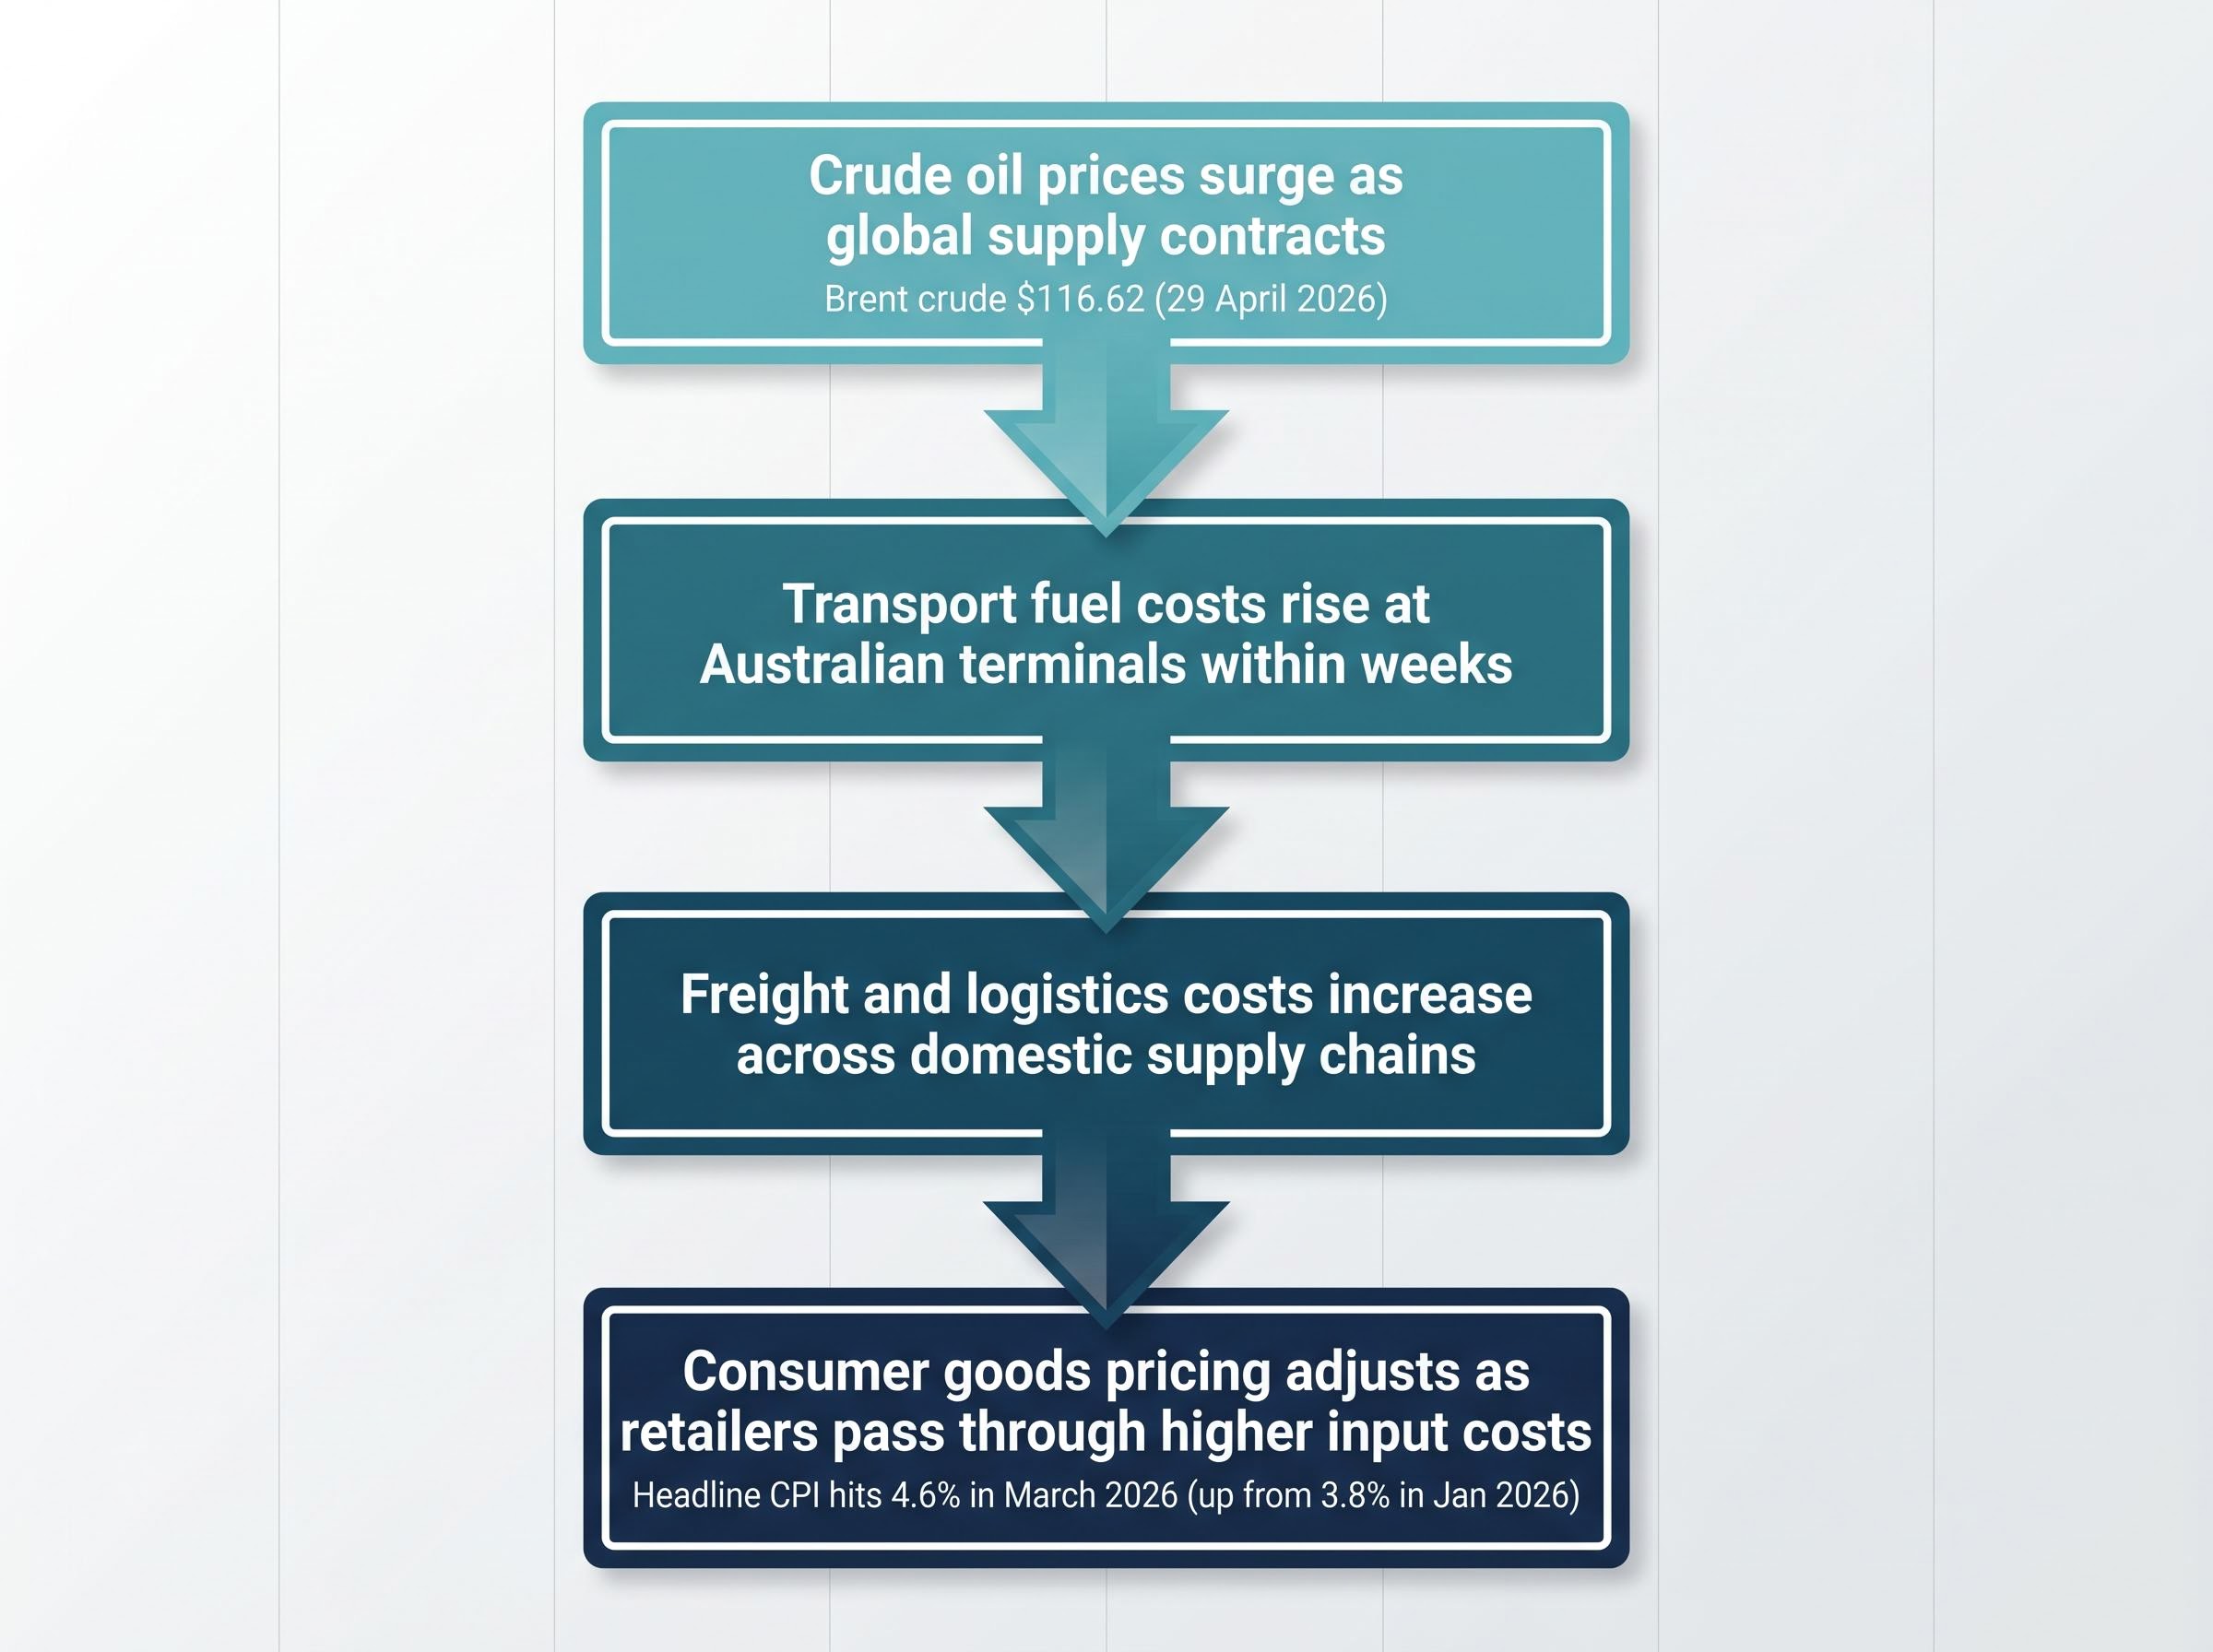
- Crude oil prices surge as global supply contracts
- Transport fuel costs rise at Australian terminals within weeks
- Freight and logistics costs increase across domestic supply chains
- Consumer goods pricing adjusts as retailers pass through higher input costs
The 4.6% headline CPI figure represents an acceleration from a 3.8% baseline in the 12 months to January 2026. This means the oil shock landed on already-elevated inflation, not a clean starting point. Trimmed mean inflation at 3.3% confirms the pressure has spread beyond pure energy costs into broader goods and services categories. Investors who treat this as an energy-only story risk underestimating how widely the impact has already dispersed through the Australian economy.
When big ASX news breaks, our subscribers know first
What history says about oil shocks and interest rates
The 1970s oil embargo and the 1980-1982 Federal Reserve tightening cycle are the two reference points most frequently cited when supply-driven energy shocks push inflation higher. Both offer pattern recognition rather than direct prediction, and the pattern is more nuanced than a straightforward “rates go up and stay up” narrative.
In 1980-1982, the US Federal Reserve under Paul Volcker reduced inflation from approximately 14% to approximately 3%. The cost was severe: unemployment exceeded 10%, and the economy entered a deep recession. The Taylor Rule framework, which suggests central banks should raise rates by approximately 1.5 percentage points per 1 percentage point of excess inflation to achieve genuine tightening, guided aggressive action.
The counterintuitive finding from multiple supply-driven oil shock episodes is that rates tend to come back down faster than markets expect. The growth slowdown arrives before the inflation fully resolves, forcing central banks to reverse course within approximately 6-12 months as economic weakness overtakes price concerns.
| Episode | Trigger | Peak inflation | Rate response | Growth outcome |
|---|---|---|---|---|
| 1970s oil shock | OPEC embargo | ~12% (US) | Rates raised but reversed as recession hit | Stagflation, prolonged slowdown |
| 1980-1982 Fed tightening | Second oil shock, entrenched inflation | ~14% (US) | Aggressive hikes to ~20% | Deep recession, unemployment above 10% |
| 2026 Iran shock | Strait of Hormuz closure | 4.6% (Australia, headline) | RBA to 4.10%, market expects ~4.7% | Uncertain; recession risks flagged |
What oil futures backwardation tells investors right now
Backwardation occurs when near-term futures contracts trade at a premium to longer-dated contracts. In plain terms, buyers are paying more for oil delivered soon than oil delivered in six or twelve months, a signal that the market expects current scarcity to ease over time rather than worsen.
The current oil futures curve is in backwardation. This is one market signal consistent with a transitory reading of the disruption, suggesting traders collectively expect supply to recover. It is not a guarantee; backwardation can persist or reverse as conditions change. But it does reframe the rate-hike narrative as more conditional than headlines suggest, which directly affects how aggressively investors should position for a prolonged high-rate environment.
Oxford Economics modelling pointing to potential back-to-back quarterly GDP contractions in Australia for June and September 2026 raises the probability that the RBA rate cycle peak arrives earlier than the September 2026 consensus, with the Taylor Rule implying that even a single 25 basis point move to 4.35% would still leave policy in accommodative territory relative to a 4.6% headline reading, suggesting the market may be pricing too many hikes into an already decelerating growth environment.
Understanding inflation fundamentals before building a strategy
Before making portfolio decisions, it helps to understand which inflation drivers are active in Australia right now and which are not. Three main types of inflation exist, and each calls for a different investment response.
- Demand-pull inflation: Prices rise because consumers and businesses are spending more than the economy can supply. Currently a secondary factor in Australia; the primary driver is supply disruption.
- Cost-push inflation (currently dominant): Prices rise because input costs, particularly energy, increase for producers who pass them on to consumers. This is the mechanism at work through the oil shock.
- Currency depreciation: A weaker Australian dollar makes imports more expensive. This is a contributing factor but not the primary driver.
The RBA targets inflation within a 2-3% band. Both the 4.6% headline and the 3.3% trimmed mean represent meaningful overshoots. The trimmed mean figure matters because it strips out the most volatile price movements; at 3.3%, it confirms inflation has broadened beyond energy alone.
The RBA cash rate stands at 4.10% as of 18 March 2026, with markets pricing a peak of approximately 4.7% by September 2026.
According to IMF research, each additional percentage point of inflation beyond 3% is associated with approximately 0.1-0.2% reduction in real GDP growth.
Moderate inflation encourages spending and supports business profitability. The current level sits above that productive range. Investors who understand which drivers are durable (cost-push from energy) versus potentially transitory (supply normalisation) are better equipped to judge whether their portfolio is defensive enough, or over-rotating into a risk that may not persist.
The disinflationary forces that could cap the rate cycle
The sustained-inflation thesis has counterarguments, and they deserve honest assessment rather than dismissal. Three disinflationary forces remain active globally, each with a different credibility profile against the current oil shock:
- AI productivity gains: Research from the St. Louis Fed (March 2026) and the Federal Reserve Bank of San Francisco examines AI’s potential to raise output and reduce costs. Deutsche Bank has assessed AI as a potentially disinflationary force over the medium term. Credibility: real but operating on a multi-year timescale that is unlikely to offset an acute energy price shock in 2026.
- Moderating wage growth: Wages growth in Australia has been easing, reducing the risk of a wage-price spiral where higher wages and higher prices reinforce each other. Credibility: meaningful for preventing inflation from becoming entrenched, but insufficient to counteract the direct energy cost channel.
- Chinese goods diversion: US tariffs are redirecting Chinese manufactured goods to other markets, including Australia, creating downward price pressure on goods categories. Credibility: a real mechanism, but not yet quantified by credible sources specifically against the current oil shock context.
The structural deflationary forces currently operating against the oil shock, including AI-driven productivity gains, frozen global housing markets applying indirect demand suppression, and discounted Chinese manufactured goods flowing to alternative buyers, are not uniformly distributed across CPI categories; goods inflation is more exposed to Chinese import competition than services inflation, which is why the trimmed mean remains stubbornly above the goods-only reading.
Why Chinese goods diversion matters for Australian prices
When US tariffs make American markets less accessible for Chinese manufacturers, those goods flow to alternative buyers. For Australia, this means lower prices on imported manufactured goods, from electronics to household products. The limitation is significant: this effect operates on goods inflation but does not offset the energy-driven component of CPI that is currently doing the heavy lifting.
The structural argument also bears noting. The low-inflation environment of the 2010s is unlikely to return in full, and 2% now looks more like a minimum threshold than a ceiling. This prevents over-indexing on disinflation. But supply shocks historically resolve through one of two paths: demand cooling (leading to rate cuts) or supply normalisation (leading to price falls). Both paths are eventually supportive for markets, which is why positioning for both directions is rational rather than indecisive.
Building an inflation-resilient portfolio for Australian investors in 2026
The analysis above leads to a concrete question: how should a portfolio be positioned when both sustained inflation and a faster-than-expected growth slowdown are plausible outcomes? The answer is scenario-balanced positioning across four strategic orientations, each with accessible ASX-listed instruments.
VanEck has noted the importance of explicitly positioning portfolios for conflict-related volatility, including geographic and sector diversification. AllianceBernstein points to defensive stocks with pricing power as a potential antidote to inflation shocks.
| ETF ticker | Asset class | Inflation scenario relevance | Rate-reversal scenario relevance | Key characteristic |
|---|---|---|---|---|
| VBND | Global investment-grade bonds | Income stream preserves purchasing power | Bond prices rise as rates fall | Currency-hedged to AUD, diversified issuers |
| CRED | Australian corporate bonds | Senior fixed-rate income from quality corporates | Positioned to benefit at rate peak | High-quality Australian issuers |
| VGS | International equities | Global diversification reduces single-economy risk | Growth recovery supports developed-market earnings | 1,000+ large companies excluding Australia |
| QUAL | Quality global equities | Pricing power preserves margins during inflation | Quality factor outperforms in recovery phases | High-quality companies with strong balance sheets |
| AAA | Cash equivalent | Capital preservation with income at elevated rates | Optionality to deploy into equities if rates reverse | AUD bank deposit accounts, consistent income |
ISEC offers a complementary option for investors seeking modestly higher yield than standard deposits through short-duration money market and corporate bonds, while maintaining low duration risk.
The scenario asymmetry is the key design principle. If inflation persists, the commodity exposure and pricing-power equities carry the portfolio. If rates reverse faster than expected, the bond allocations benefit from price appreciation and the cash holdings provide deployment capital. Neither outcome leaves the portfolio stranded.
Australian investors have access to well-structured, cost-efficient tools on the ASX that can tilt a portfolio toward inflation resilience without requiring a major structural overhaul or active stock selection. The framework above is illustrative, not prescriptive; individual circumstances, risk tolerance, and existing portfolio composition should guide specific allocation decisions.
Investors wanting to model specific allocation weights and understand why each of the six ETFs occupies a distinct role in an inflation-era portfolio will find our comprehensive walkthrough of ASX inflation ETF strategies, which covers dollar cost averaging mechanics, enhanced DCA during price dislocations, and the reasoning behind each instrument’s inflation-scenario and rate-reversal relevance with worked allocation examples.
Rate cycles end, portfolios endure: the discipline advantage
Supply shocks resolve. The mechanism varies (demand cooling, supply normalisation, or a combination), but the historical pattern is consistent: rate cycles driven by supply disruptions pull lower within approximately 6-12 months, and markets recover under both resolution paths.
Both supply shock resolution paths, whether through demand cooling or supply normalisation, ultimately support long-term investors who maintain disciplined positioning through the cycle.
The behavioural risk during an oil-shock-driven spike is reactive de-risking: selling equity positions at depressed valuations and locking in losses that the original shock would not have caused in a held portfolio. Sydney Financial Planning advises maintaining compound interest benefits and avoiding cycle-driven reactive decisions during exactly these periods.
Three specific behavioural disciplines help convert volatility from a threat into a structural advantage:
- Scheduled contribution automation: Set weekly, fortnightly, or monthly investment schedules that align with income cycles, removing the temptation to time entries around headlines.
- Enhanced dollar cost averaging during drawdowns: When markets experience significant declines, deploying above-normal contribution amounts purchases more units at lower prices, improving long-term cost basis.
- Portfolio review cadence: Review allocations quarterly rather than daily, reducing the frequency of emotionally driven decisions while maintaining strategic oversight.
Investment process discipline is one of the few controllable variables in a period of genuine macroeconomic uncertainty. Controlling it is itself a strategic edge.
The case is built, the window is open
The oil shock is real and material. 4.6% headline CPI, $116 Brent crude, and a 7.9 million bpd OPEC production drop are not figures that permit complacency. But the historical rate-cycle pattern favours earlier resolution than markets currently expect, and the portfolio tools to navigate both a sustained-inflation and a growth-slowdown outcome exist and are accessible on the ASX.
Three variables are worth monitoring in the months ahead: the Strait of Hormuz operational status, the RBA’s September 2026 rate decision (which could confirm or challenge the 4.7% peak expectation), and the trimmed mean CPI trajectory as the cleanest signal of whether inflation is broadening or contracting.
Certainty is not arriving. The investors who have built a considered, scenario-balanced position will be better placed than those who waited for clarity that a supply-driven oil shock is unlikely to provide.
This article is for informational purposes only and should not be considered financial advice. Investors should conduct their own research and consult with financial professionals before making investment decisions. Past performance does not guarantee future results. Financial projections are subject to market conditions and various risk factors.