Trump Signs Preliminary Iran Deal, Stocks Rally and Oil Falls
2 hrs ago

Major internet and software conglomerates are projected to spend over $650 billion on artificial intelligence infrastructure throughout 2026. This unprecedented capital outlay places extraordinary pressure on upcoming corporate updates, as investors demand evidence of immediate financial returns. As of late April 2026, the S&P 500 has experienced elevated daily ranges, seeking justification for these massive infrastructure investments after reaching a historic peak of 6,980.10 in early February.
The index concentration risk created by four megacap technology companies holding over 19% of the S&P 500 means that passive investments now function as highly concentrated thematic bets on these infrastructure outcomes.
Understanding the implied volatility of earnings reports provides an objective lens into these high-stakes market expectations. What follows is a detailed framework for decoding what derivatives markets are signalling about upcoming share price fluctuations. This guide moves from basic pricing theory to real-time market application, giving investors the tools to evaluate current technology valuations.
Derivatives pricing often appears as complex mathematics to outside observers. However, these markets function primarily as a simple crowd-sourced probability mechanism for future stock movements. Before a scheduled financial update, uncertainty naturally increases, prompting market participants to seek portfolio protection.
Institutional investors use the derivatives market as an insurance marketplace to hedge their equity positions. Premiums rise ahead of known catalytic events because the demand for this downside protection spikes dramatically. This elevated demand drives up the expected price swings priced into the short-term contracts.
It is fundamental to separate the concept of expected future swings from historical market fluctuations. Historical metrics measure what a stock has already done in previous quarters. The current pricing structure measures what market participants are willing to pay for protection against what might happen tomorrow.
A common mistake is confusing high options premiums with a guaranteed share price decline. Options pricing does not predict the direction of a post-disclosure move. The market only prices in the expected magnitude of the fluctuation, treating an upward surge and a downward collapse with equal mathematical weighting.
The CBOE methodology for expected percentage swings relies on straddle pricing to forecast these non-directional reactions, establishing a formal mathematical baseline for options valuation during corporate updates.
This educational foundation allows market participants to accurately interpret financial media headlines without emotional bias. To evaluate these expectations objectively, investors must understand how contracts are valued. The expected move relies on three core components:
Time to expiration: The number of days remaining until the contract matures, with nearer dates capturing the immediate event risk. Current share price: The baseline valuation from which all percentage moves are mathematically calculated. * Contract premium: The actual cost of the option, which inflates directly alongside market anxiety.
By mastering this relationship, investors can avoid panic when seeing elevated premiums. Instead, they can view these metrics as objective data points revealing institutional sentiment.
The current derivatives pricing environment is directly tied to the massive financial wagers defining the 2026 technology sector. Big Tech companies are collectively projected to spend over $650 billion on artificial intelligence infrastructure this year. This staggering scale of investment has created elevated anxiety among institutional shareholders who require immediate margin validation.
Amazon provides the clearest example of this spending trajectory as the second quarter approaches. The company is approaching $200 billion in capital expenditures for 2026 alone, heavily concentrated on its cloud infrastructure buildout. These massive outlays demand clear revenue justification to avoid mounting valuation pressures on the broader index.
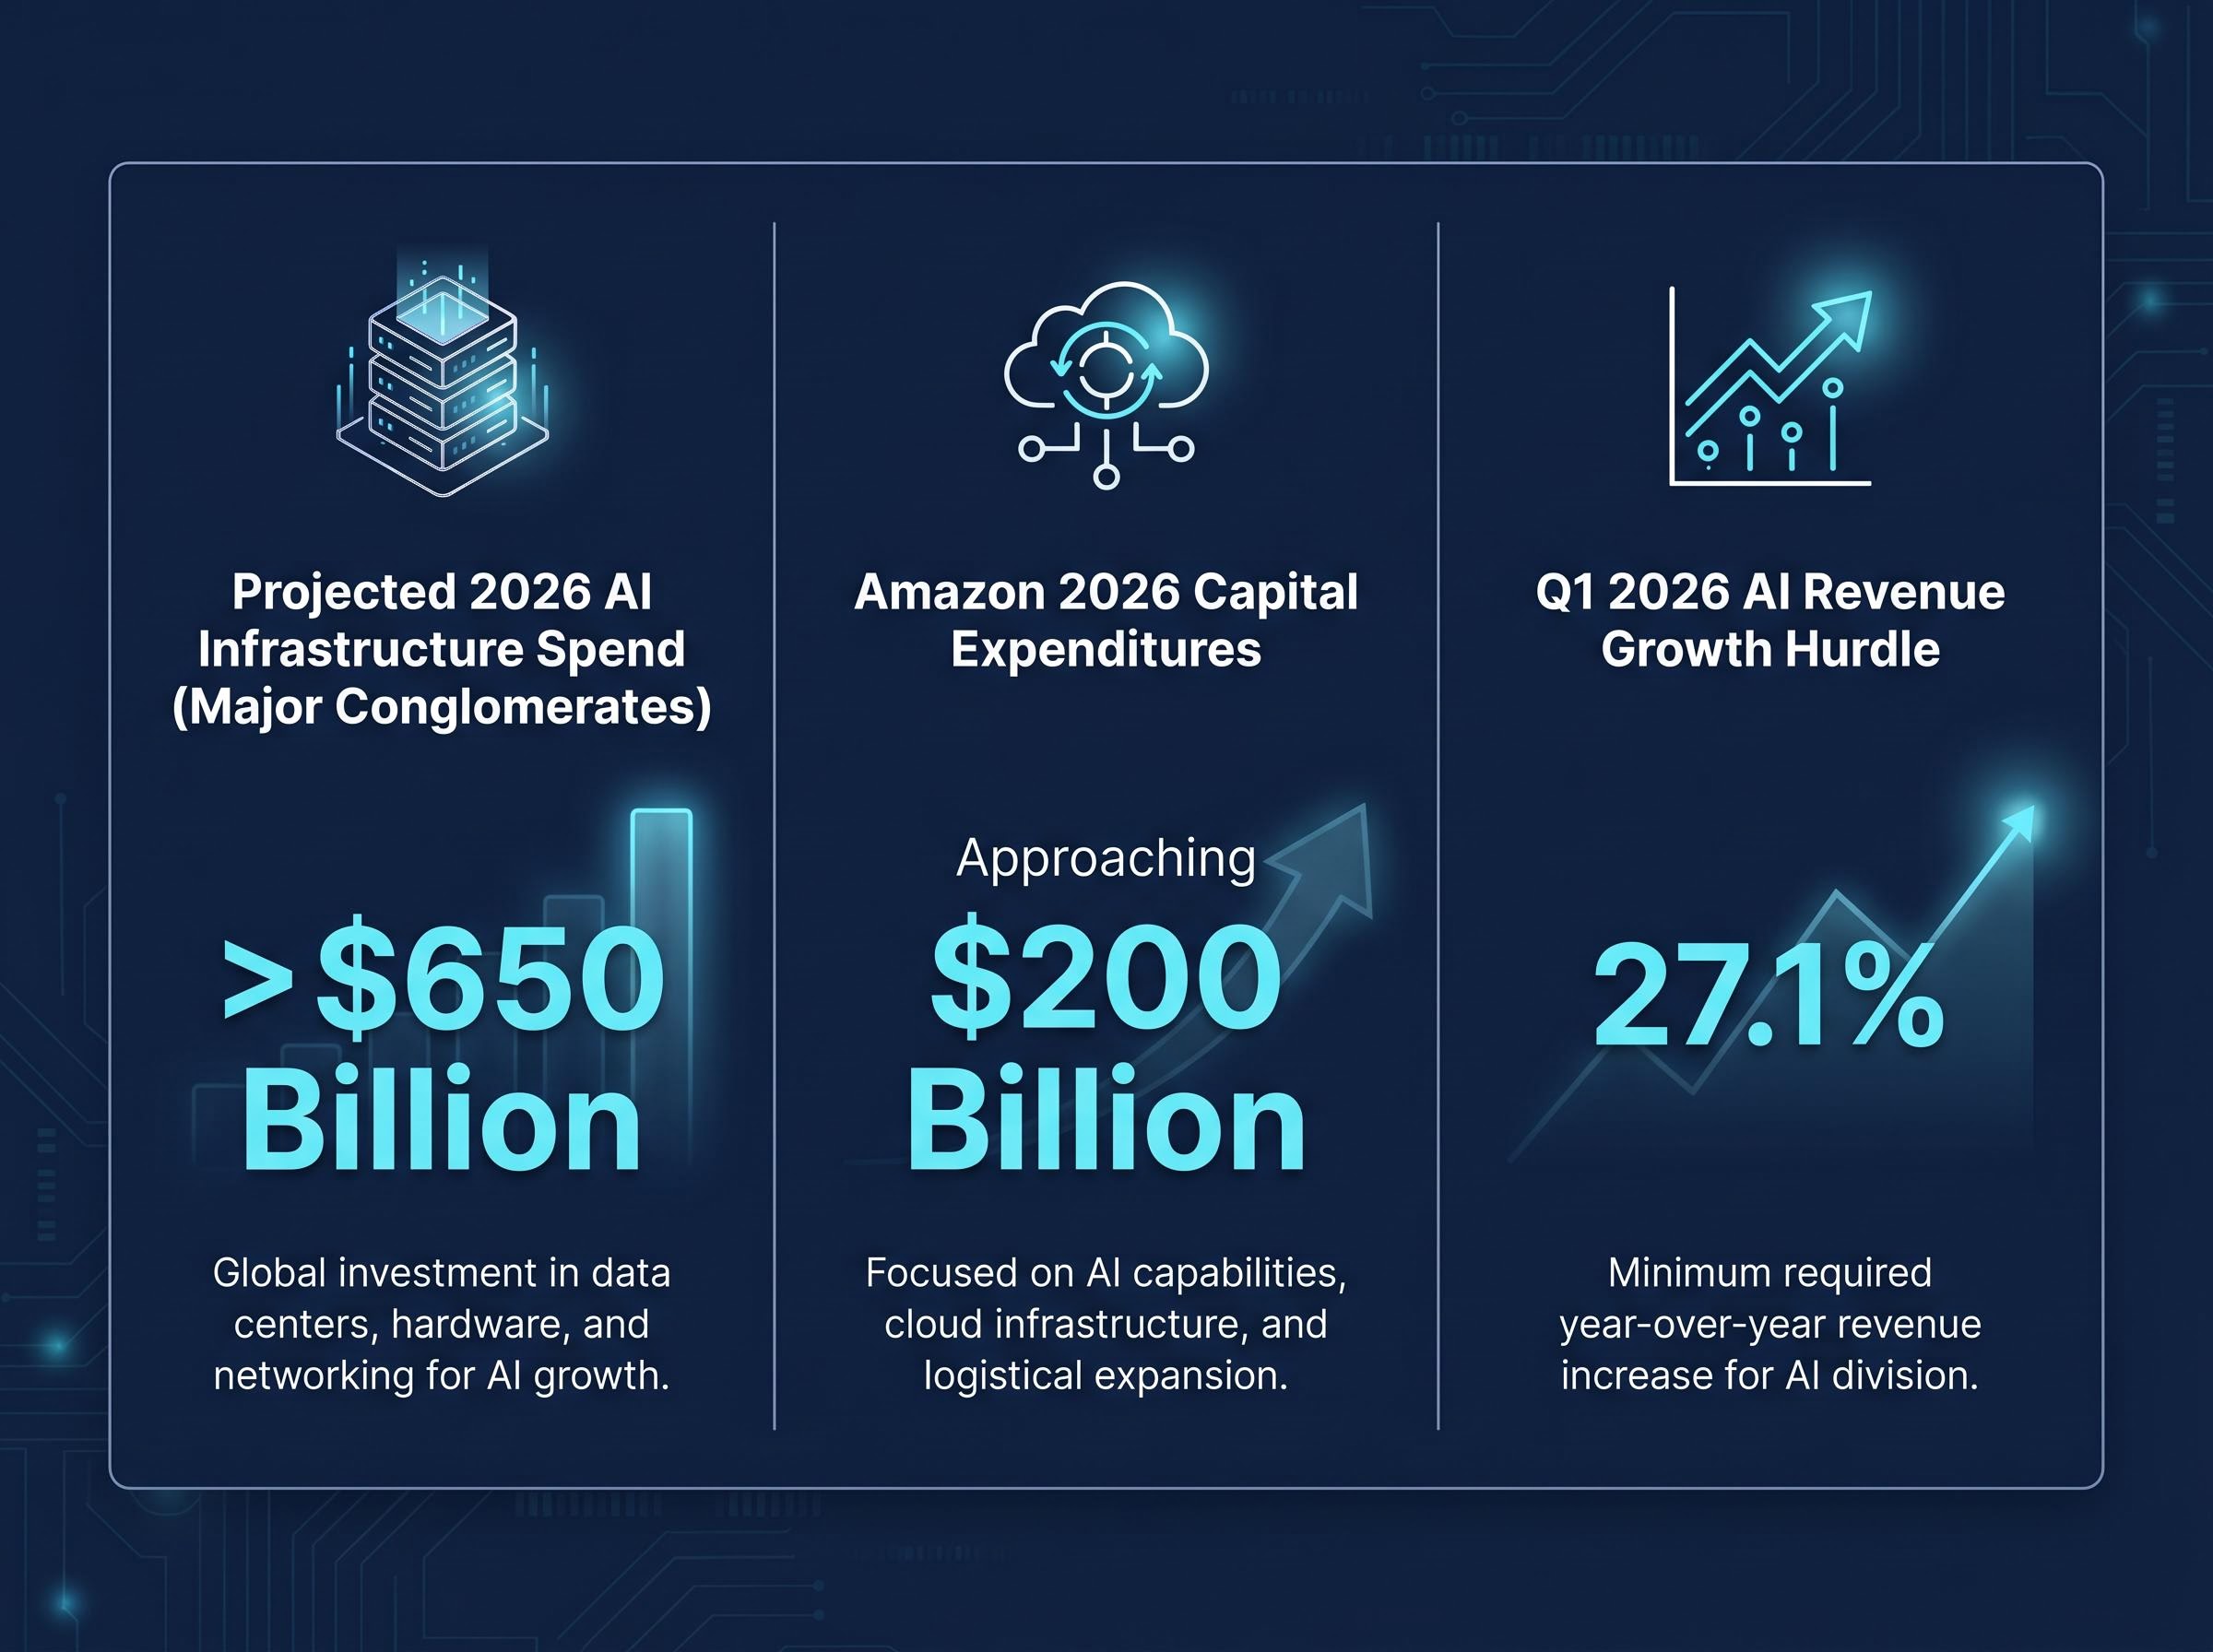
As a result, the current market environment features a widening guidance gap between technology components. Companies are beginning to separate based entirely on their ability to monetise these recent hardware investments. Analysts have placed a demanding 27.1% growth hurdle on artificial intelligence-driven revenue for the first quarter of 2026.
Early metrics in cloud services monetization, such as Amazon Web Services achieving a massive annualized artificial intelligence run rate in the first quarter, highlight the multi-year timeline required to translate initial infrastructure spending into sustainable revenue.
Contextualising these underlying financial drivers helps clarify why the derivatives market is currently pricing in such dramatic volatility. It bridges the gap between fundamental corporate analysis and short-term market sentiment.
Expert Commentary “Corporate leadership faces a narrowing one-year window to demonstrate tangible top-line sales figures from their infrastructure investments, and current options premiums reflect the market’s decreasing patience for purely theoretical growth narratives,” according to recent industry analysis.
These demanding growth hurdles mean that any perceived delay in profitability could trigger immediate institutional selling. Market participants are using options contracts to brace for these exact scenarios. The elevated premiums are a direct mathematical reflection of this widespread sector anxiety.
Market fear often outpaces mathematical reality during major reporting seasons. By comparing currently priced expectations against historical performance, investors gain analytical clarity. This practical comparative analysis reveals whether options are overpriced or underpriced relative to actual corporate history.
As of late April 2026, several technology giants face immediate scrutiny. Their derivatives pricing reflects the heightened sensitivity surrounding their upcoming disclosures. Alphabet shows an expected move of approximately 5.69% for contracts expiring on 1 May 2026.
The convergence of simultaneous earnings reports from Microsoft, Alphabet, Amazon, and Meta has created conditions for severe market movement, with derivatives currently pricing in valuation swings that could collectively exceed $750 billion.
In contrast, companies reporting later in the season are carrying even higher premiums. Nvidia is scheduled to release its quarterly update on 20 May 2026. The semiconductor leader’s options are tracking at 42.71% expected volatility, translating to a massive +/-8.08% anticipated price swing.
However, the dominant macro narrative does not always align with historical averages. Meta, reporting on 29 April 2026, has a priced expected move of +/-7.35%. This figure actually sits below its historical average over the previous 12 quarters, suggesting the market may be slightly underpricing its specific event risk relative to past behaviour.
Amazon exhibits a similarly elevated premium going into its late April update. The expected move for its immediate expirations is priced between +/-6.18% and +/-6.85%. This sits marginally higher than its historical average, reflecting the specific anxiety around its heavy infrastructure spending.
| Ticker | Scheduled Report Date | April/May 2026 Expected Move | Historical Average Move (12 Quarters) |
|---|---|---|---|
| Alphabet (GOOGL) | 29 April 2026 | +/-5.69% | Data Unavailable |
| Meta (META) | 29 April 2026 | +/-7.35% | Data Unavailable |
| Amazon (AMZN) | 29 April 2026 | +/-6.18% to +/-6.85% | Data Unavailable |
| Nvidia (NVDA) | 20 May 2026 | +/-8.08% | Data Unavailable |
Investors who track these specific baseline discrepancies can identify mispriced risk across the sector. When current derivatives pricing remains lower than historical averages despite a fearful macro narrative, it may signal a structural opportunity. Conversely, excessive premiums often set the stage for a collapse in option value regardless of the underlying stock direction.
Earnings volatility rarely remains confined to individual software companies. The massive capital expenditures from software giants translate directly into revenue for semiconductor manufacturers. This creates a clear ripple effect across the entire hardware ecosystem.
A single financial miss from a major cloud provider can trigger immediate valuation drops across processor equities. If a company like Microsoft or Amazon reduces forward infrastructure guidance, the market instantly discounts the future cash flows of chip designers and fabricators.
This interconnected relationship explains the extreme sensitivity in semiconductor equities throughout early 2026. Understanding this sector contagion allows investors to anticipate secondary market reactions. It provides opportunities to hedge exposure or capitalise on sympathy movements in related hardware stocks.
Institutional investors rarely hedge this contagion risk through individual stock options alone. Instead, they utilise benchmark indices like the PHLX Semiconductor Index (SOX) to manage broad ecosystem exposure. The performance of this benchmark serves as a real-time barometer for hardware sentiment.
The SOX demonstrated this heightened sensitivity in late April 2026. On 28 April 2026, the index closed at 10,035.58, marking a sharp 3.58% daily decline. This daily fluctuation occurred against a backdrop of massive historical gains, with the benchmark having recorded trailing twelve-month growth.
When software providers prepare to update the market, the SOX often experiences amplified swings. The elevated premiums on these benchmark index options reflect the collective anxiety of the entire artificial intelligence supply chain.
Investors exploring the broader beneficiaries of this data center expansion will find our comprehensive walkthrough of the AI capital expenditure disconnect, which details how physical infrastructure and alternative energy providers are capturing immediate value while software creators face ongoing monetization delays.
The transition from passive observer to active interpreter requires a repeatable strategy. Investors need a clear analytical progression for evaluating any stock heading into a major quarterly update. This actionable framework transforms abstract theory and current market data into practical portfolio defence.
One of the most important concepts to grasp is the phenomenon of volatility crush. Once a company releases its information, the uncertainty vanishes, causing options premiums to collapse immediately. This rapid deflation explains why buyers of options often lose money even when they correctly predict the stock’s direction.
The FINRA guidance on implied volatility confirms that event-driven premiums naturally deflate as expiration approaches, illustrating the underlying mechanics of this rapid post-earnings pricing collapse.
To manage this dynamic, investors should incorporate the 12-quarter historical average metric into their personal risk assessment. Comparing the currently priced move against the average post-disclosure fluctuations across a three-year period provides a grounding reality check.
Before allocating capital around a major financial release, investors should follow a systematic evaluation process.
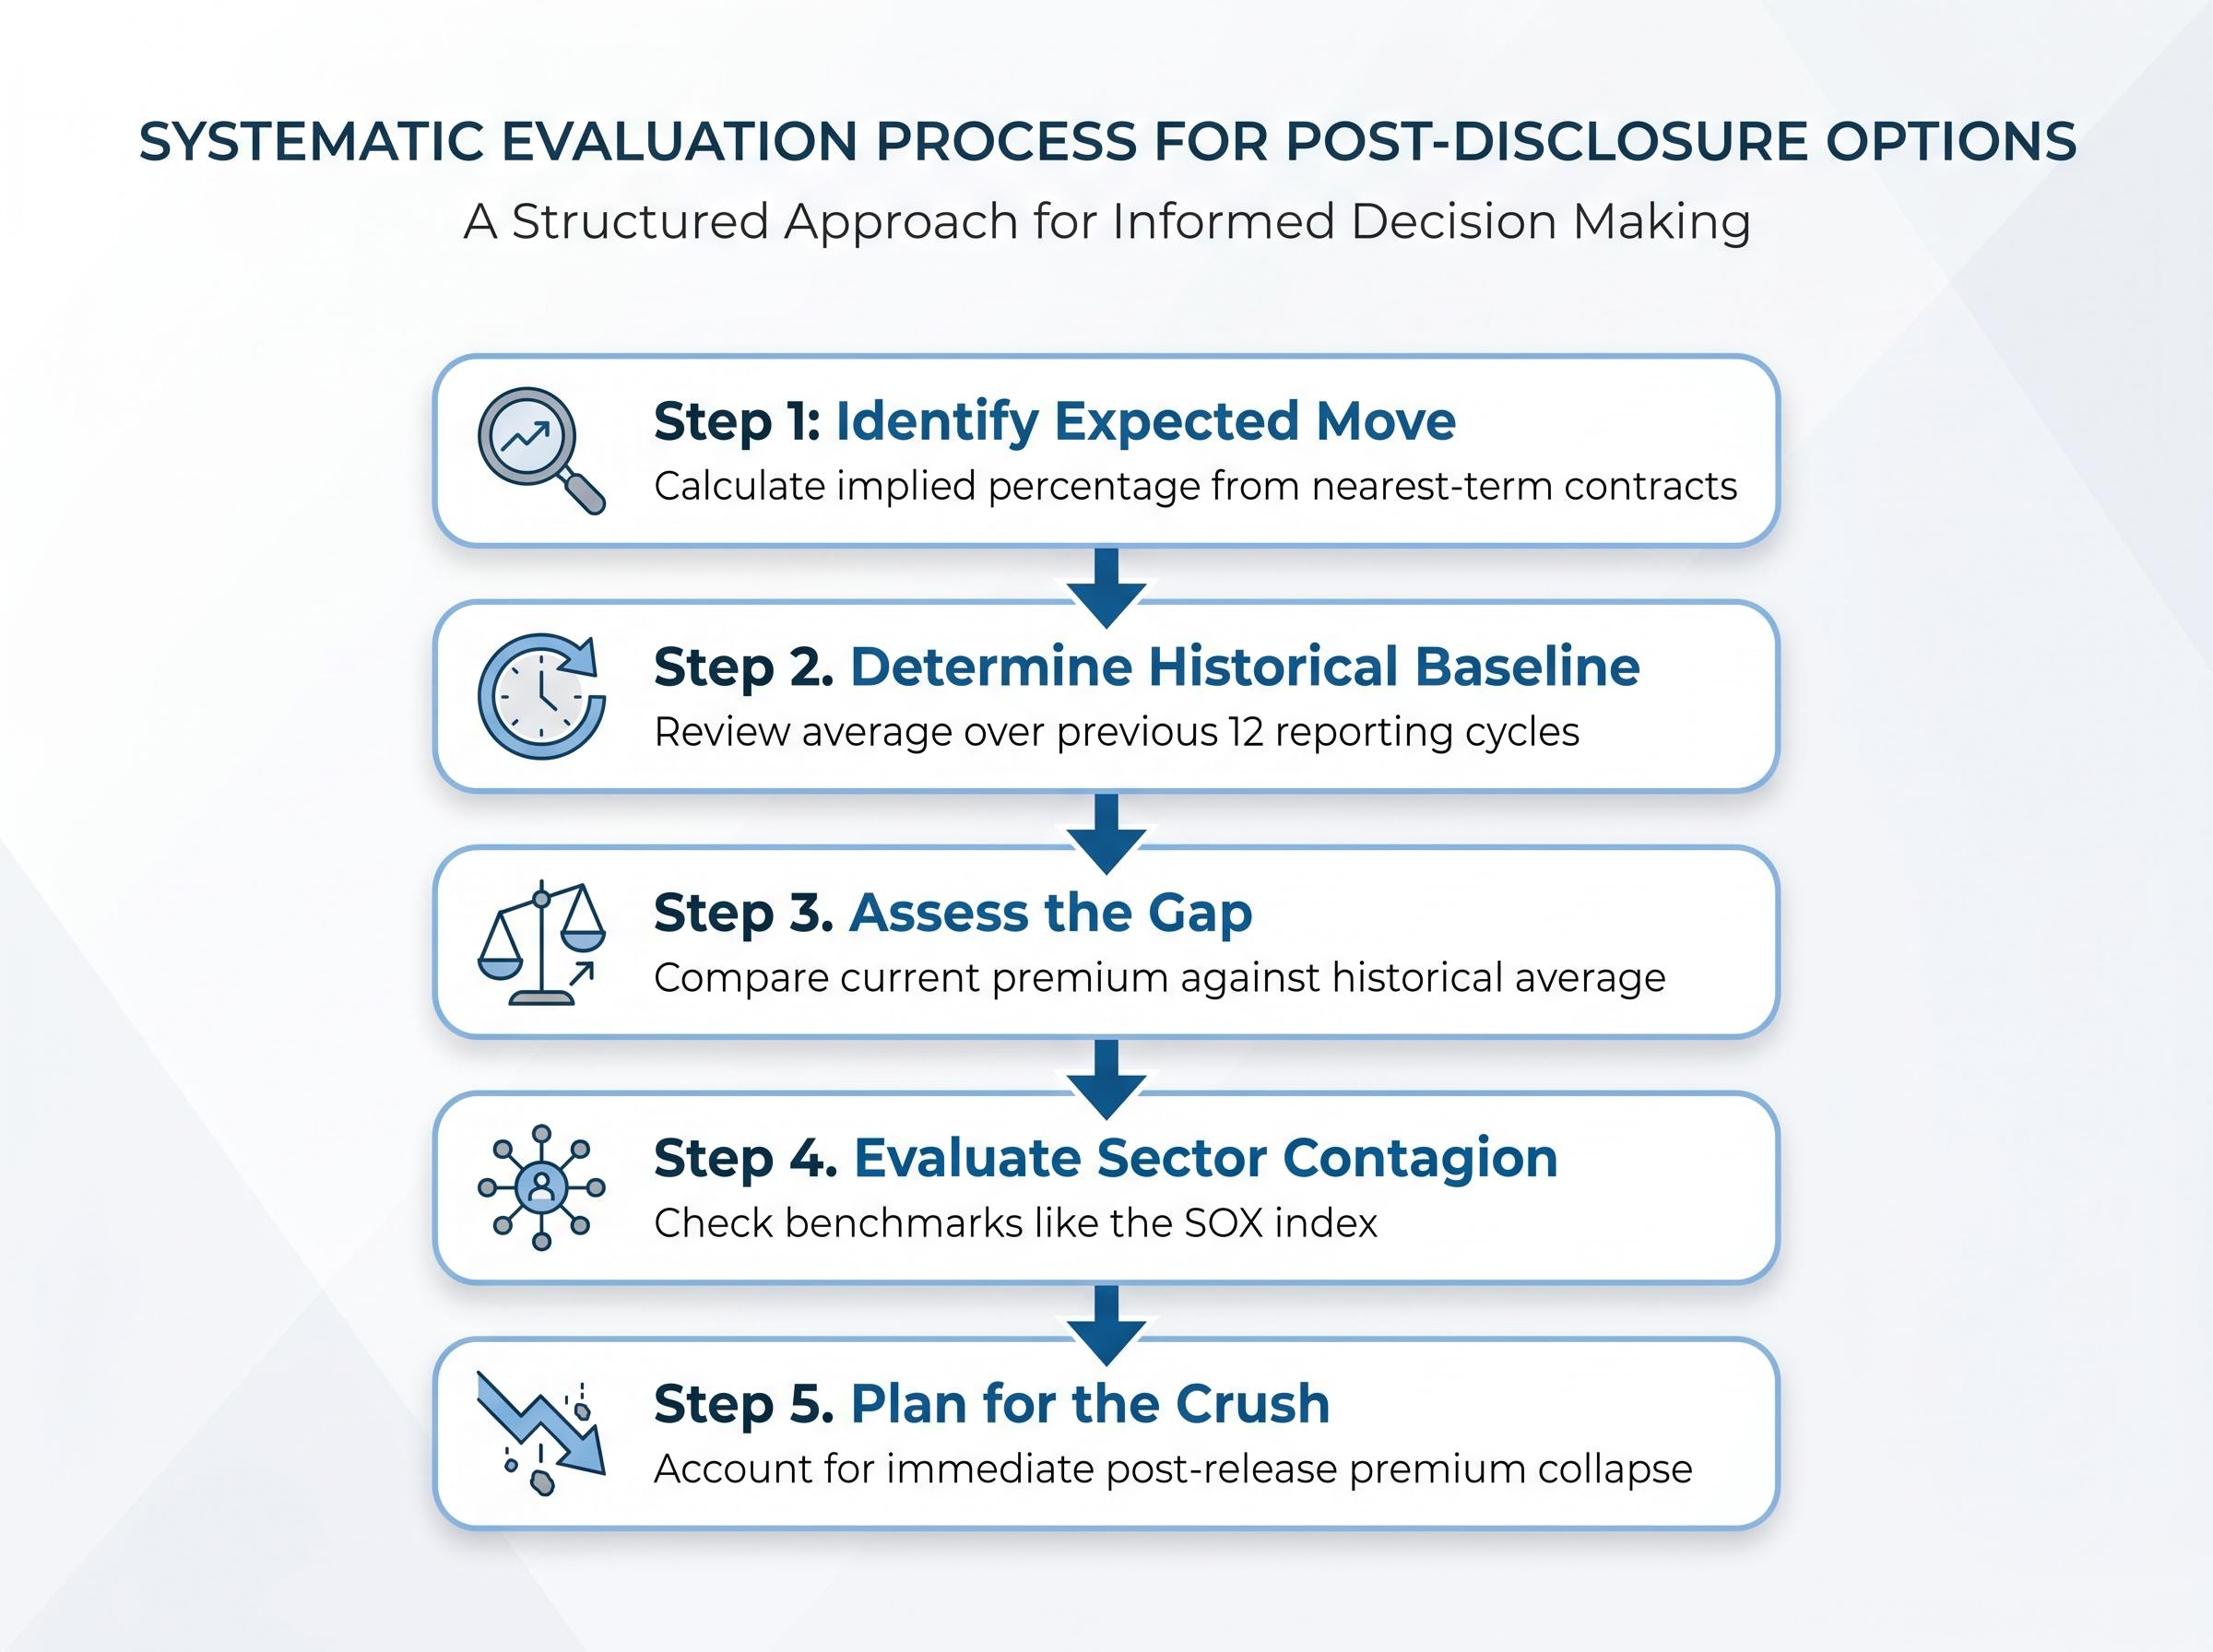
This structured approach filters out the noise of financial media anxiety. It relies on objective mathematics rather than emotional sentiment to guide portfolio decisions.
Derivatives markets offer a transparent window into institutional expectations, particularly during periods of historic infrastructure spending. The multi-billion dollar capital allocations defining 2026 have created an environment of heightened sensitivity across the technology sector. However, market participants do not need to operate blindly.
Comparing current expected moves against historical averages remains the most reliable method for cutting through financial media anxiety. This mathematical baseline provides an objective anchor when premium costs surge ahead of major disclosures. Investors should monitor actual post-earnings price action against initial derivatives pricing to refine their market intuition.
This article is for informational purposes only and should not be considered financial advice. Investors should conduct their own research and consult with financial professionals before making investment decisions. Past performance does not guarantee future results. Financial projections are subject to market conditions and various risk factors. These statements are speculative and subject to change based on market developments and company performance.
Implied volatility earnings refers to the expected magnitude of a stock's price movement priced into its options contracts ahead of an earnings report, reflecting market anxiety rather than direction. This metric helps investors gauge anticipated share price swings.
Investors use options pricing to decode market expectations for post-disclosure stock movements by analyzing contract premiums, time to expiration, and current share price, allowing for objective assessment of institutional sentiment. They can compare current premiums against historical averages to identify discrepancies.
Implied volatility premiums are elevated due to the unprecedented $650 billion in AI infrastructure spending by Big Tech companies, which has created heightened institutional pressure for immediate margin validation and clear revenue justification. Market participants are bracing for potential significant share price reactions.
"Volatility crush" is the rapid collapse of options premiums immediately after a company releases its earnings, as the uncertainty driving event-specific demand vanishes. This phenomenon means options buyers often lose money post-earnings, even if their directional prediction was correct.
AI spending by Big Tech directly translates to revenue for semiconductor manufacturers, creating a "volatility contagion." A financial miss or reduced guidance from a major cloud provider can trigger immediate valuation drops across related chip designer and fabricator equities.