On 29 April 2026, one of Wall Street’s premier electronic trading firms delivered a first-quarter performance that shattered consensus estimates by 48 percent on the bottom line. Fuelled by a surge in global volatility and macroeconomic catalysts that pushed oil prices above $100 per barrel, Virtu Financial capitalised on elevated transaction volumes across multiple asset classes. The resulting performance generated the firm’s highest profitability metrics since early 2021, capturing the attention of institutional analysts and retail participants alike. Analysing the Virtu Financial earnings report reveals the structural mechanics behind a $1.1 billion revenue quarter. The gap between the geopolitical shock’s severity and the market’s response highlights how algorithmic market makers capture value during periods of systemic friction. What follows provides finance students and retail investors with a comprehensive framework for evaluating electronic trading outperformance, understanding market liquidity provision, and calculating forward-looking equity valuations in a high-interest-rate environment.
Deconstructing a Historic Top-Line Beat
The raw quantitative scale of the first-quarter beat establishes this performance not simply as a quarterly win, but as a historic operational anomaly. Market makers thrive on market friction, and the specific macroeconomic conditions of early 2026 provided an ideal environment for algorithmic outperformance. Analysts had priced in elevated trading volumes, yet the firm’s execution engines captured margins well beyond baseline projections.
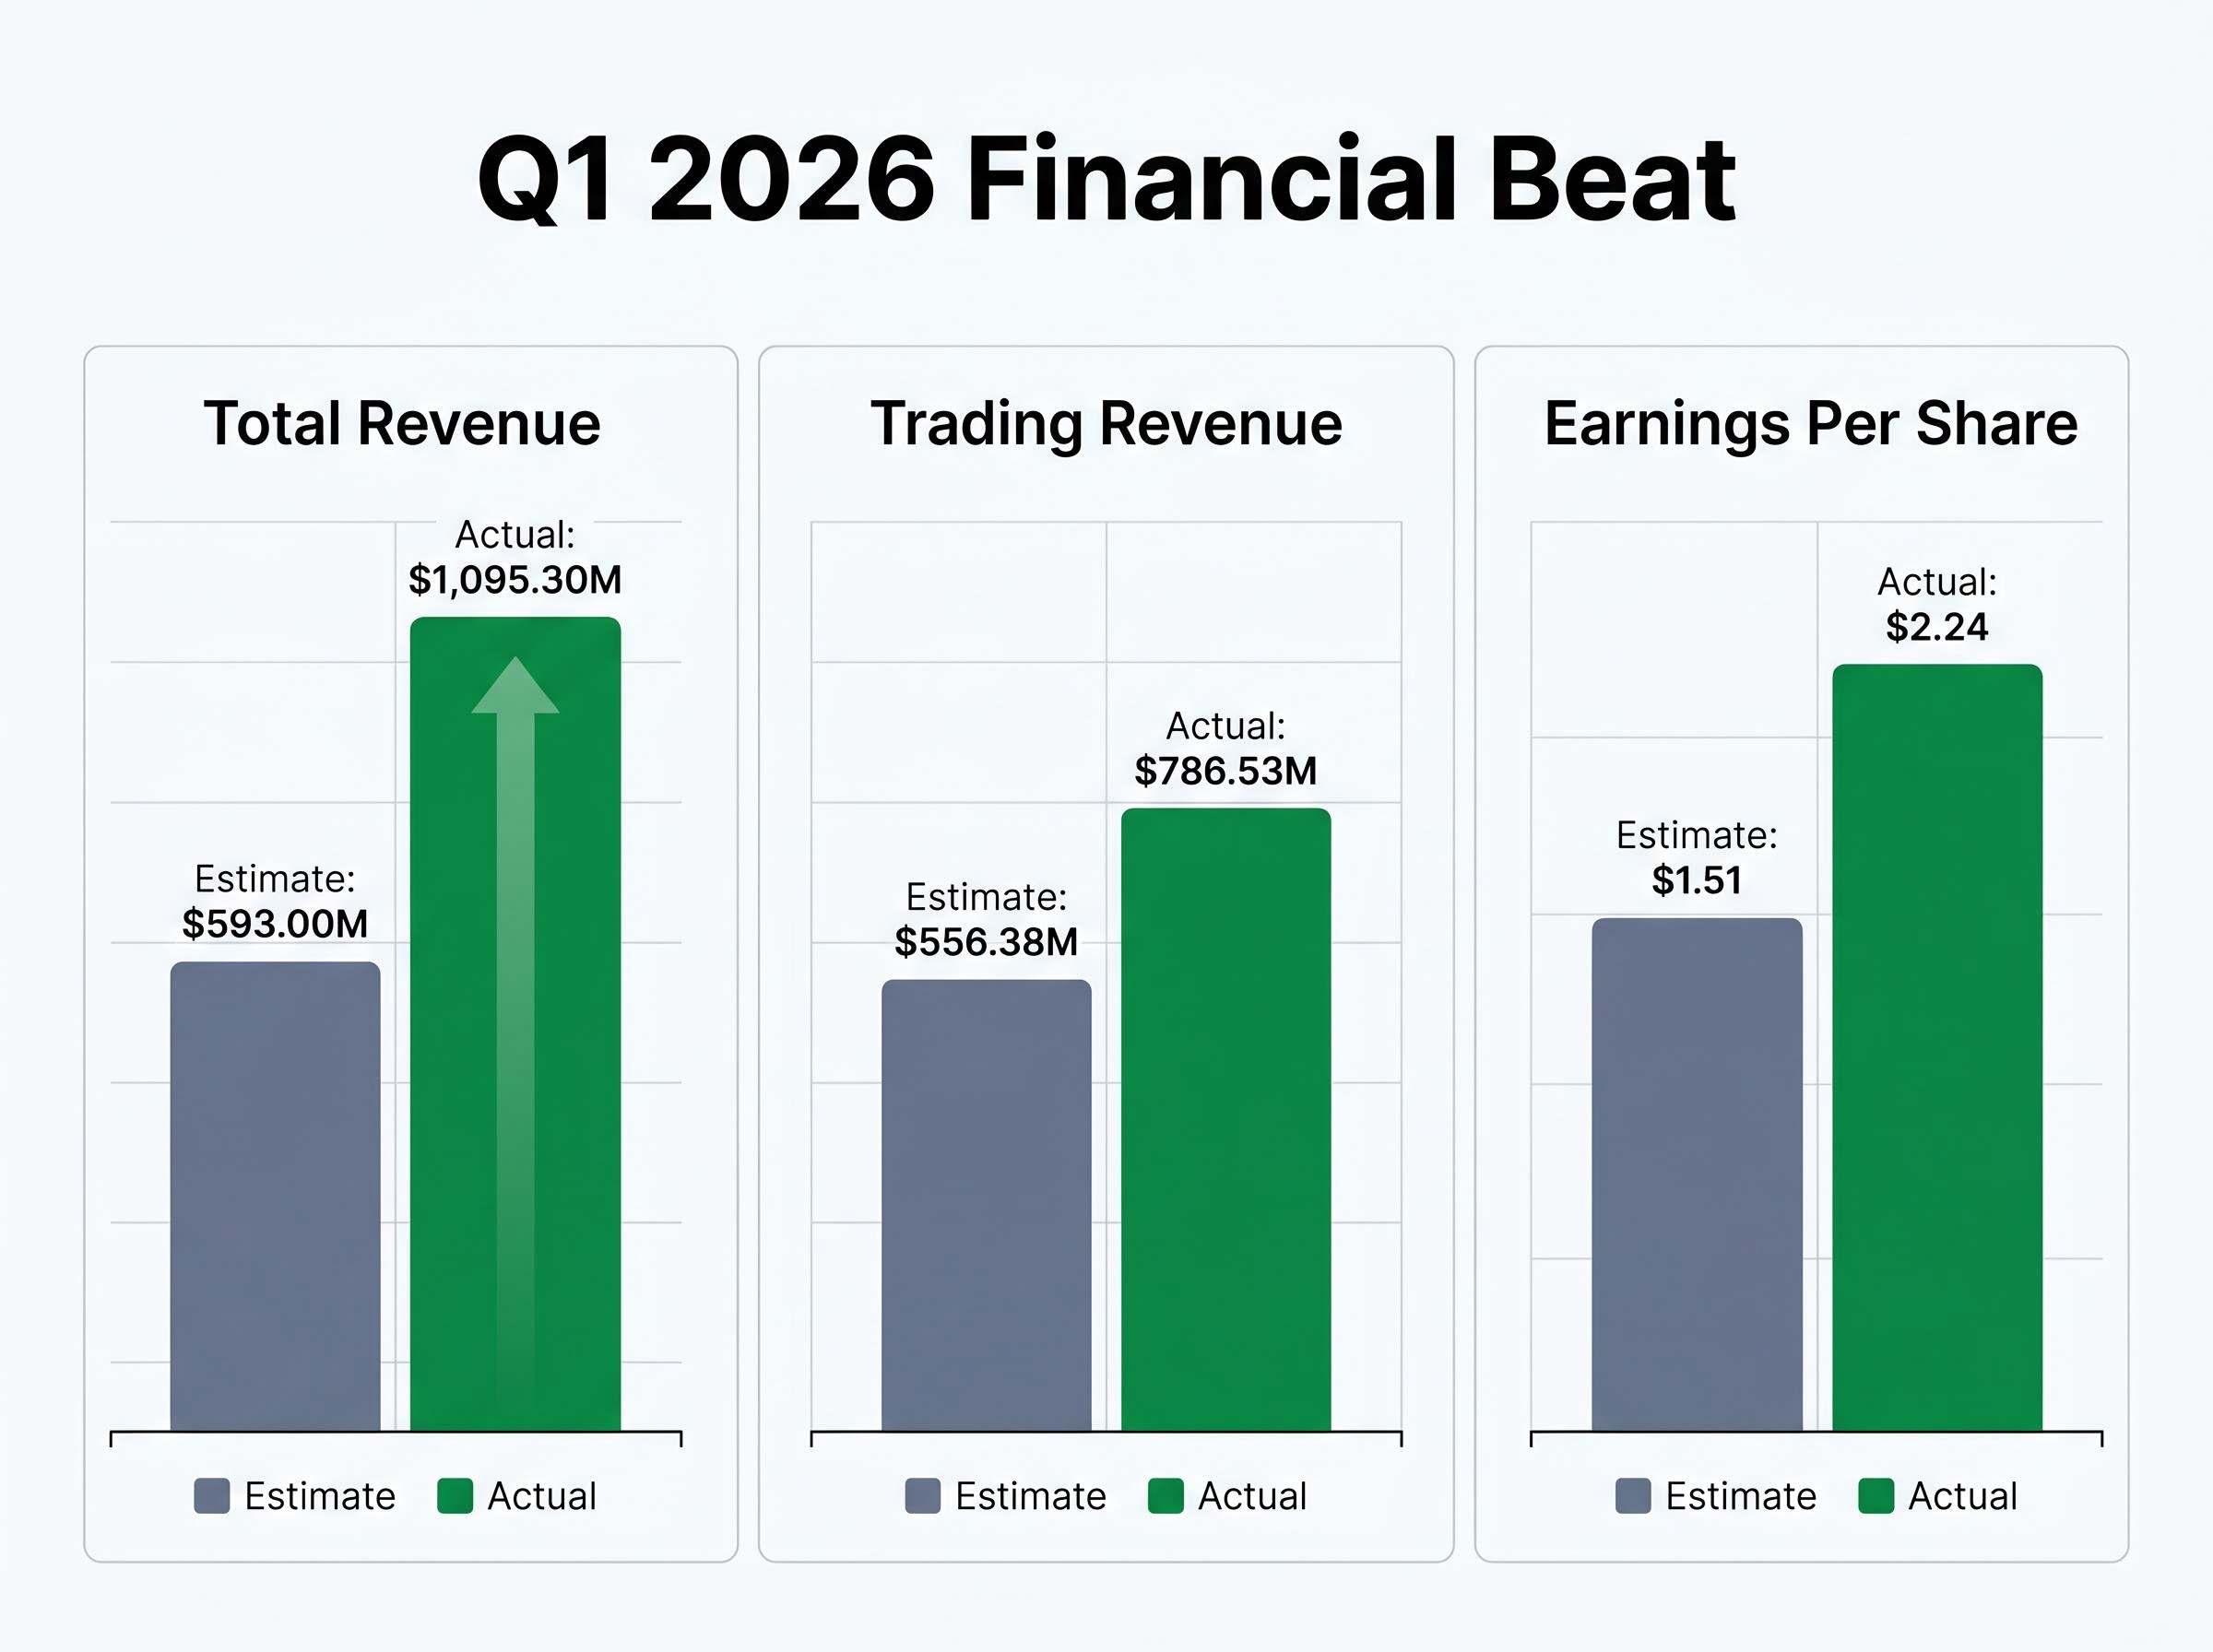
Total revenue reached $1,095.3 million, eclipsing the Wall Street consensus estimate. The core driver of this top-line income was the trading revenue segment, which delivered $786.53 million against projections of $556.38 million. This exceptional top-line generation translated directly to the bottom line, with per-share earnings significantly outperforming analyst expectations.
The company’s official first-quarter financial disclosures confirm this record-breaking trajectory, detailing how normalized adjusted earnings reached $2.24 per share alongside robust adjusted EBITDA metrics.
| Metric | Wall Street Estimate | Reported Actual |
|---|---|---|
| Earnings Per Share (EPS) | $1.51 | $2.24 |
| Total Revenue | $593.00 million | $1,095.30 million |
| Trading Revenue | $556.38 million | $786.53 million |
Beyond the gross revenue figures, the firm demonstrated exceptional operational efficiency throughout the period. According to company data, adjusted EBITDA reached $521 million, translating to a massive 66 percent profitability margin. For retail investors evaluating the stock’s subsequent market reaction, this margin underscores how fixed-cost technology platforms scale profitably when transaction volumes spike. The infrastructure costs remain relatively static, allowing the surge in trading revenue to flow directly to the bottom line.
When big ASX news breaks, our subscribers know first
The Mechanics of Market Liquidity Provision
Understanding how these billion-dollar figures materialise requires looking past the headline revenue and examining the daily mechanics of electronic trading. Algorithmic market making does not rely on directional bets regarding market movements. Instead, firms capture the fractional spread between bid and ask prices across millions of daily transactions, profiting from volume rather than asset appreciation.
The company operates through two distinct but complementary divisions that translate market friction into consistent capital generation.
Liquidity Provision: This core division acts as a designated market maker across global exchanges. The algorithms continuously quote buy and sell prices to facilitate smooth trading across equities, fixed income, currencies, and commodities. According to company data, during the first quarter, this unit yielded $10.4 million in daily net trading revenue, functioning as the primary engine for the broader earnings beat. Client Execution Services: This segment provides agency execution and workflow technology to institutional clients, helping them navigate fragmented markets efficiently. According to company data, this division generated $2.5 million daily during the quarter, marking eight sequential quarters of expanding total net trading revenues for the execution division.
This structural breakdown clarifies a highly complex corner of quantitative finance. It demonstrates that algorithmic trading profits stem from operational scale, technological speed, and transaction volume. By acting as the counterparty to buyers and sellers, the firm absorbs short-term supply imbalances and provides the necessary liquidity for global markets to function smoothly during periods of stress.
Foundational academic research on high-frequency trading highlights how these algorithmic liquidity providers act as shock absorbers during systemic stress events, profiting directly from the widening bid-ask spreads that accompany market panic.
Geopolitics, Oil, and the Volatility Engine
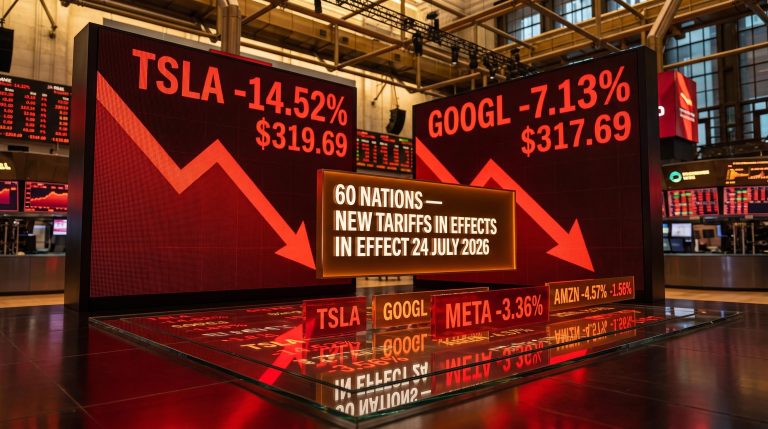
Internal algorithmic mechanics require external catalysts to generate outsized returns. The macroeconomic environment of early 2026 provided the exact volatility engine required to feed the firm’s trading infrastructure. Geopolitical tension and energy sector instability created ideal conditions for high-frequency trading systems to capture elevated spreads.
As geopolitical events drove oil prices above $100 per barrel, cross-asset volatility spiked. This uncertainty widened bid-ask spreads and increased the number of transactions required by institutional participants rebalancing their portfolios. To capture these opportunities, the firm deployed over half a billion dollars in fresh trading funds into the market. According to company data, this aggressive capital deployment resulted in average capital returns over the preceding twelve months standing at an exceptional 107 percent.
This energy surge acts as a formidable stock market warning signal for most equities; however, market makers inherently benefit from the exact tail risks that threaten traditional portfolios.
Despite this massive influx of revenue and rapid capital deployment, management maintained that the firm had not altered its fundamental operational parameters to chase yield.
Executive Commentary on Risk Parameters “The risk profile of the firm has not changed materially. We run highly automated electronic market-making strategies backed by statistical research. That is capacity limited at the scale we are talking about.”
Investors tracking this sector must monitor global news cycles closely. Geopolitical friction directly correlates with the volatility required for electronic market makers to exceed baseline earnings projections.
The Pragmatic Approach to AI and Talent Acquisition
While broader Wall Street narratives focus heavily on automated code generation and artificial intelligence trading systems, this firm maintains a strictly defensive posture. The enterprise prioritises structural integrity over experimental technology trends, refusing to hand core trading architecture over to generative models.
Management appears highly cognizant of the broader AI disruption in software markets, actively choosing to insulate its proprietary statistical frameworks from the vulnerabilities of unproven generative models.
Protecting the Trading Architecture
For the past thirty years, statistical modelling and probability theory have served as the foundation of algorithmic trading. The firm places strict technical boundaries around artificial intelligence integration to protect this legacy infrastructure. Rather than deploying artificial intelligence as a foundational trading algorithm to make autonomous financial decisions, management utilises it strictly as a developer productivity tool.
During the earnings presentation, executives noted that while artificial intelligence can execute code generation at beyond human speed, it remains a supplementary tool. They believe pairing high-quality engineers with these systems creates a safer operational environment. Leadership expects a timeline of one to two years before these tools have a material productivity impact on their software developers.
To support this human-led, technology-assisted strategy, the company maintains an aggressive talent acquisition pipeline aimed at quants, data scientists, and engineers. According to company data, monetary compensation expenses represented 22 percent of total revenues during the quarter, highlighting the intense competition for quantitative talent across the financial sector. The firm is actively targeting an expansion of its employee base by the end of the current fiscal cycle. This highlights the firm’s risk mitigation strategy, reassuring investors that the enterprise values proven mathematical frameworks over unchecked technological experimentation.
Pricing the Future with a 9.5 Multiple
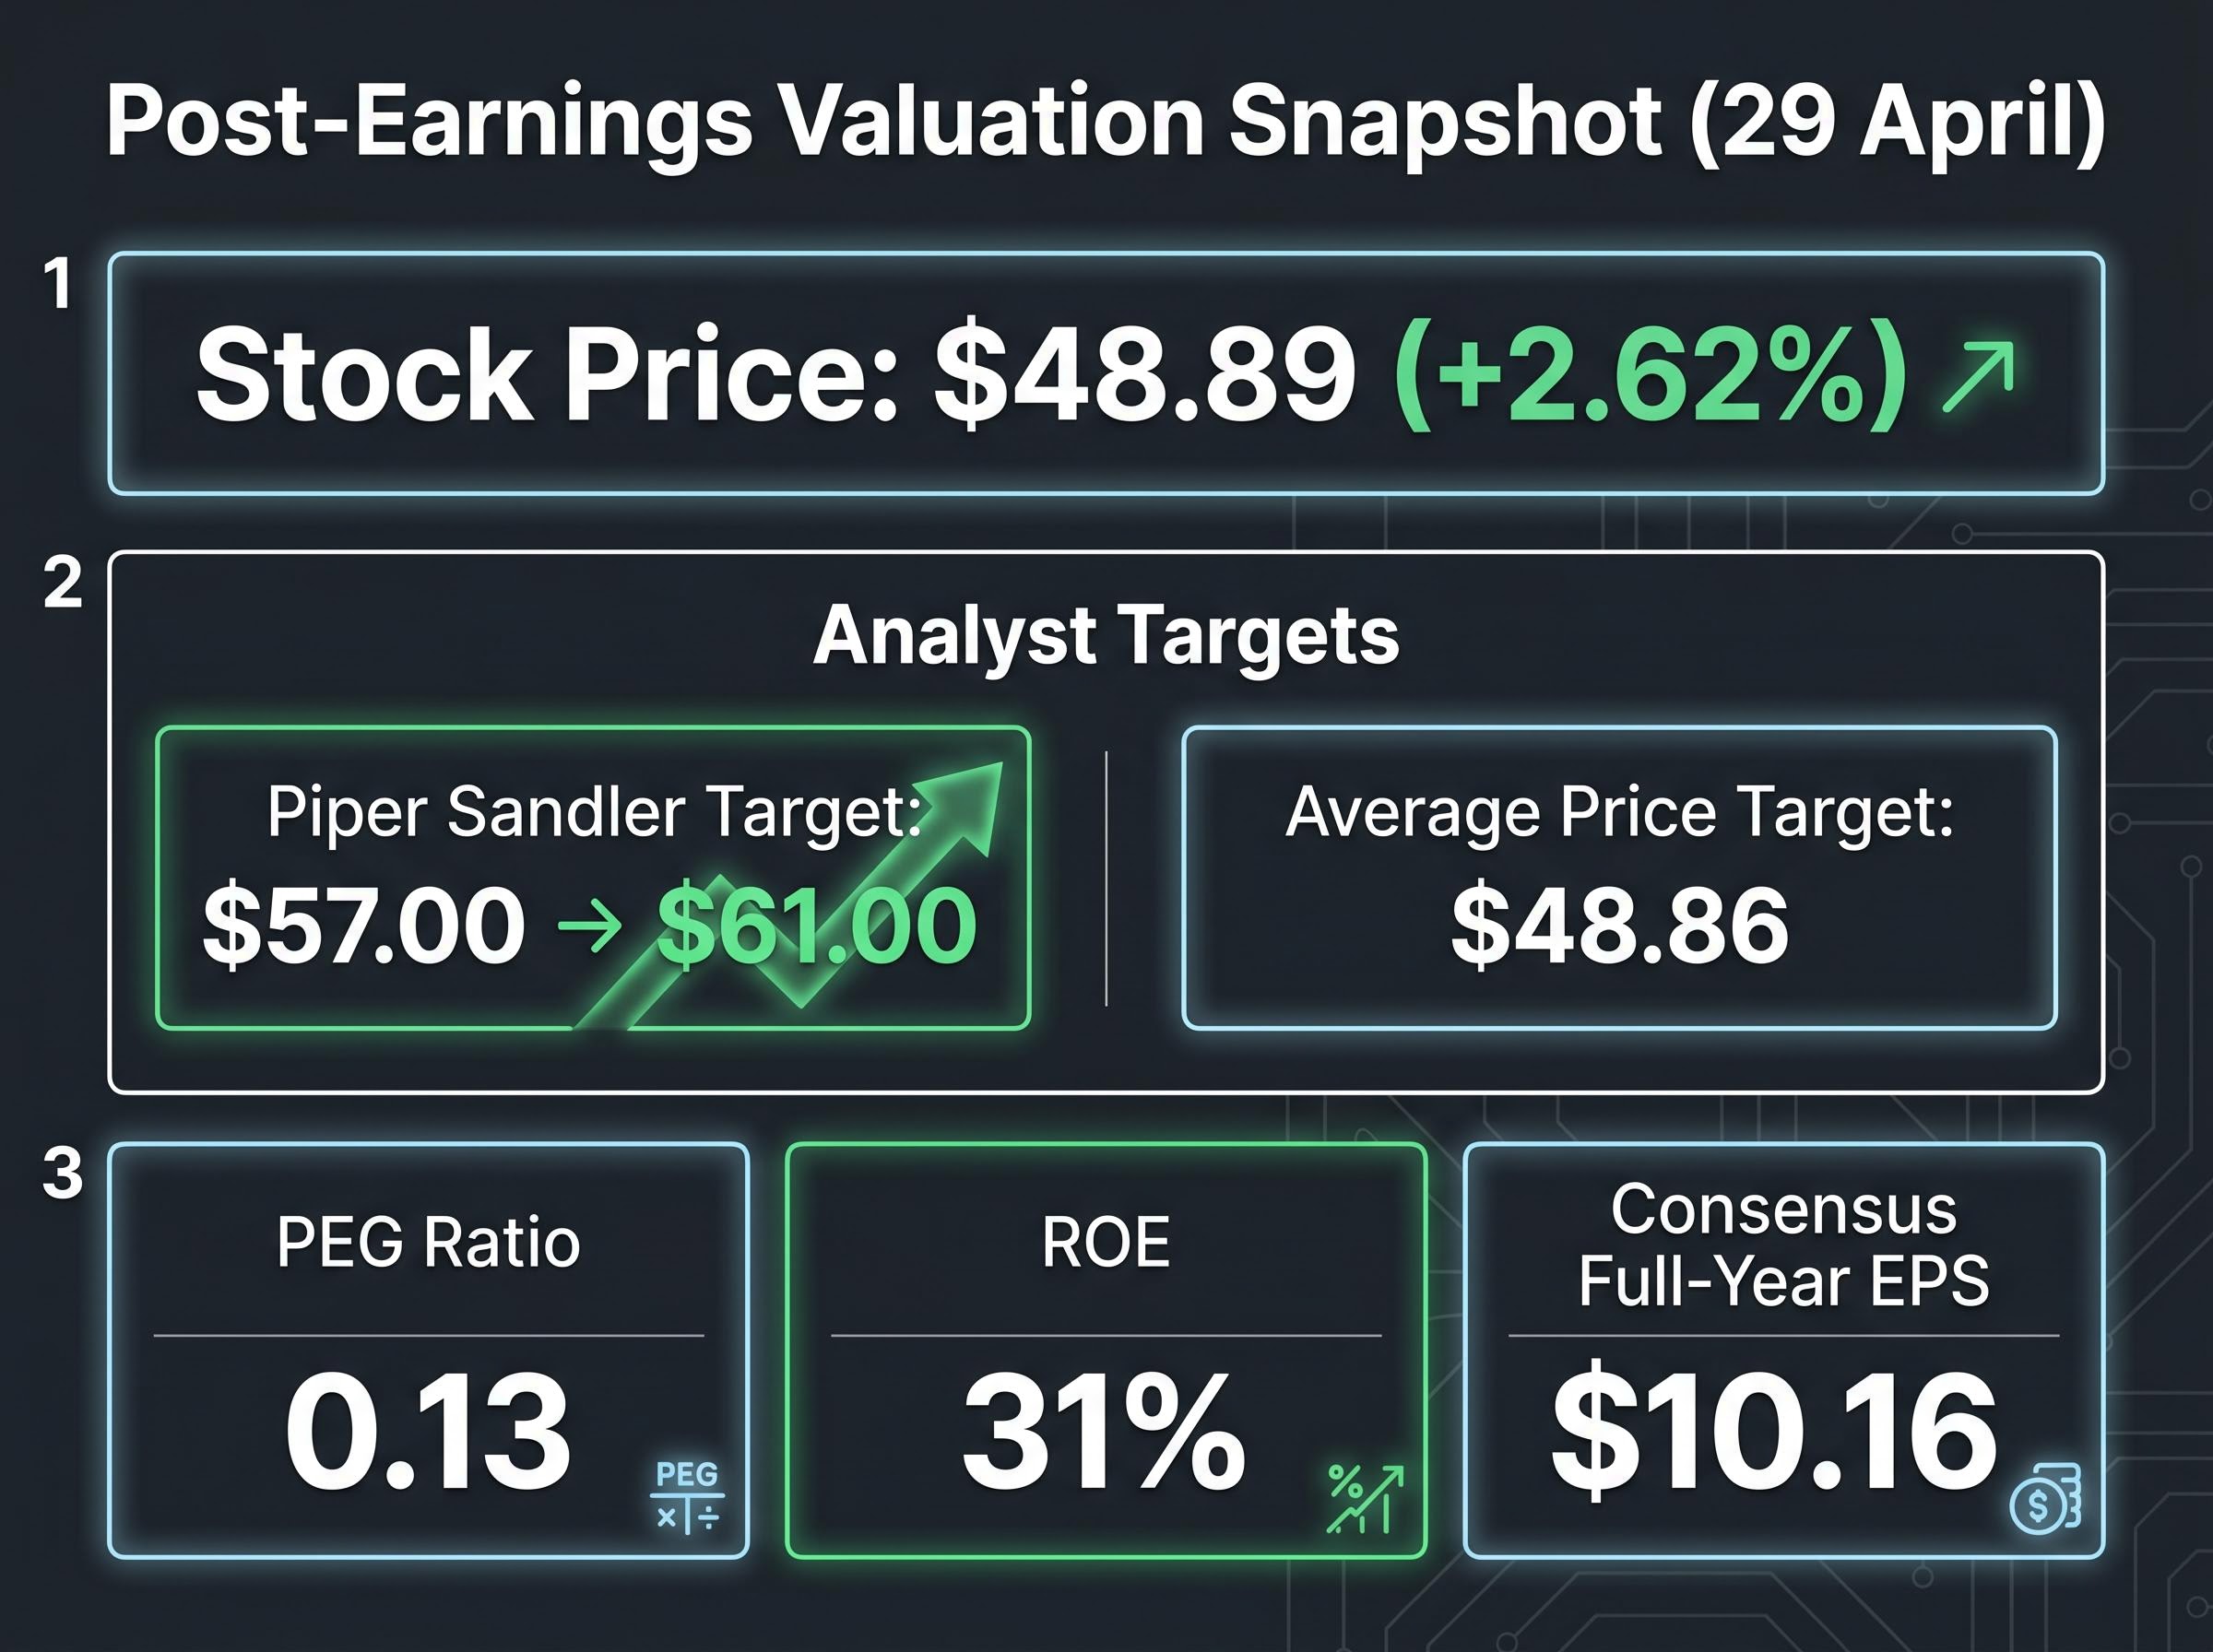
Translating historical earnings and operational mechanics into a forward-looking valuation requires weighing current pricing against the sustainability of peak market volatility. The immediate stock market reaction to the 29 April earnings release reflected an acknowledgement of the beat, paired with caution about future quarters. The stock price reached $48.89, up 2.62 percent for the day and nearing its 52-week high.
Those navigating earnings season dynamics recognise that implied volatility often collapses immediately following these announcements, compressing options premiums regardless of the underlying equity’s directional strength.
Wall Street analysts responded by revising their outlooks upward to account for the elevated cash generation. Piper Sandler upgraded its price target from $57.00 to $61.00, maintaining an overweight rating on the equity. Across brokerages, the current average price target stands at $48.86. To evaluate if the stock remains underpriced relative to its peer group, investors must examine the core valuation metrics.
- Price-to-Earnings (P/E) Ratio: The stock trades at a highly compressed multiple. This low multiple suggests the market expects earnings to normalise as geopolitical volatility subsides.
- PEG Ratio: Sitting at 0.13, this metric indicates substantial undervaluation when factoring in recent growth rates, assuming those rates can be maintained.
- Return on Equity (ROE): The firm maintains a highly efficient ROE of 31 percent, demonstrating strong capital allocation and cash generation capabilities.
- Consensus Earnings: According to market data, the full-year consensus per-share earnings estimate currently stands at $10.16.
Past performance does not guarantee future results. Financial projections are subject to changing market conditions and various risk factors. This discounted multiple reflects the market’s standard approach to cyclical financial stocks. Investors are pricing in the probability that the exceptional volatility of early 2026 will eventually compress, bringing trading revenues back toward historical baselines.
Sustaining the Momentum in a Shifting Market
The first-quarter performance demonstrates the compounding power of fixed-cost operational scale meeting extreme market volatility. By capturing the widening spreads driven by global friction, the firm successfully converted a macroeconomic shock into exceptional shareholder value without altering its baseline risk parameters. Looking ahead through the remainder of the 2026 fiscal cycle, the firm’s conservative adoption of artificial intelligence and aggressive human capital expansion position it defensively against structural market shifts. The current valuation multiple suggests the market remains sceptical about the durability of these elevated trading volumes, creating a specific pricing dynamic for those evaluating the sector.
Investors exploring how macroeconomic headwinds are reshaping portfolio construction will find our deep dive into the geopolitical energy shock’s market impact, which details the ongoing capital rotation away from vulnerable sectors toward structurally resilient equities.
This article is for informational purposes only and should not be considered financial advice. Investors should conduct their own research and consult with financial professionals before making investment decisions.