
AstraZeneca’s £300M UK Investment Reverses 2025 Retreat
11 mins ago

Despite a slight contraction in top-line sales, Parsons Corporation managed to push its profit margins to unprecedented highs during the first quarter, triggering a positive reaction on Wall Street. The infrastructure and defence contractor released its Q1 Parsons earnings report on 29 April 2026. The results revealed a complex financial picture where a lucrative contracting pipeline offset broader revenue pressures.
Investors evaluating the company must look past the surface-level revenue decline to understand the underlying organic growth metrics. The true value of the quarter lies in a historic $9.3 billion backlog and what it means for the company’s future valuation.
Understanding how management generated record profitability from a reduced revenue pool provides immediate context for the stock’s upward momentum.
The market reaction validated the company’s profitability strategy immediately at the opening bell. Parsons shares rose 0.66% to $51.84 in pre-market and regular trading, reaching intraday gains as high as 3%. Investors heavily discounted the slight revenue shortfall in favour of the strong margin expansion.
The company reported an adjusted earnings per share of $0.79, comfortably beating analyst estimates of $0.68 to $0.69. This bottom-line performance absorbed the impact of total revenue landing between $1.49 billion and $1.50 billion, which sat below the projected $1.51 billion to $1.53 billion range. The trading day momentum clearly favoured the profit beat over the top-line miss.
The official Q1 2026 financial report from the company details how this earnings beat was achieved alongside an adjusted EBITDA margin of 10.1 percent, confirming the fundamental shift toward higher margin operations.
| Financial Metric | Q1 2026 Wall Street Estimates | Q1 2026 Actual Results |
|---|---|---|
| Adjusted Earnings Per Share (EPS) | $0.68 to $0.69 | $0.79 |
| Total Revenue | $1.51 billion to $1.53 billion | $1.49 billion to $1.50 billion |
A surface reading of the first quarter indicates that total reported revenue declined by 4% annually. However, a single classified fixed-price contract mathematically distorted the overall top-line volume. When evaluating defence contractors, investors must adjust these reported figures to strip out the volume drag of confidential projects to find the actual organic growth rate.
Research from the Center for Strategic and International Studies on defense acquisition trends highlights how locked rate structures frequently transfer inflation risks to the contractor, creating potential revenue distortions when unforeseen project costs arise.
Beneath the headline drop, the underlying business demonstrated steady expansion. When excluding the confidential project, overall revenue actually expanded by 8% annually. This translated to a genuine 8% organic growth rate across the broader enterprise.
The core divisions provided stability beneath these surface metrics. The Critical Infrastructure segment grew 3% to $732.8 million, while the Federal Solutions segment maintained solid margins despite the classified contract drag.
Reported Top-Line Metric: Total Q1 2026 revenue declined by 4% year-over-year. Adjusted Revenue Metric: Total revenue expanded by 8% annually when excluding the single classified fixed-price contract. * Organic Growth Rate: The adjusted figures reveal a steady 8% organic growth baseline across the enterprise.
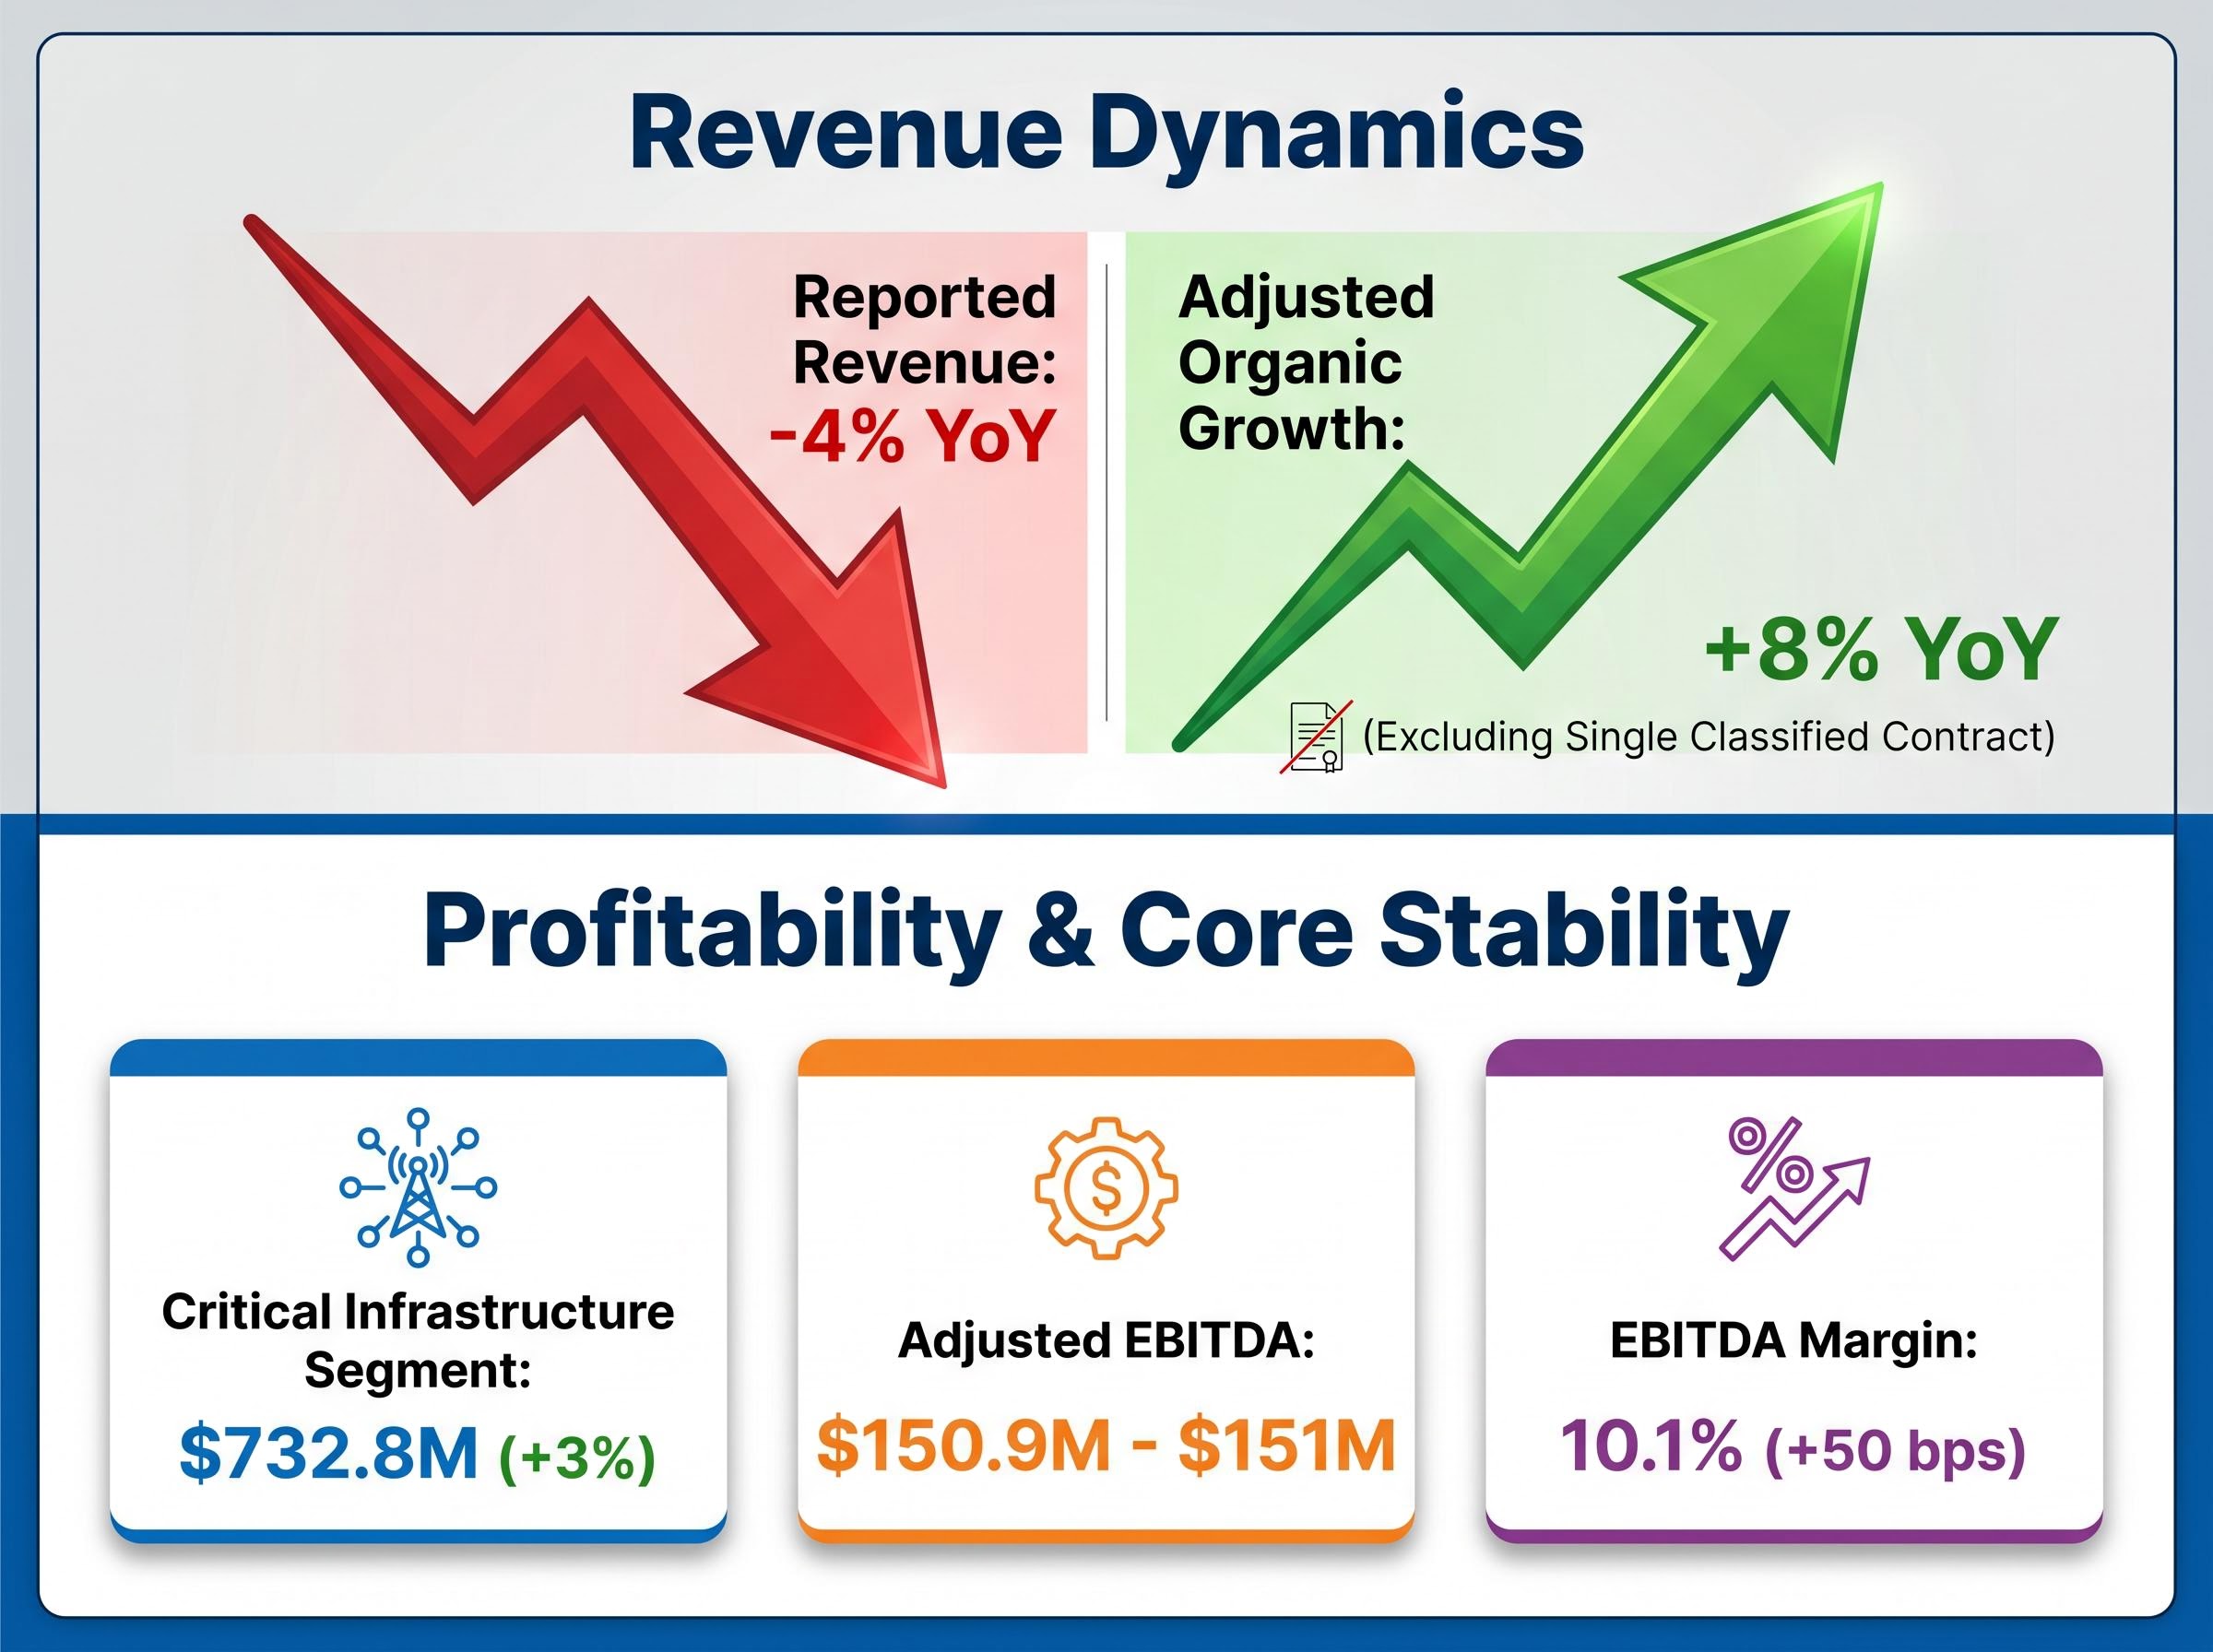
Management extracted significantly higher profit margins from a smaller overall revenue pool, demonstrating notable operational resilience. Parsons reported a record adjusted earnings before interest, taxes, depreciation, and amortisation (EBITDA) of $150.9 million to $151 million. This pushed the EBITDA margin to an all-time high of 10.1%, representing a 50-basis-point increase compared to the previous year.
Fundamental financial health indicators also improved alongside the profit margins. According to company data, operating cash flow utilised just $4 million during the quarter, compared to the $12 million consumed in the prior year period.
The margin expansion connects directly to recent corporate execution strategies and accretive mergers. The successful integration of the $375 million Altamira acquisition specifically contributed to the bottom line. This deal demonstrates the direct synergy between national security acquisitions and sustained margin growth.
CEO Commentary “Our team delivered strong operational execution and organisational resilience, driving record profitability even as we navigated complex fixed-price contract dynamics,” stated Carey Smith, Chief Executive Officer.
The company secured a staggering volume of fresh contracts across critical infrastructure and space defence operations during the first quarter. This steady conversion of fresh awards provides immediate future visibility for the multi-year earnings trajectory.
The surge in new awards aligns with a wider macroeconomic trend where major technology and government entities are committing to historic infrastructure investments, creating extensive development pipelines across specialized sectors.
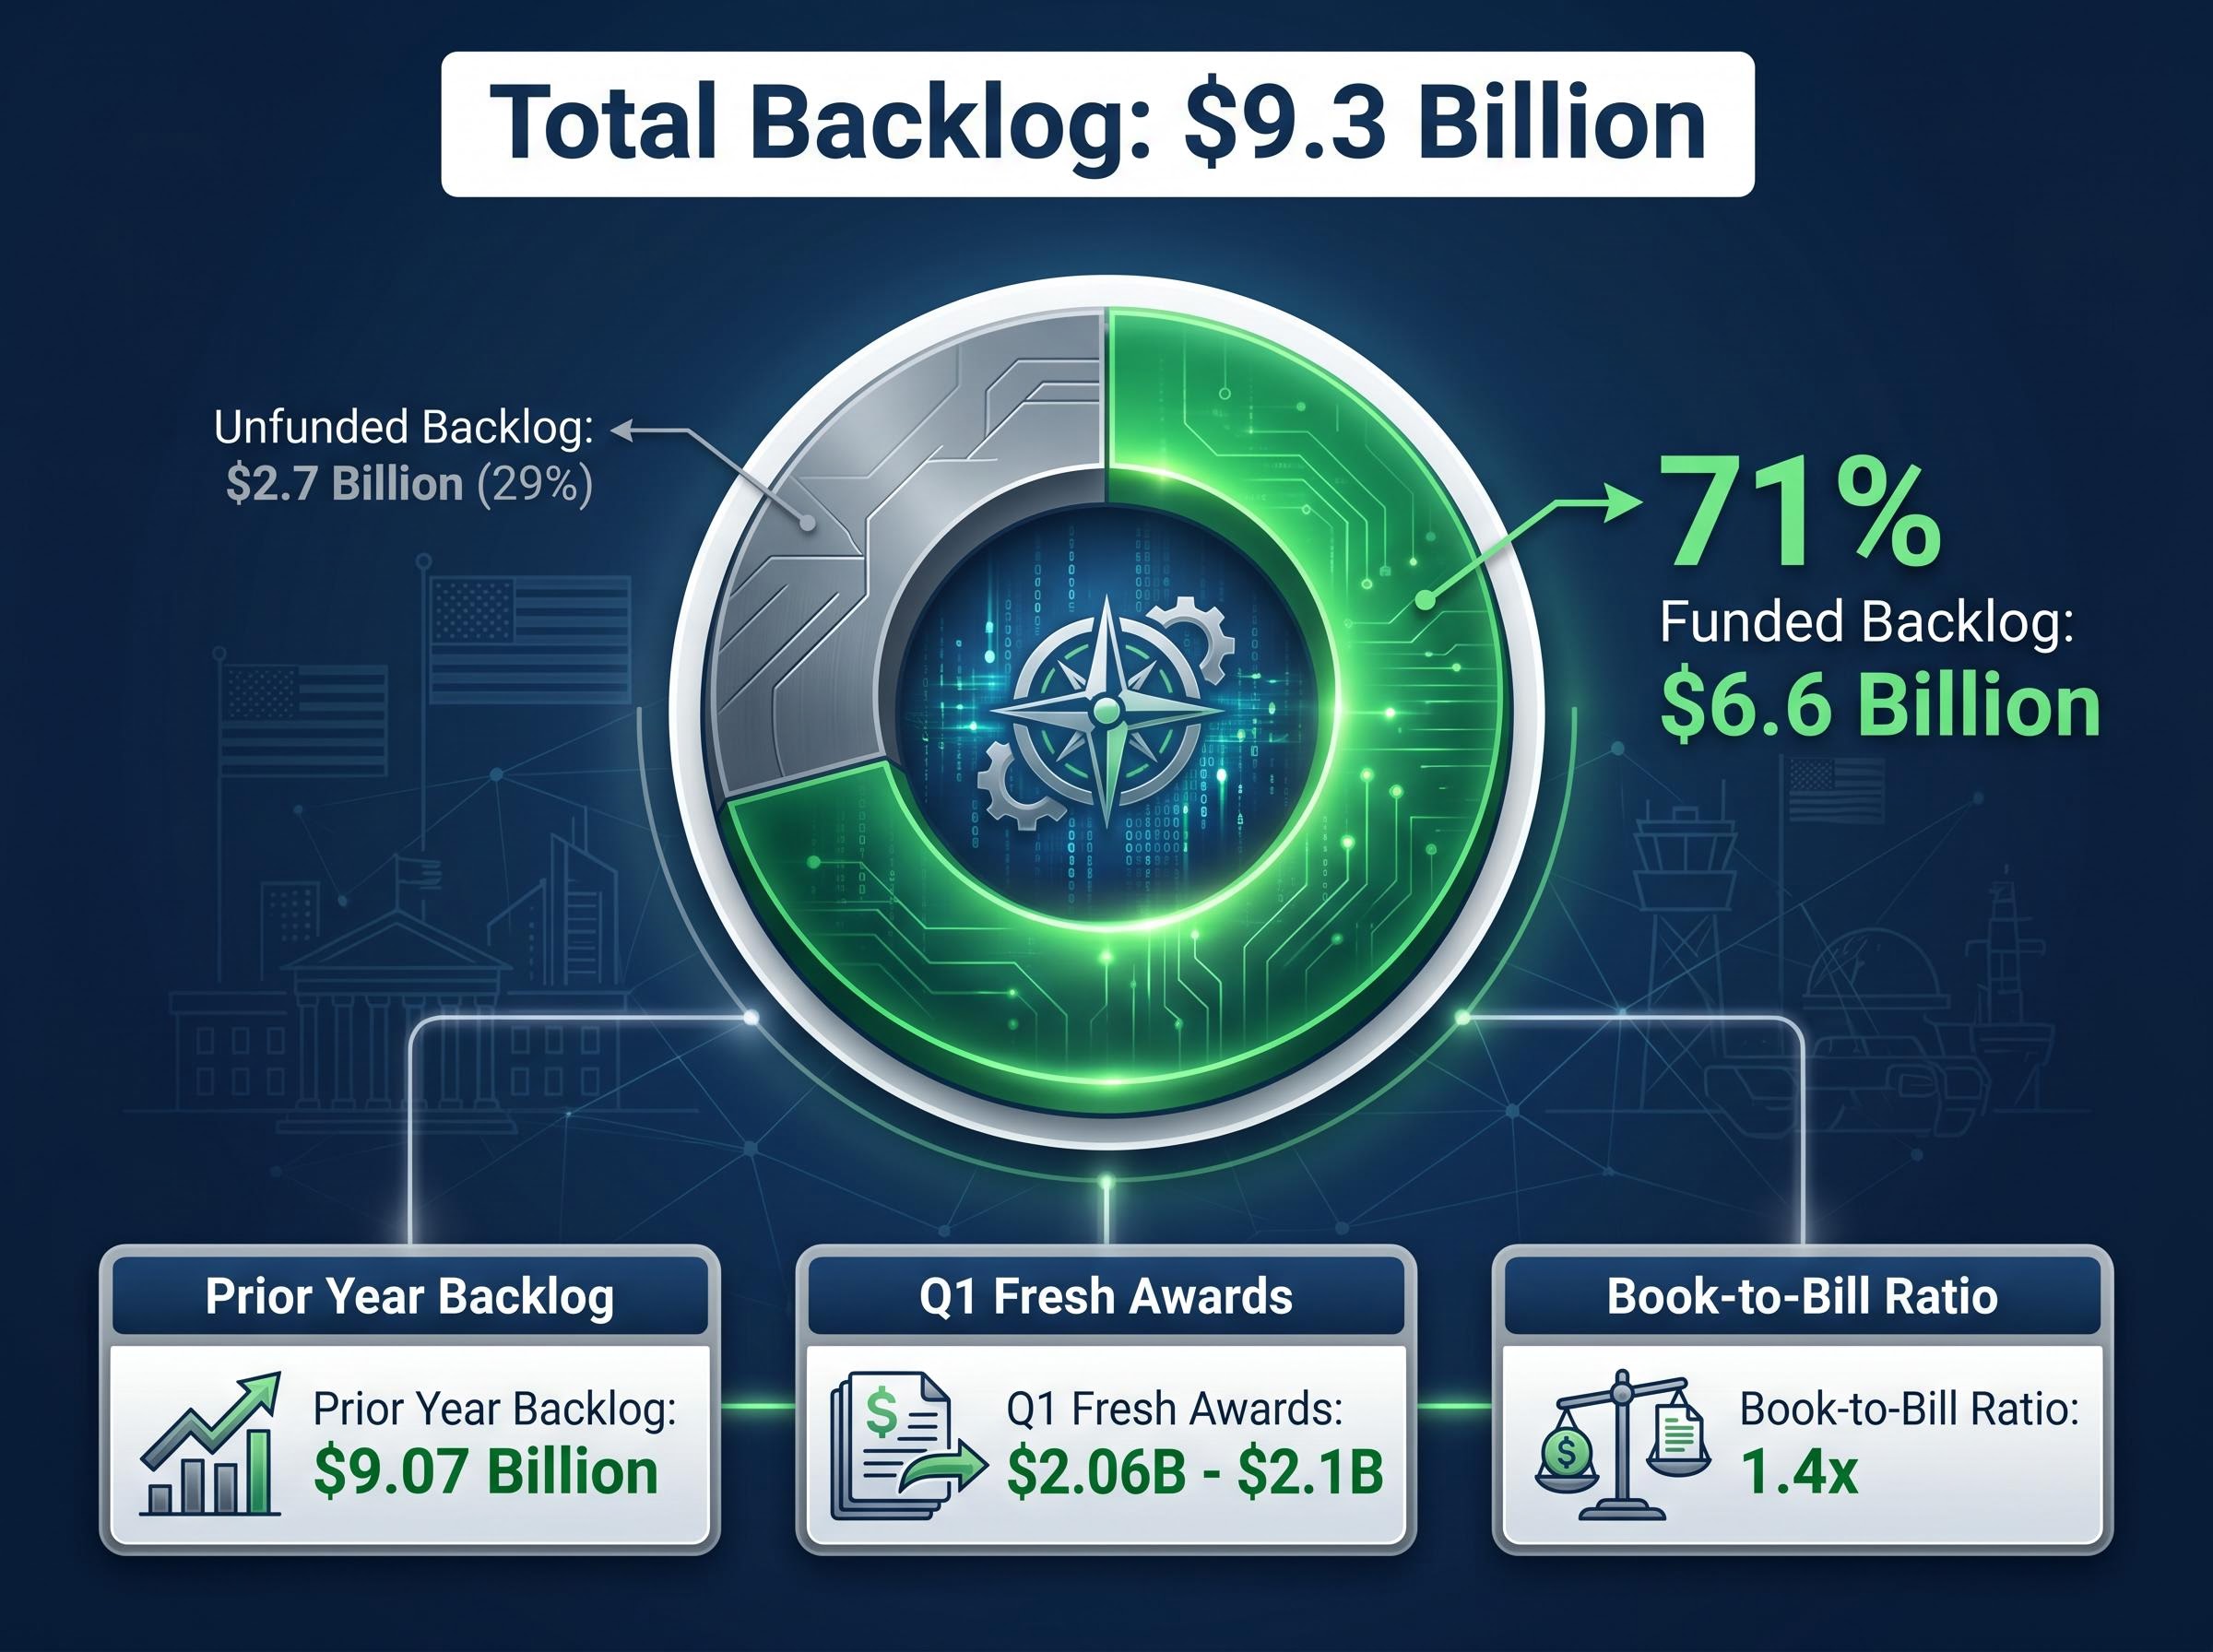
The backlog stands as the ultimate indicator of future revenue certainty for defence contractors. Parsons pushed its total backlog to a historic $9.3 billion, up from $9.07 billion the previous year. Importantly, the funded portion of this pipeline represents the majority of total commitments.
Management achieved a 1.4x book-to-bill ratio, driven by $2.06 billion to $2.1 billion in fresh Q1 awards. This high ratio acts as the primary engine for future revenue stabilisation.
Management’s decision to maintain their existing full-year outlook sent a clear signal of demand resilience. The company reaffirmed its Fiscal 2026 guidance across all major financial brackets. The guidance median of $6.65 billion rests slightly under the average market forecast, yet Wall Street absorbed this without penalty.
This reaffirmed corporate guidance provides investors with a quantified understanding of expectations for the remainder of the fiscal year. The sustained margin profile effectively insulates the company against broader federal budget pressures.
For readers wanting a complete breakdown of the quarterly metrics and backlog conversion rates, our full explainer on Parsons earnings explores how the company’s cash management strategies are supporting these forward projections.
| Financial Category | Maintained FY 2026 Guidance Bracket |
|---|---|
| Total Revenue | $6.5 billion to $6.8 billion |
| Adjusted EBITDA | $615 million to $675 million |
| Operating Cash Flow | $470 million to $530 million |
This article is for informational purposes only and should not be considered financial advice. Investors should conduct their own research and consult with financial professionals before making investment decisions. Past performance does not guarantee future results. Financial projections and forward-looking statements are subject to market conditions, federal budget changes, and various risk factors.
Parsons reported adjusted earnings per share of $0.79, beating analyst estimates, and achieved record adjusted EBITDA of $150.9 million to $151 million. Total revenue was $1.49 billion to $1.50 billion, slightly below projections.
A single classified fixed-price contract distorted the reported revenue, showing a 4% decline. However, when adjusted, the underlying business demonstrated an 8% annual organic growth rate, with improved operational efficiency driving record profitability.
Parsons' project backlog reached a historic $9.3 billion, representing the total value of future secured projects. This is important for investors as it provides strong visibility into future revenue certainty and the long-term earnings trajectory.
Yes, management reaffirmed its Fiscal 2026 guidance across all major financial brackets, including total revenue of $6.5 billion to $6.8 billion and adjusted EBITDA of $615 million to $675 million. This indicates confidence in sustained demand and performance.