Investing During Inflation: Portfolio Strategies for 2026
49 mins ago

According to unverified reports, Parsons Corporation shares jumped 3.2 percent in pre-market trading on April 29, immediately contradicting the apparent weakness of a contraction in top-line sales. The latest Parsons earnings release serves as a prime example of how surface-level revenue figures often mask the underlying operational health of major United States defence and infrastructure contractors.
Investors tracking the sector require a clear breakdown of true profitability metrics to look past the headline numbers. A single classified agreement heavily influenced the overall growth narrative, concealing underlying strength in core business areas.
Understanding the forward trajectory requires analysing the hidden impact of these classified agreements alongside a framework for interpreting defence sector future revenue pipelines.
The headline top-line sales figure aligned perfectly with Wall Street forecasts, yet it presented a complex picture of year-over-year performance. The company reported an 8 percent organic contraction in total sales, a metric that initially suggested operational slowing.
The reality of the quarterly performance becomes visible only when isolating a single, undisclosed defence project. When adjusting for this specific classified agreement, the core business actually delivered a 3 percent organic expansion and an 8 percent annual climb in adjusted revenue.
Growth across the broader portfolio absorbed the impact of the classified contract fluctuations. Transportation, space and missile defence, and critical infrastructure protection emerged as the primary drivers of this core business expansion.
Investors need to understand that regulatory or security-based reporting quirks can artificially depress headline growth figures while the foundational business continues to scale.
Defence contractors must navigate complex ASC 606 revenue recognition standards when managing classified projects, which frequently require delayed financial reporting until specific performance obligations are met and security clearances allow disclosure.
| Metric | Q1 2026 Result | Reported YoY Change | Adjusted YoY Change |
|---|---|---|---|
| Top-Line Sales | $1.5 billion | 4 percent decline | 8 percent increase |
| Organic Growth | N/A | 8 percent contraction | 3 percent expansion |
To evaluate a defence contractor accurately, financial professionals look past current quarter sales and examine forward revenue indicators. The book-to-bill ratio is the primary tool for this analysis, calculating the ratio of orders received to the amount billed for a specific period.
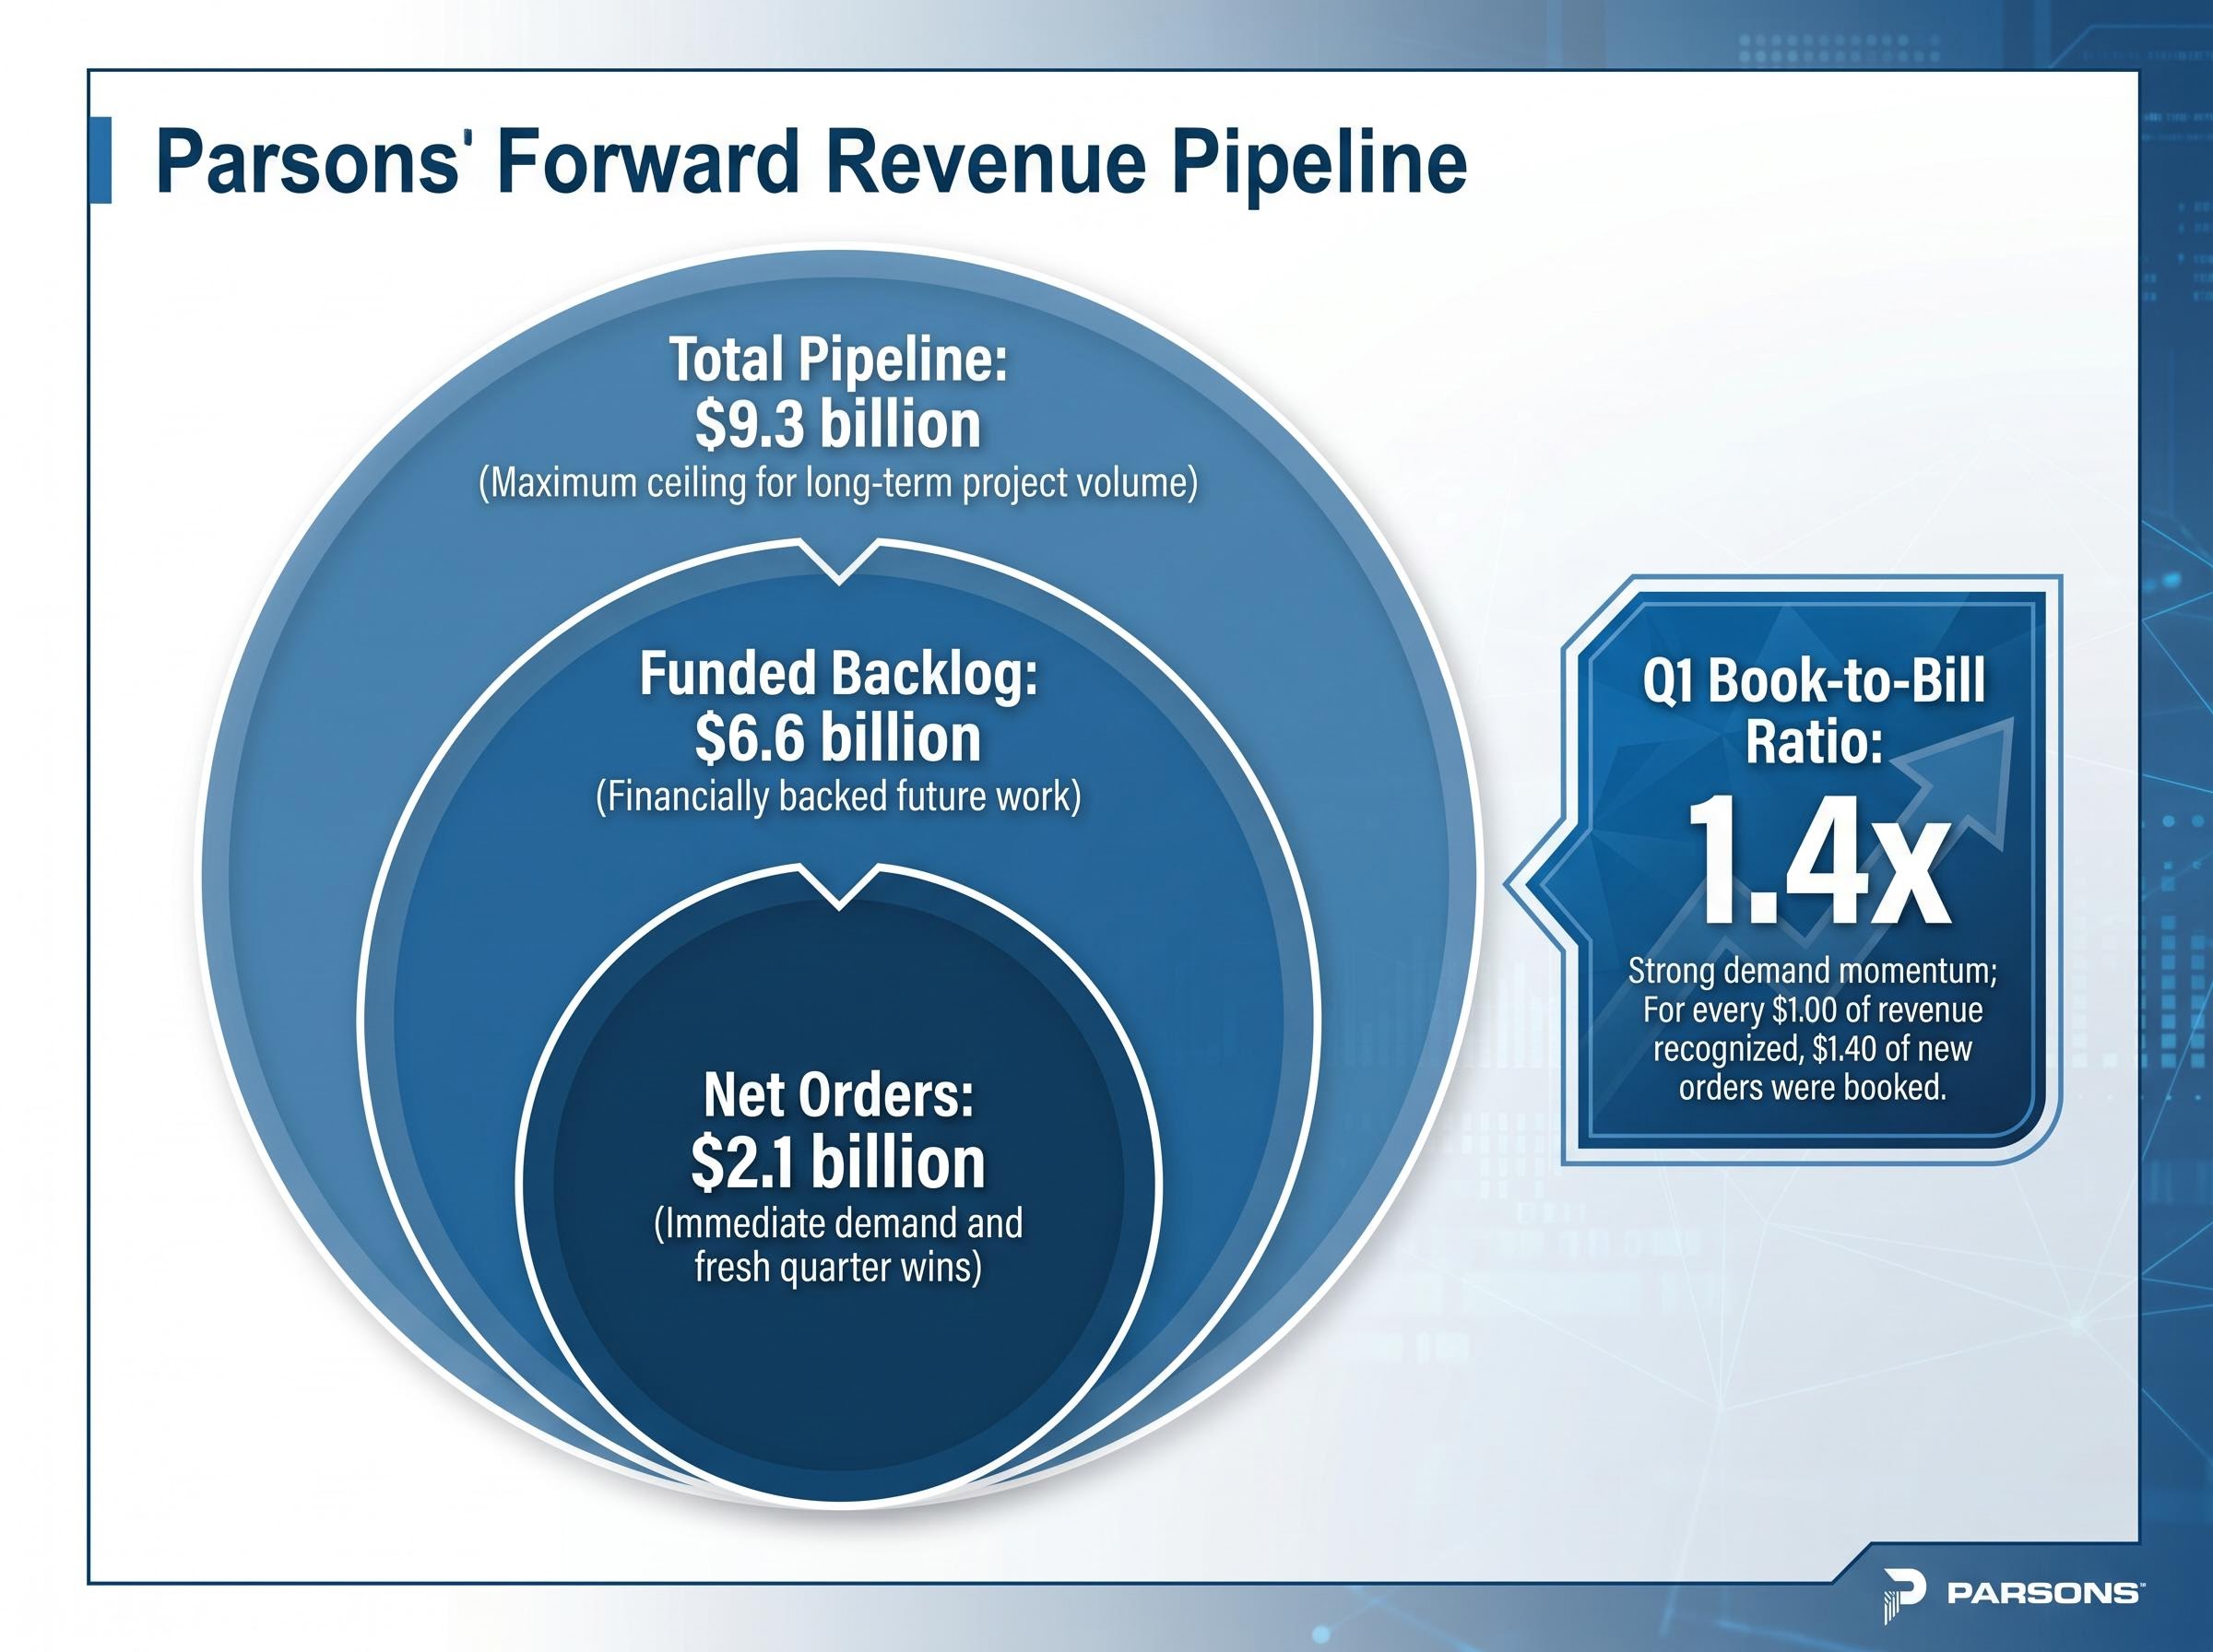
A ratio above 1.0 indicates that a company is generating more new orders than it is fulfilling, pointing to future revenue growth. According to unverified reports, during the first quarter, the company secured $2.1 billion in new net orders, generating a robust 1.4x book-to-bill multiplier across its two primary divisions.
According to unverified reports, this intake rate pushed the total project pipeline to a historic maximum of $9.3 billion. However, analysts distinguish between this total cumulative pipeline and funded backlog, which represents financially backed future work. According to unverified reports, the funded backlog reached $6.6 billion, representing peak volume since the initial public offering.
The official Parsons Q1 2026 financial results confirm these backlog benchmarks, providing transparent verification of the substantial contract volume secured during the reporting period.
Strong forward indicators provide a critical buffer against short-term revenue fluctuations. The interaction between these metrics shapes future cash flow expectations:
Wall Street rewarded the adjusted profitability beat because it demonstrated substantial operational efficiency, overriding concerns about raw net earnings. According to unverified reports, net income fell 20 percent to $53 million, a double-digit percentage decline that would typically pressure share prices.
However, the underlying operational metrics painted a picture of tightening management and improved cost controls. According to unverified reports, adjusted per-share earnings reached $0.79, delivering a significant operational victory over the consensus expectations of $0.69. Adjusted EBITDA climbed to $151 million, establishing a historic Q1 2026 high and a 1 percent annualised increase.
Management Execution Milestone The delivery of a ten-cent earnings beat was driven by profitability margins reaching a peak of 10.1 percent, representing a 50 basis point widening that signals strong project execution across the core portfolio.
The historical first-quarter improvement in cash consumption further reinforced the positive market reaction. Cash consumed by operations contracted to $4 million, a notable improvement from the $12 million consumed in the first quarter of 2025.
Improved cash management supports sustained business operations during periods of uneven revenue recognition. By separating adjusted operating metrics from raw net income, readers can identify the true operational efficiency that drove early market optimism.
For readers wanting to understand how prime contractors and their suppliers actually secure these lucrative agreements, our deep-dive into US Navy procurement channels examines the supply chain integration required to win recurring defense work.
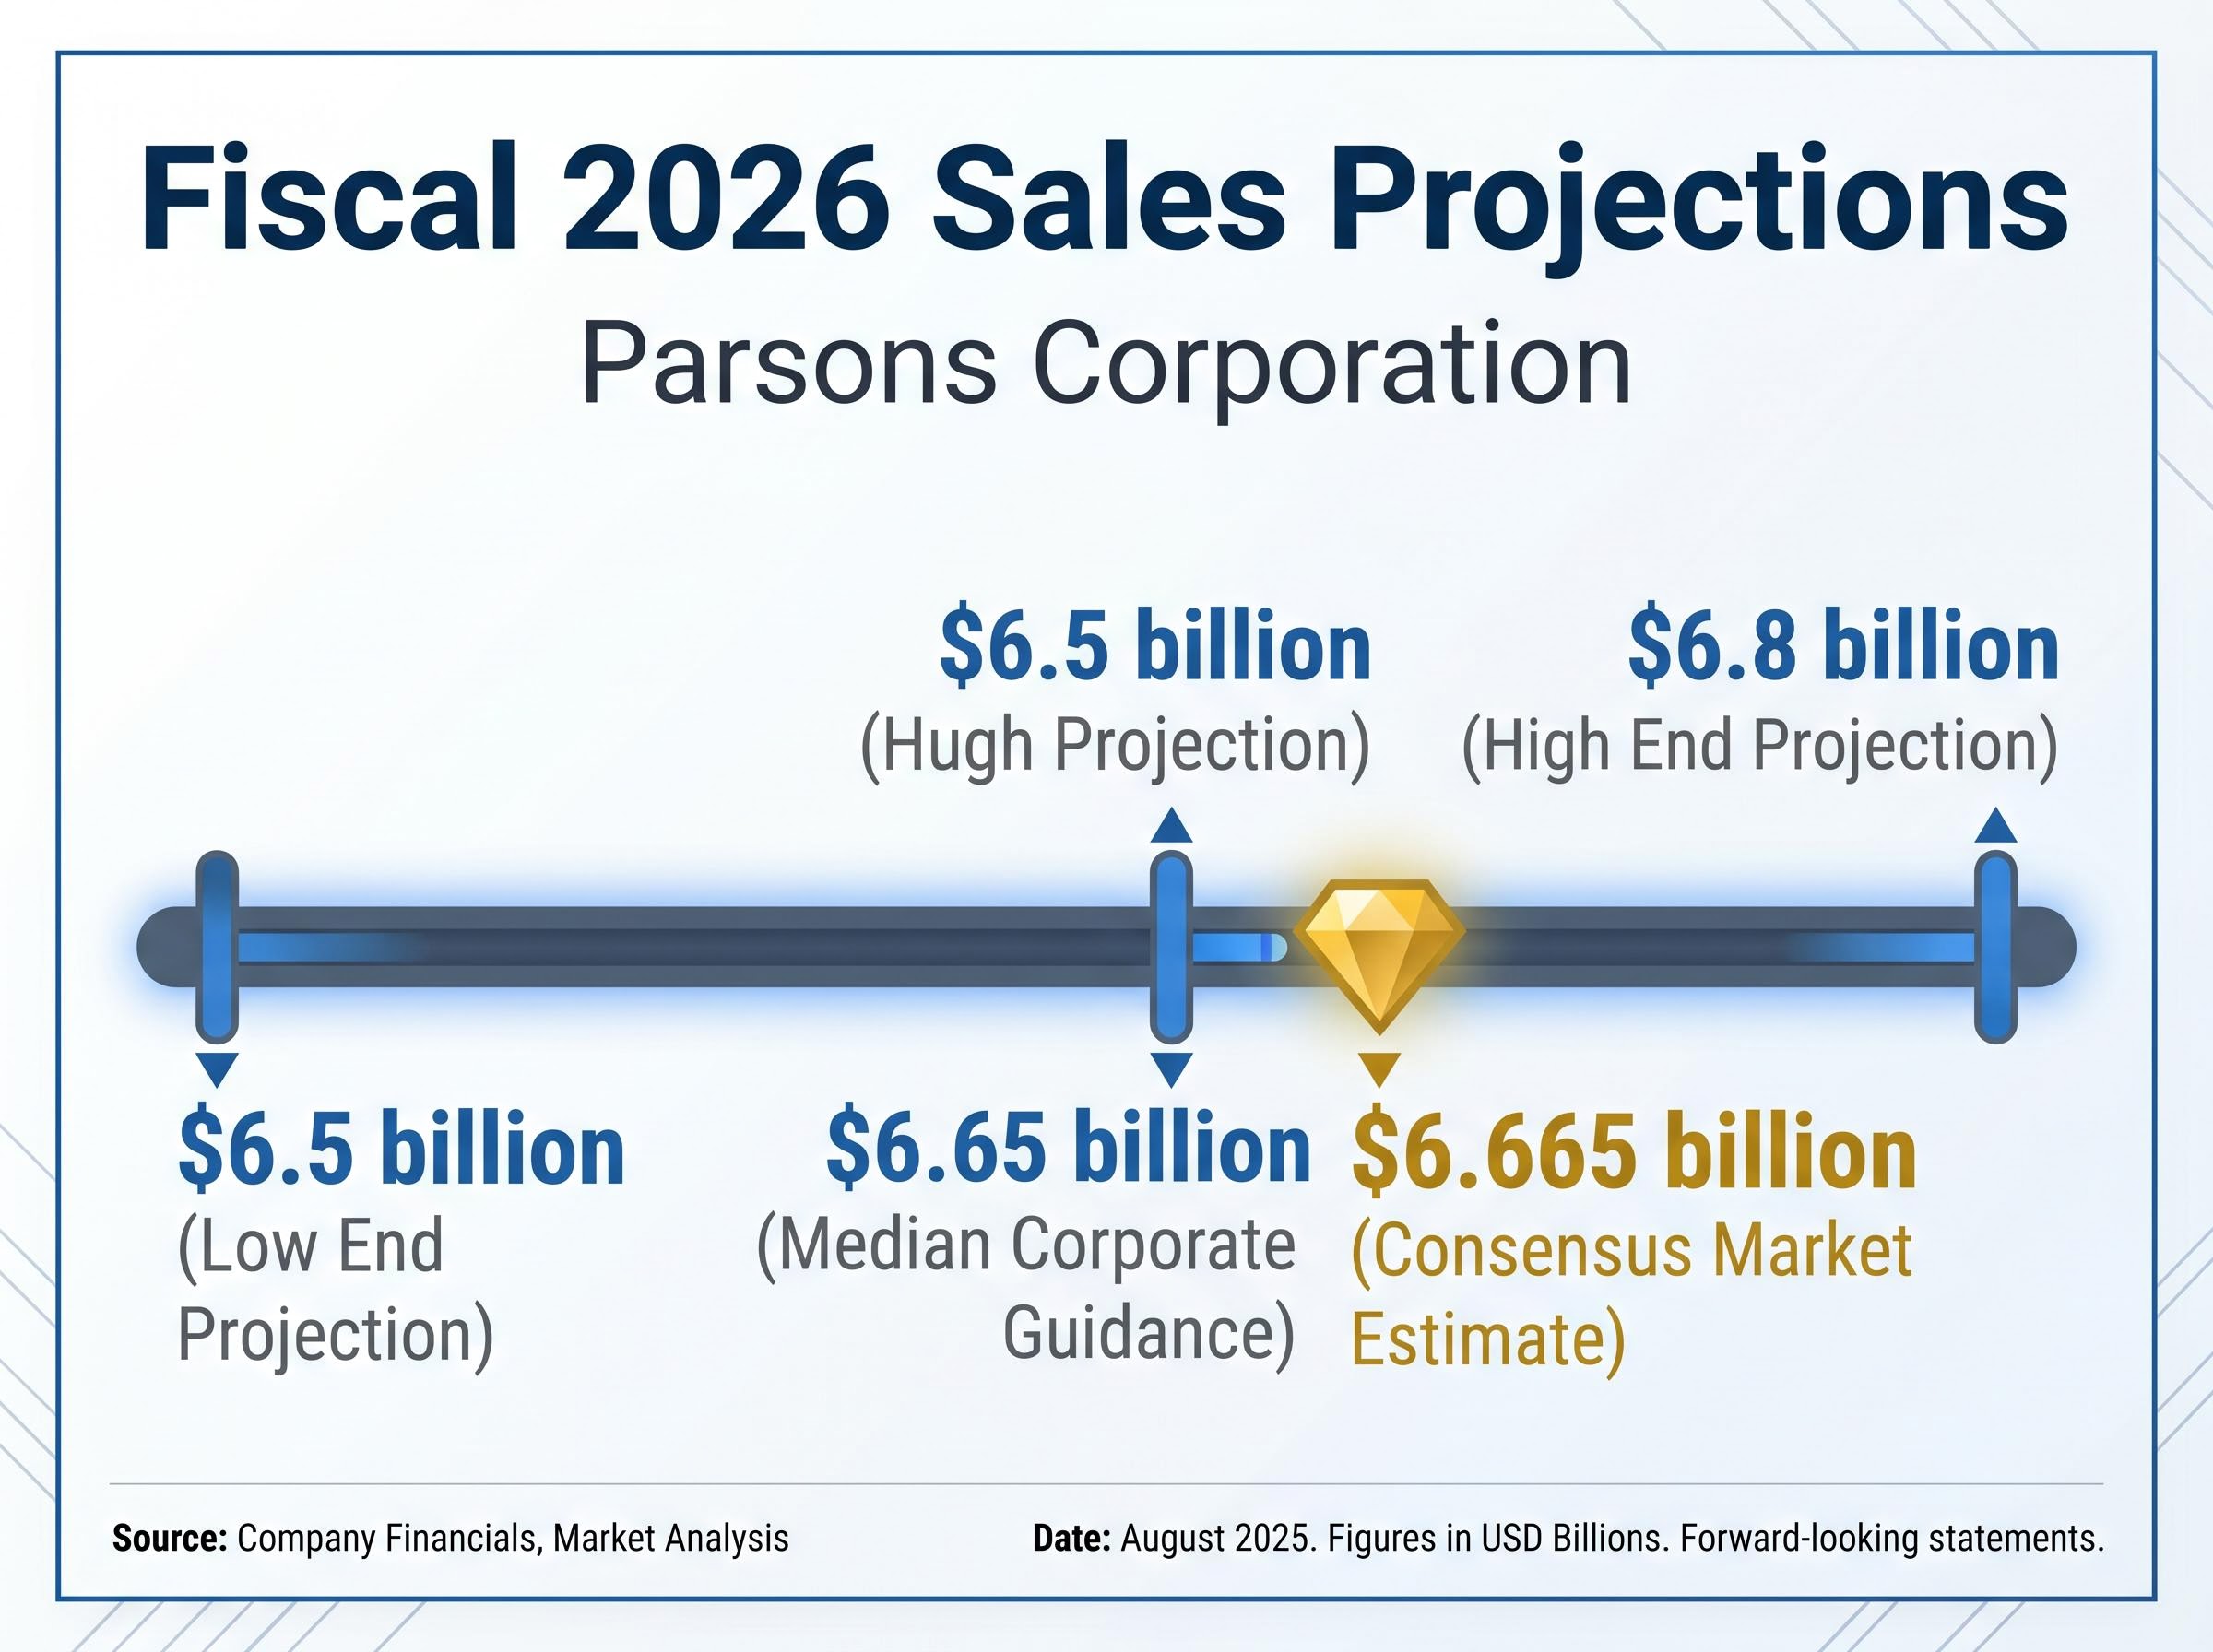
The full-year sales projections align with the newly established record backlog, setting clear expectations for the remainder of the fiscal year. According to unverified reports, management established a full-year sales projection range between $6.5 billion and $6.8 billion.
The median corporate guidance of $6.65 billion lands marginally below the $6.665 billion expected by market watchers. This suggests management is taking a conservative approach to forward projections despite the massive order volume secured in the first quarter.
Low End Projection: $6.5 billion Median Corporate Guidance: $6.65 billion Consensus Market Estimate: $6.665 billion High End Projection: $6.8 billion
Execution strength will ultimately determine if the total pipeline translates into recognised revenue under this conservative framework. Past performance does not guarantee future results, and financial projections are subject to market conditions and various risk factors.
Navigating US government procurement cycles remains critical for defense contractors, as shifting federal budgets and funding delays can heavily influence when a funded backlog actually converts to active project cash flows.
This article is for informational purposes only and should not be considered financial advice. Investors should conduct their own research and consult with financial professionals before making investment decisions.
The reported revenue contraction in Parsons' earnings was primarily due to a single, undisclosed classified defense project, which temporarily depressed headline figures under specific revenue recognition standards.
Investors should examine forward indicators like the book-to-bill ratio, total project pipeline, and funded backlog, as these metrics provide insight into future revenue growth and stability beyond current quarter sales.
Parsons achieved adjusted per-share earnings of $0.79, exceeding consensus, with adjusted EBITDA reaching a historic $151 million and profitability margins widening to 10.1 percent.
The $9.3 billion total pipeline represents a historic maximum for potential future work, including unexercised contract options, signaling a strong long-term project volume ceiling for Parsons.