Two Index Changes on 29 June, Two Very Different Flow Stories
1 hr ago

According to market data, four dominant technology corporations reporting today account for upward of $10 trillion in market capitalisation and 17% of the total S&P 500 index weighting. It is 29 April 2026, and markets are bracing for simultaneous financial disclosures from Microsoft, Alphabet, Amazon, and Meta after the closing bell. This critical round of big tech earnings will reveal whether the sector’s aggressive investments are generating sustainable returns or creating unprecedented capital vulnerabilities.
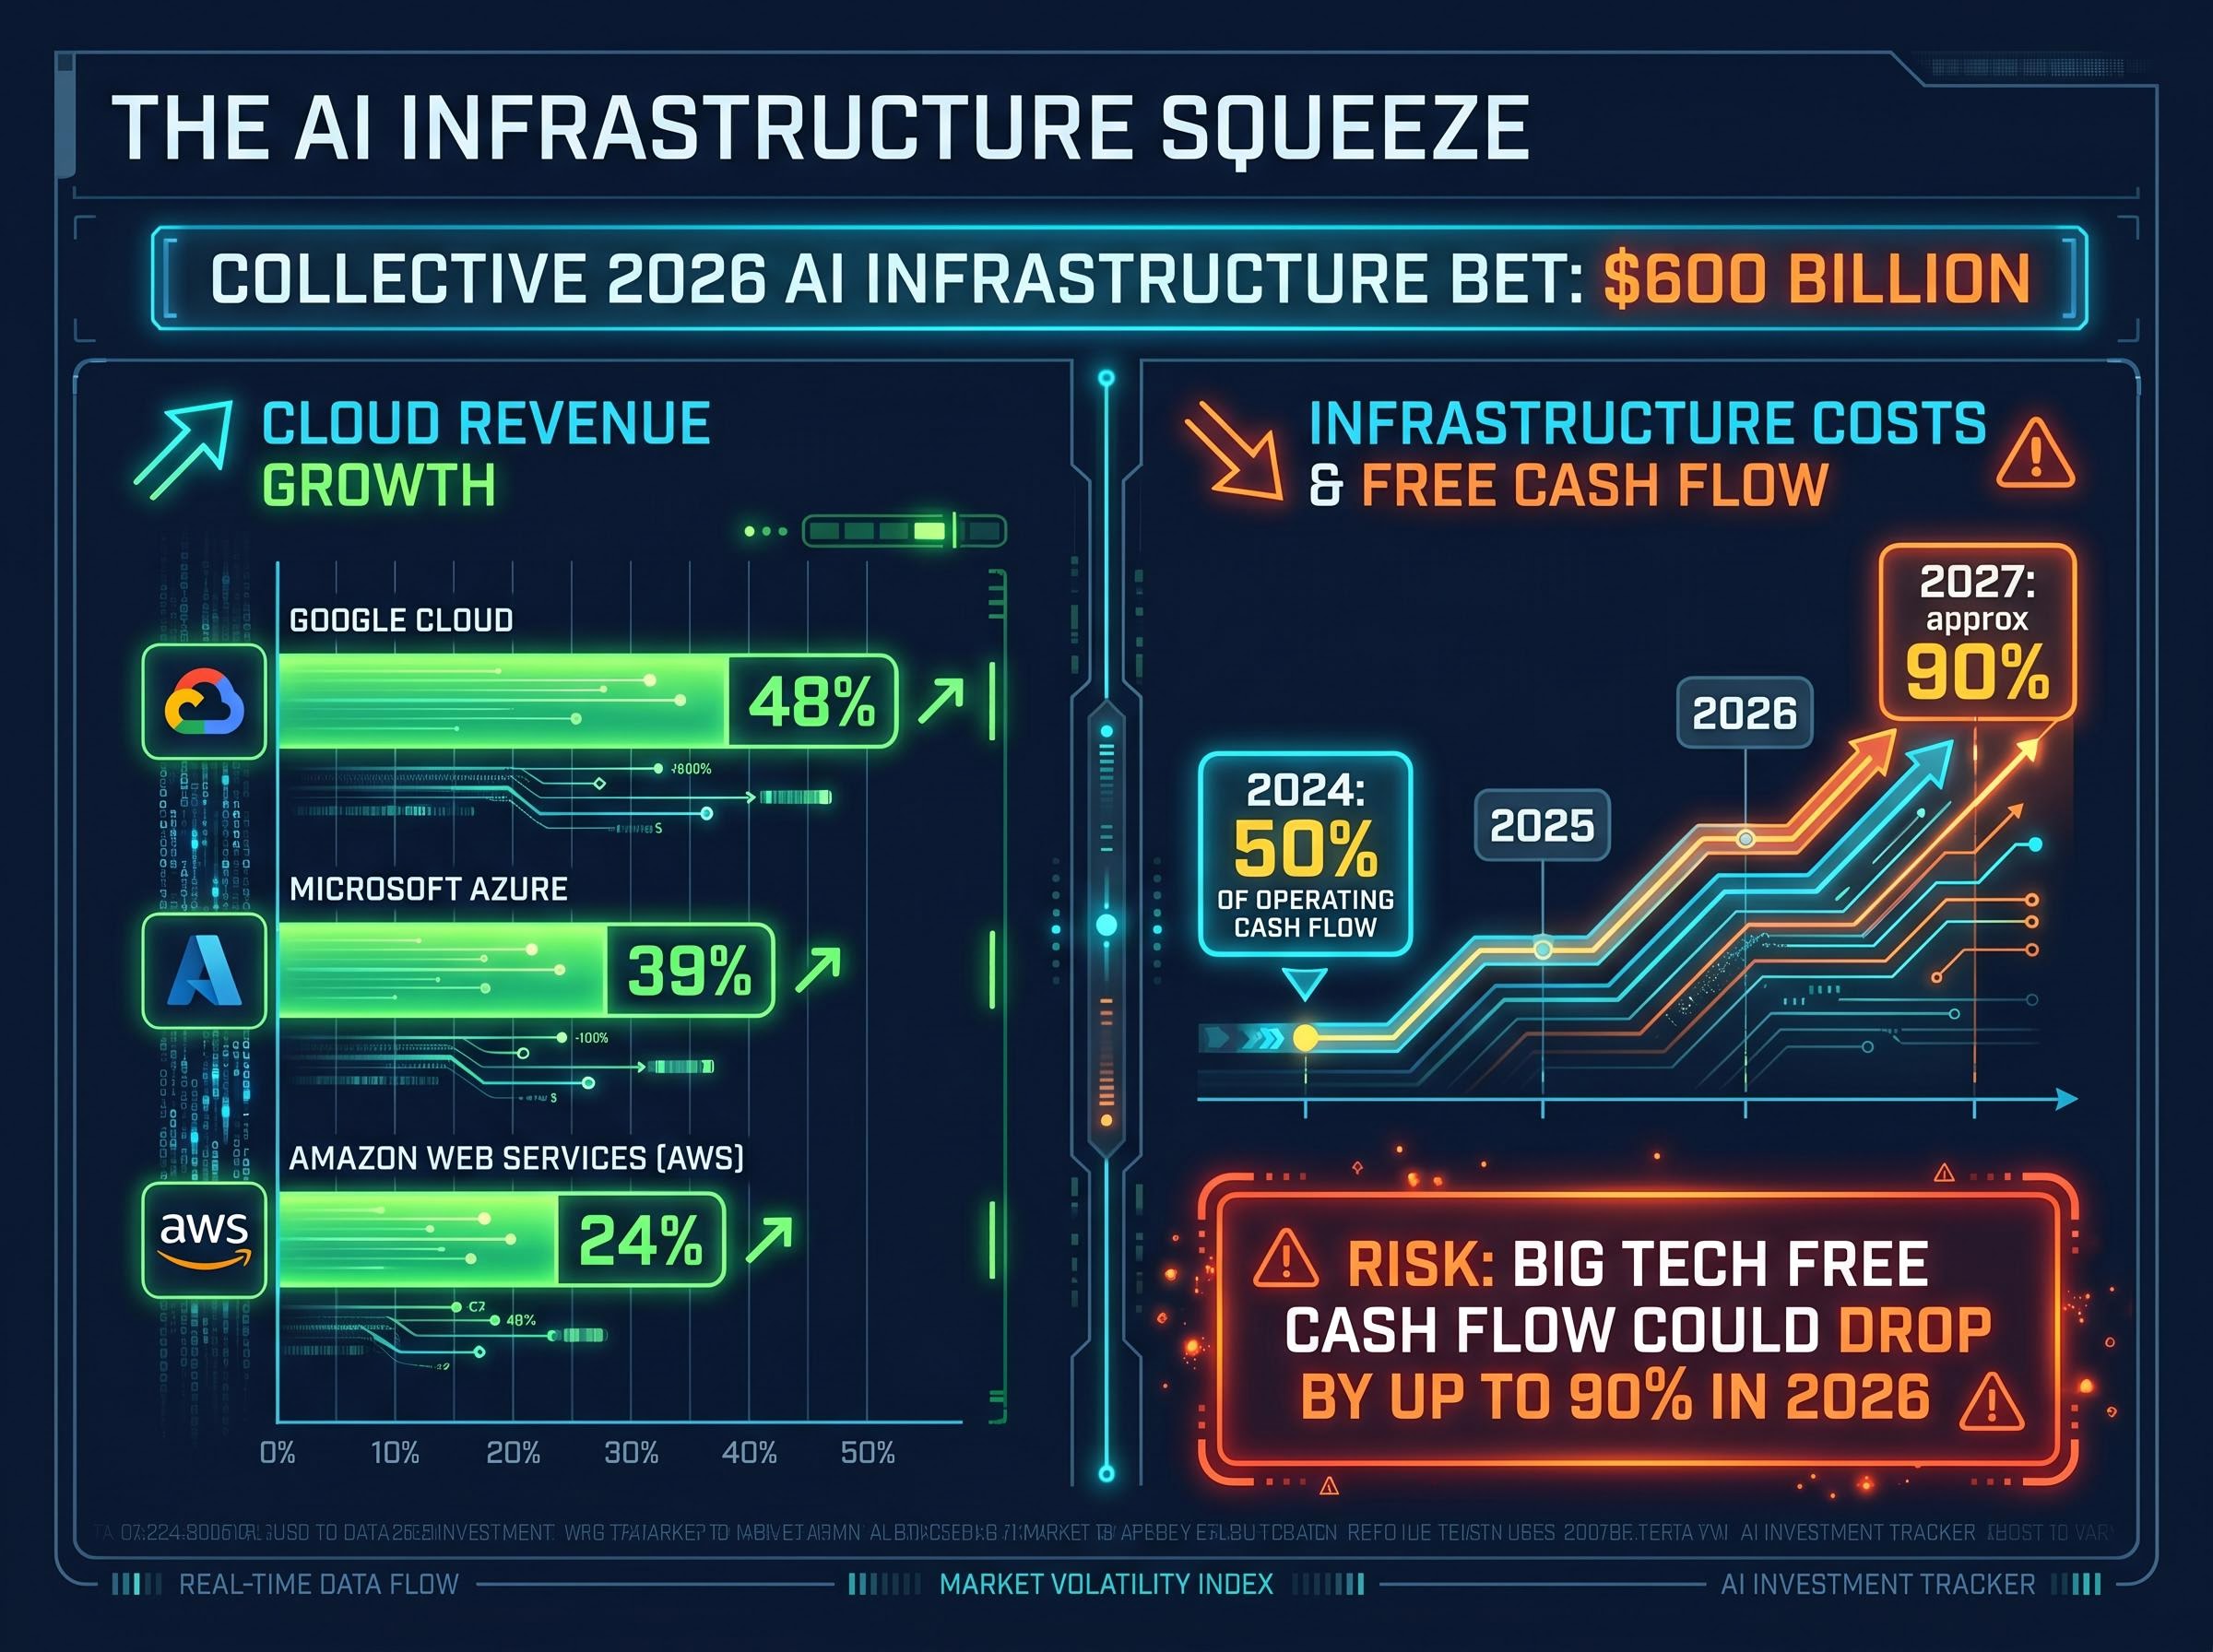
Investors face a stark reality as the trading day concludes. Today’s disclosures will show whether the collective $600 billion bet on artificial intelligence infrastructure is translating into actual revenue or simply burning through corporate cash reserves.
The financial outcomes announced this afternoon will set the immediate trajectory for global equity markets. Understanding these metrics provides a clear view into the sustainability of the current technology valuation cycle.
The raw scale of capital deployment happening inside hyperscale data facilities has transformed standard revenue excitement into high-stakes financial vulnerability. Combined capital allocations for the Big Four surpass $600 billion for the 2026 calendar year alone. Total spending across the top five technology firms, including Oracle, is up 36% from 2025.
This coordinated spending surge represents a multi-year structural shift rather than a temporary cyclical expense. According to industry estimates, infrastructure expenditures are forecast to expand from 50% of operating cash flow in 2024 to approximately 90% by 2027. This creates a sharp tension between bullish top-line cloud revenue growth and the severe bottom-line costs required to build the underlying machine learning hardware.
Beyond pure capital constraints, companies face severe power grid limitations that are increasingly dictating where and when these new computing facilities can physically open.
Understanding the sheer magnitude of this capital deployment helps investors grasp why standard top-line metrics no longer guarantee positive stock reactions. Financial analysts warn that infrastructure costs are permanently altering the corporate balance sheets of these dominant platforms.
CreditSights Analysis “An estimated 75% of this collective infrastructure spend targets artificial intelligence specifically, creating a multi-year revenue tailwind for suppliers that does not explicitly guarantee Big Tech’s own cash flow positivity in the near term.”
Capital expenditure represents the cash a company spends to buy, maintain, or improve its fixed assets, such as server farms and data centres. Free cash flow is the money remaining after a company pays for its operating expenses and these capital expenditures. When massive infrastructure investments accelerate faster than the revenue they generate, a company can report record sales growth while simultaneously watching its actual cash reserves plummet.
Institutional investors use this exact financial mechanism to judge corporate health during periods of rapid expansion. Analyst projections indicate big tech free cash flow could drop by up to 90% in 2026. This alarming forecast stems from a specific warning that artificial intelligence-driven revenue growth is currently being outpaced by the sheer cost of building the required data centres.
This sudden evaporation of free cash flow also introduces significant index concentration risk, as passive fund managers find their broader market returns intrinsically tethered to the capital efficiency of these four technology giants.
Markets will aggressively punish companies that spend too much capital, regardless of their headline sales figures. In Q4 2025, Amazon announced a $200 billion capital plan alongside solid quarterly results. The stock immediately dropped 10% due to severe near-term return concerns from institutional shareholders.
Despite these cash flow warnings, hyperscalers are maintaining specific positive revenue signals that keep their core operations highly profitable:
Amazon Web Services (AWS) demonstrating year-over-year growth of 24% Google Cloud expanding revenues by a commanding 48% * Microsoft Azure maintaining robust enterprise adoption with 39% growth
Wall Street expects definitive answers this afternoon regarding the tension between soaring cloud revenues and escalating hardware costs. Analysts have established precise scorecards for each technology giant to measure whether the top-line growth justifies the unprecedented capital drain. Alphabet faces a unique challenge, as it is the only major platform projected to report a year-over-year earnings per share decline despite massive revenue expansion.
The sheer computational intensity of consumer queries threatens to make some generative AI applications fundamentally unprofitable, forcing technology executives to constantly balance processing costs against user acquisition targets.
The exact revenue and earnings per share estimates contrast sharply with the staggering infrastructure commitments required to sustain market share. Providing these precise consensus targets gives investors a concrete benchmark to measure against when the actual numbers cross the wire after the market closes.
| Company | Q1 2026 Revenue Estimate | Q1 2026 EPS Estimate | 2026 AI Infrastructure Capex |
|---|---|---|---|
| Microsoft | $69.5 billion | $4.07 | $145 billion |
| Alphabet | $106.88 billion | $2.68 | $175-$185 billion |
| Amazon | $211.2 billion | $4.06 | $200 billion |
| Meta | $55.5 billion | $7.25 | $115-$135 billion |
Derivatives markets are actively positioning for a highly turbulent Wednesday trading session. Options traders harbour overarching anxiety regarding the potential for severe, single-day share price movements following the afternoon disclosures. The complex derivatives data translates directly into actionable volatility expectations for individual equities.
Current options pricing indicates the following expected single-day share price movements and implied volatility rates for the Wednesday session:
Microsoft shows an implied move of 5.2% with 25% implied volatility Alphabet indicates a 6.1% implied move with 28% implied volatility Amazon prices in a 7.5% implied move with 32% implied volatility Meta reflects the highest anxiety with an 8.3% implied move and 35% implied volatility
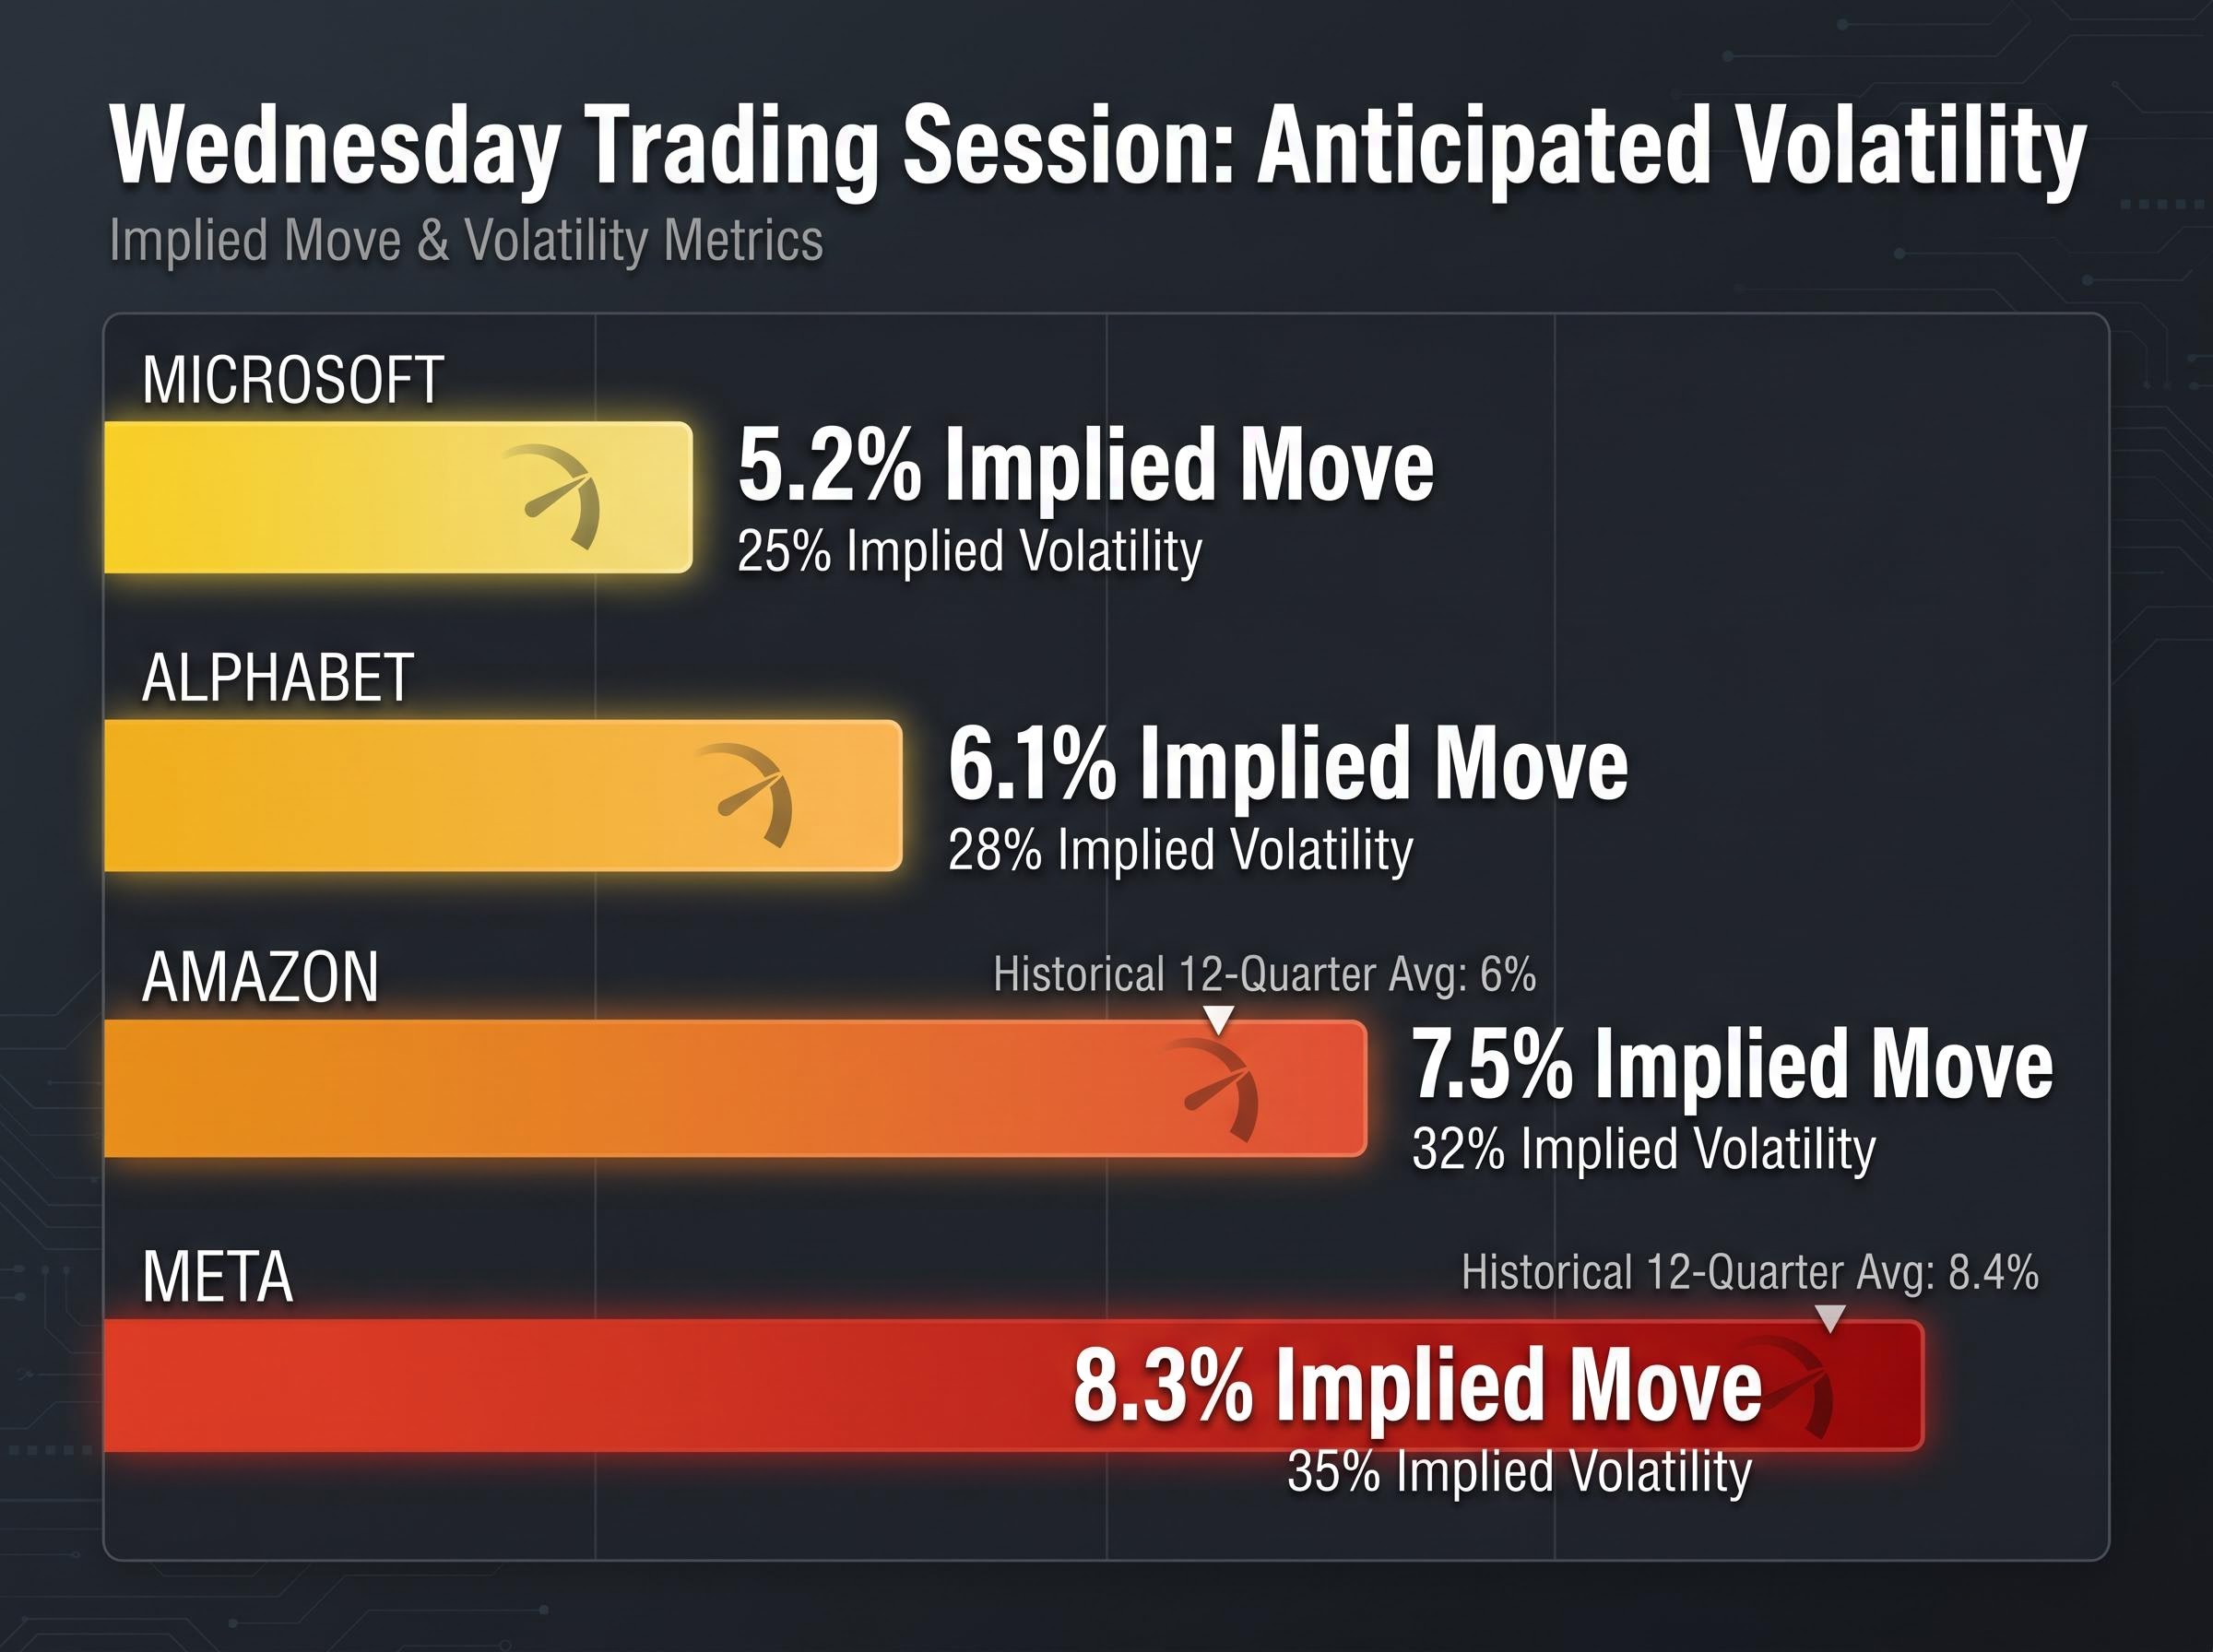
Traders might still face unexpected market turbulence if results deviate significantly from what these current premiums suggest. According to market data, the historical average post-disclosure fluctuations over the preceding 12 quarters recorded at 6% for Amazon and 8.4% for Meta. Any deviation from these established historical benchmarks could trigger outsized reactions from institutional algorithms tomorrow morning.
The high-stakes software spending directly dictates the fortunes of hardware component manufacturers across the global supply chain. The broader market is already showing collateral damage and aggressive rotation outside the core four platforms. Any announced reduction in infrastructure spending today could trigger swift negative reactions across related technology equities.
Recent localised market corrections demonstrate how tightly coupled these sectors remain. The Philadelphia Semiconductor Index closed at 10,035.58 on 28 April 2026, dropping 3.58% in a single 24-hour period. Negative developments at leading industry startups have amplified this hardware sector anxiety.
Following reports of OpenAI missing user acquisition targets, NVIDIA traded down 2.5% and Broadcom fell 1.8%. According to market data, despite this immediate caution, a specific portfolio of 50 artificial intelligence equities still advanced 27.2% between late March and the Monday prior to publication. Readers invested in hardware or broader index funds are directly exposed to the capital expenditure decisions these four software companies make today.
Top-line revenue growth is no longer sufficient to satisfy institutional investors holding the largest technology equities. The massive $600 billion collective expenditure requires definitive proof of near-term cash flow generation to justify the structural shift in corporate balance sheets.
Today’s earnings calls stand as a definitive test of the market’s continued tolerance for aggressive infrastructure buildouts. If management teams fail to articulate a clear path from hardware spending to sustained free cash flow, the sector faces a difficult recalibration.
For investors wanting to understand how this potential recalibration might unfold, our detailed coverage of big tech market influence and index risks examines the recent capital flight toward value sectors and the structural vulnerabilities embedded in cap-weighted portfolios.
This article is for informational purposes only and should not be considered financial advice. Investors should conduct their own research and consult with financial professionals before making investment decisions. Past performance does not guarantee future results. Financial projections are subject to market conditions and various risk factors.
Investors are primarily concerned with whether the significant capital deployed into AI infrastructure is translating into sustainable free cash flow or merely eroding corporate cash reserves despite strong revenue growth.
These investments can significantly reduce free cash flow, as the costs of building data centers and AI hardware might outpace the revenue generated, potentially causing a drop of up to 90% in 2026 for big tech.
Microsoft, Alphabet, Amazon, and Meta are the four dominant technology corporations scheduled to report their financial disclosures on April 29, 2026.
Derivative markets anticipate high single-day volatility, with implied moves ranging from 5.2% for Microsoft to 8.3% for Meta, indicating significant expected share price fluctuations.