Fed Holds Rates but Dot Plot Signals a Hike Before Year-End
2 hrs ago

As the final week of April 2026 begins, four technology corporations possessing a combined valuation exceeding $10 trillion prepare to report their quarterly financials. This concentration of market weight transforms standard corporate disclosures into high-stakes macroeconomic events. For investors, an analytical framework for navigating earnings season is essential to process these market signals effectively.
The traditional approach of simply reacting to headline revenue figures often leaves retail participants at a structural disadvantage. Institutional participants look past these top-line numbers, focusing instead on the options market to gauge exactly how much uncertainty is priced into a stock. By examining derivatives pricing, stakeholders can anticipate market volatility rather than merely enduring it.
Understanding how options premiums behave before and after these major announcements provides a distinct strategic edge. This methodology shifts the focus from predicting corporate performance to evaluating whether the market has accurately priced the associated risks.
Look at a trading screen immediately preceding a major corporate announcement, and the mathematical signal of uncertainty is visible in elevated options premiums. Implied volatility captures the market’s mathematical expectation of future price movement. Traders utilise at-the-money straddles, purchasing both a call and a put at the current share price, to measure these expected event-driven moves.
Once the financial disclosure occurs, the primary source of uncertainty is immediately resolved. This resolution triggers a rapid recalibration of options contracts.
The IV Crush Phenomenon An implied volatility crush occurs when the uncertainty surrounding a specific catalyst is resolved, causing the inflated time value in options premiums to collapse almost instantly, regardless of the underlying stock’s directional movement.
This mechanic reveals a critical distinction between implied volatility and realised volatility. Implied volatility represents the anticipated movement priced into the contracts beforehand. Realised volatility is the actual percentage move the stock makes after the announcement.
If a stock’s realised movement fails to exceed the implied expectation, options buyers suffer significant premium erosion. Historical data highlights the severity of this contraction for major technology stocks. Amazon 30-day implied volatility drops by an average of 31% post-earnings. Similarly, Meta 30-day implied volatility drops by an average of 29% following its disclosures.
Grasping this foundational concept prevents market participants from systematically overpaying for contracts just before an event.
The mechanics of options pricing scale dramatically when applied to the largest components of the US equity market. The Magnificent 7 stocks dictate the trajectory of major US investment portfolios and the S&P 500 index itself. The combined market valuation of Microsoft, Alphabet, Amazon, and Meta exceeds $10 trillion.
These specific entities carry massive influence over passive index funds. According to market data, these four corporations alone account for 17% of the overall S&P 500 benchmark allocation. The Magnificent 7 collectively exceed a 30% index weighting.
| Company | Market Cap | S&P 500 Weighting | Q1 2026 Implied Move | Historical Average Move |
|---|---|---|---|---|
| Alphabet | $4.02 Trillion | 3.38% | Data pending | Data pending |
| Microsoft | $2.85 Trillion | 4.92% | Data pending | Data pending |
| Amazon | $2.58 Trillion | 4.31% | +/-6.18% | According to market data, 6.0% |
| Meta | $2.0 Trillion | 2.50% | +/-6.35% | According to market data, 8.4% |
Current derivatives pricing for Q1 2026 illustrates the heightened anxiety surrounding these reports. Options currently price implied moves of +/-6.18% for Amazon and +/-6.35% for Meta. According to market data, historical average post-disclosure moves over the past twelve quarters sit at 6% for Amazon and 8.4% for Meta.
When these corporations release their data simultaneously, the resulting variance amplifies short-term market fluctuations across all sectors. Holding a diversified index fund still exposes investors directly to the earnings volatility of these specific technology giants.
For investors evaluating their passive portfolio allocations, our detailed coverage of megacap tech concentration explores how this historic market weighting effectively transforms broad S&P 500 index funds into highly vulnerable thematic bets.
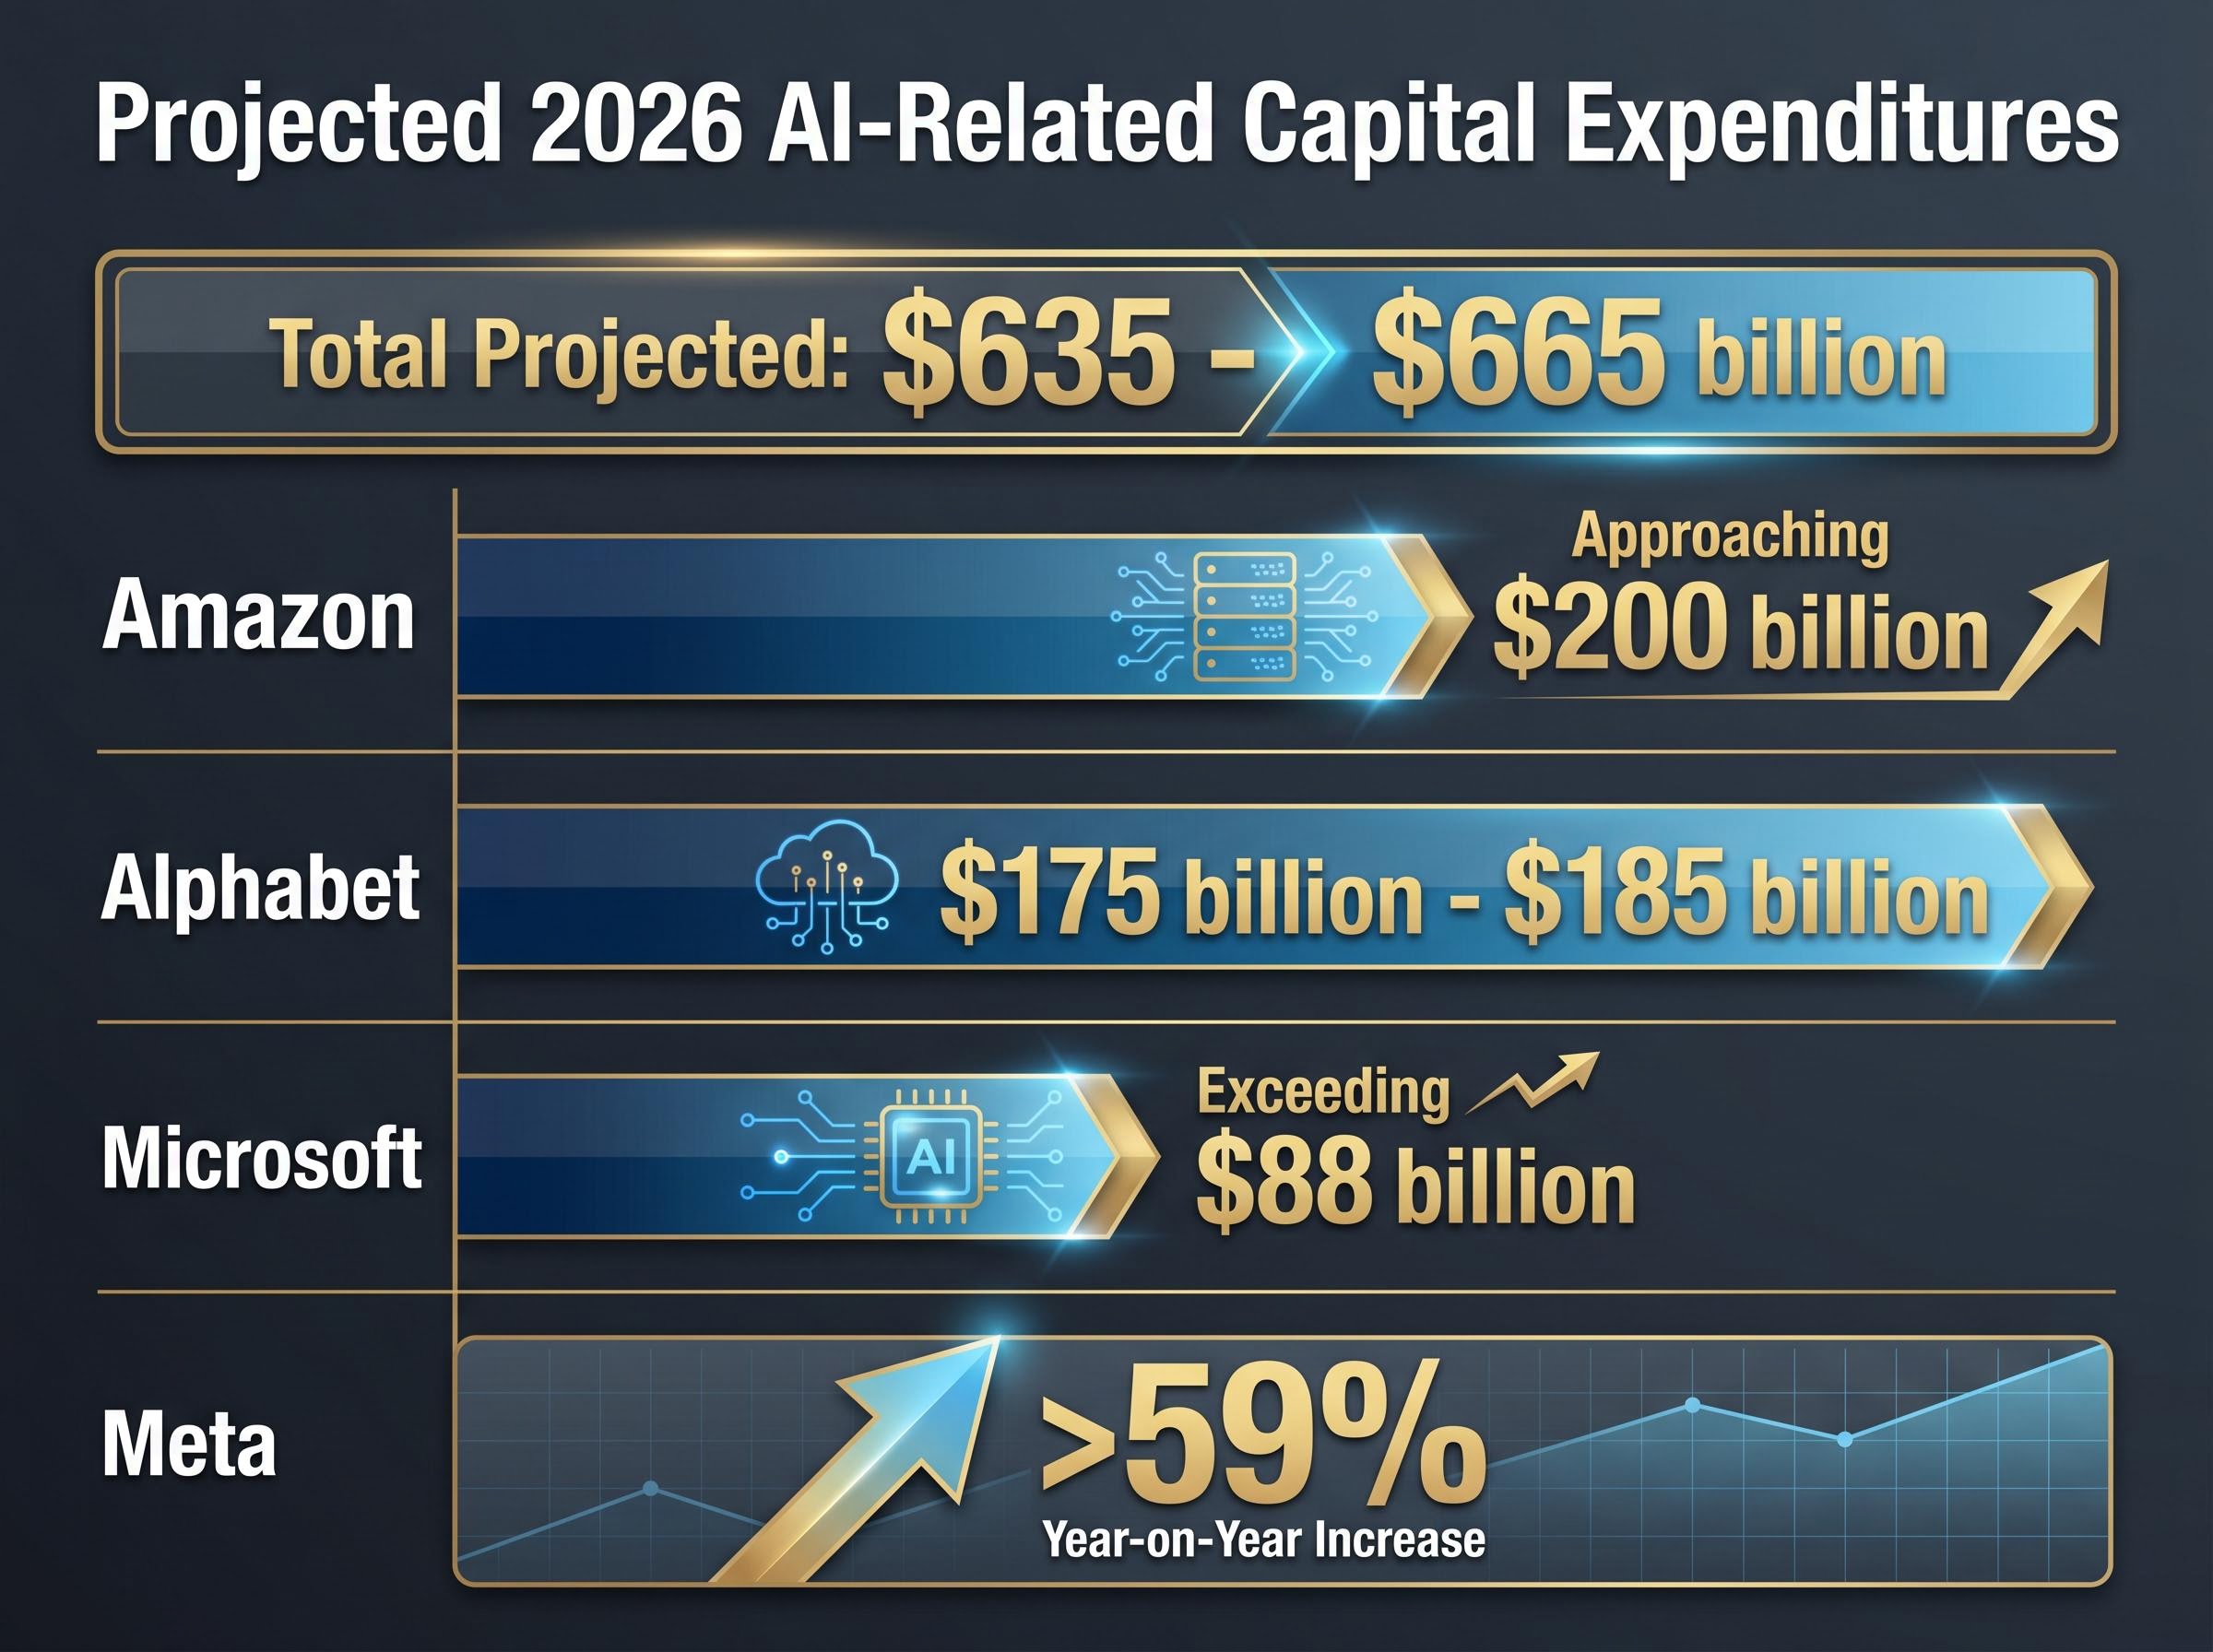
The elevated risks priced into current options premiums trace directly back to massive digital infrastructure expansion costs. Hyperscale technology companies are engaged in an unprecedented cycle of facility and hardware investment. Collective 2026 AI-related capital expenditures for Alphabet, Microsoft, Amazon, and Meta are projected at $635-$665 billion.
This monumental scale of direct corporate investment acts as the primary catalyst for semiconductor industry valuations, as hardware suppliers capture the majority of these initial expenditures long before consumer cloud monetization occurs.
The specific capital expenditure projections reveal the scale of this financial commitment:
Amazon: Approaching $200 billion in projected spending Alphabet: Reaching between $175 billion and $185 billion Microsoft: Exceeding $88 billion, continuing its growth trajectory Meta: Registering a year-on-year spending increase of at least 59%
These unprecedented capital outlays create immediate tension between current costs and required future revenue. Institutional stakeholders are demanding concrete proof of revenue generation to validate this spending within the next twelve months. This intense scrutiny justifies the market’s heightened sensitivity and the inflated premiums seen in the derivatives space.
The financial ripple effect extends well beyond the software providers. According to market data, a specialised semiconductor tracking index appreciated by roughly 40% in early 2026 and over 100% in the preceding twelve months. These hardware manufacturer valuations serve as direct proxies for infrastructure confidence, creating secondary volatility nodes throughout the technology sector.
Transitioning from a passive observer to a strategic evaluator requires pragmatic analytical steps. According to market data, derivatives markets have priced in anticipated post-disclosure equity movements ranging between 4% and 7.1% for the major technology leaders. Institutional frameworks compare this pre-earnings implied volatility directly against the market’s expected downside range.
One common institutional consideration involves utilising cash-secured puts near the market’s priced downside. Elevated implied volatility boosts the premium received for selling these contracts. This approach requires the participant to have the capital ready and the willingness to acquire shares at that specific strike price if assigned.
Holding long options through an announcement without accounting for the impending IV crush is a common portfolio error. Even if the underlying equity moves in the anticipated direction, the rapid collapse in premium value can result in a net loss on the position.
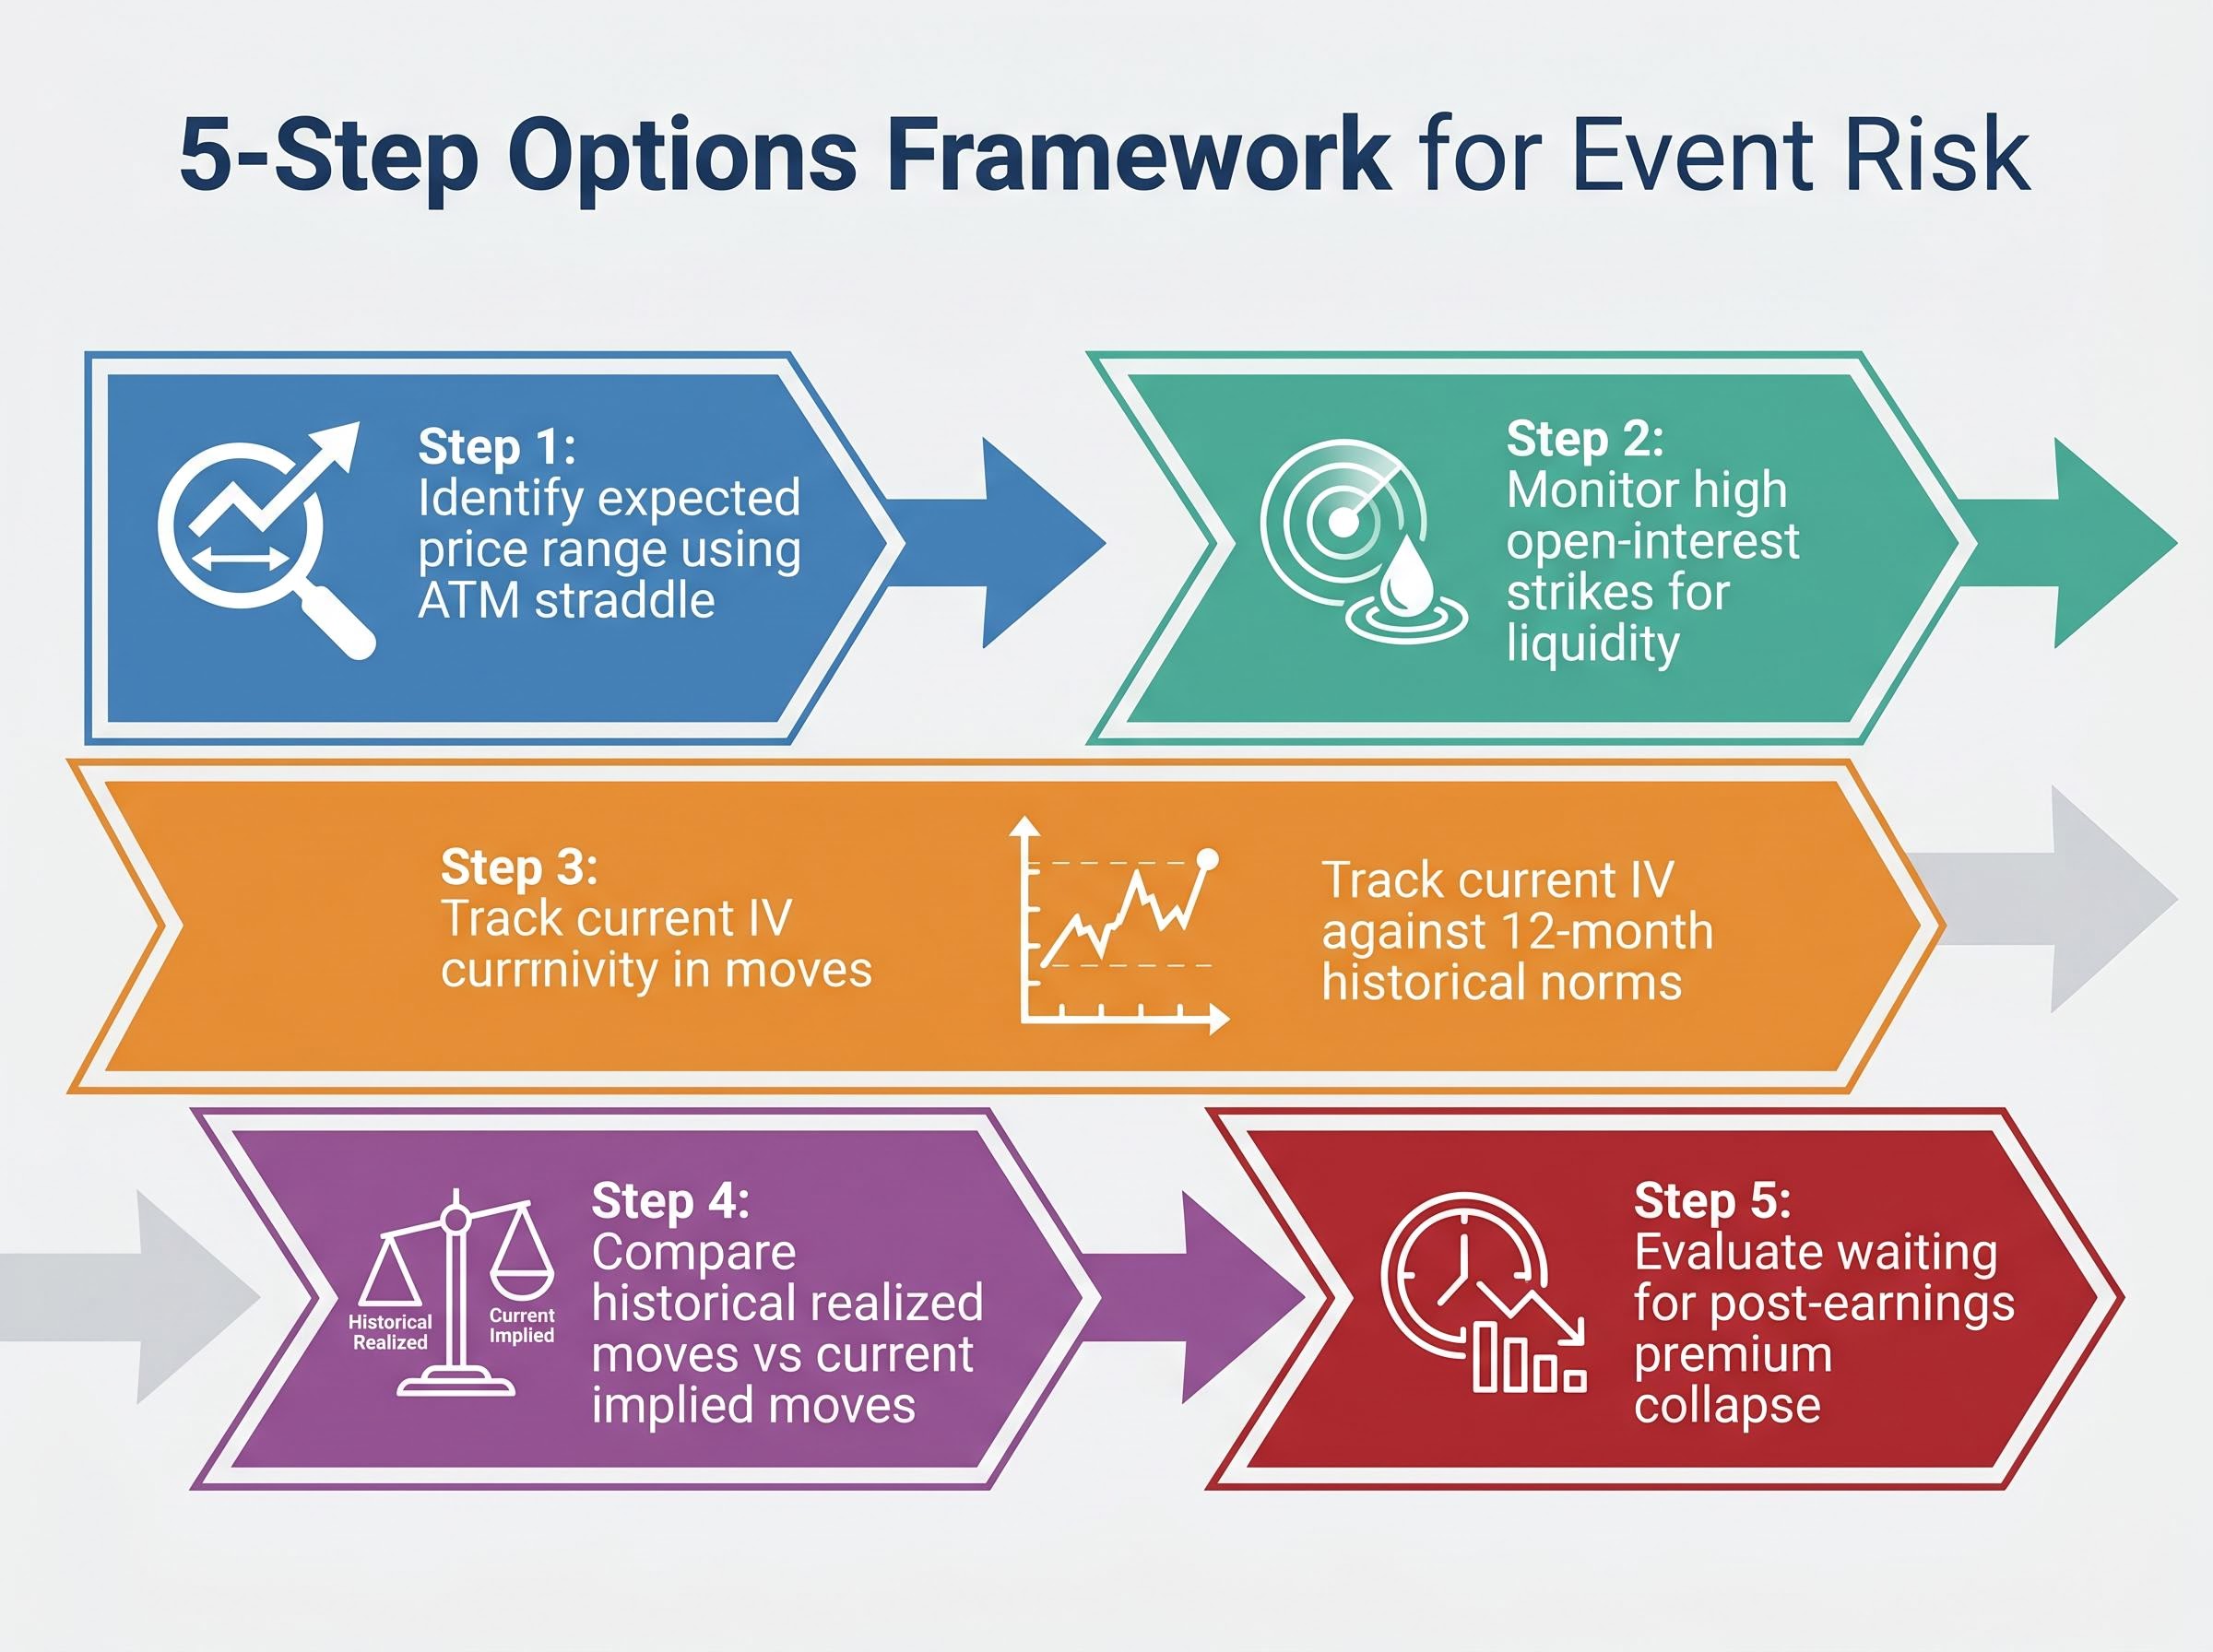
Monitoring specific metrics allows market participants to assess event risk accurately. The focus should remain on identifying where liquidity and historical patterns intersect.
Elevated implied volatility compared to historical norms acts as a clear signal for heightened event risk. Following the disclosures, this volatility typically realigns with broader index levels, revealing whether the market accurately assessed the underlying vulnerability.
Options markets offer a transparent window into institutional expectations and specific market vulnerabilities. While mega-cap earnings reliably create short-term turbulence, understanding the mechanical drivers behind this volatility provides a material strategic advantage.
Rather than viewing financial disclosures as unpredictable disruptions, participants can utilise derivatives pricing to quantify exactly what the market expects. This structural awareness is critical for navigating the remainder of the 2026 financial calendar. By tracking the relationship between massive capital expenditures and options premiums, investors can look past the immediate headline noise to focus on the metrics that dictate long-term valuations.
This objective mathematical approach proves exceptionally valuable when overlapping macroeconomic warning signals, such as sustained commodity shocks and geopolitical friction, threaten to amplify any negative post-earnings reactions.
This article is for informational purposes only and should not be considered financial advice. Investors should conduct their own research and consult with financial professionals before making investment decisions. Past performance does not guarantee future results. Financial projections and options pricing dynamics are subject to market conditions and various risk factors.
Implied volatility crush occurs when the uncertainty surrounding a corporate earnings announcement is resolved, causing the inflated time value in options premiums to collapse rapidly, often resulting in losses for long option positions.
Mega-cap tech companies like Microsoft, Alphabet, Amazon, and Meta collectively account for over 17% of the S&P 500, meaning their earnings reports and subsequent stock movements can dictate the trajectory of major US investment portfolios and the index itself.
Retail investors can identify expected price ranges using at-the-money straddles, monitor open-interest strikes, track implied volatility relative to historical norms, and compare historical average moves against current implied moves before entering positions.
Massive projected AI-related capital expenditures by hyperscale tech companies, totaling $635-$665 billion in 2026, create tension between current costs and required future revenue, leading to intense market scrutiny and heightened options premiums.