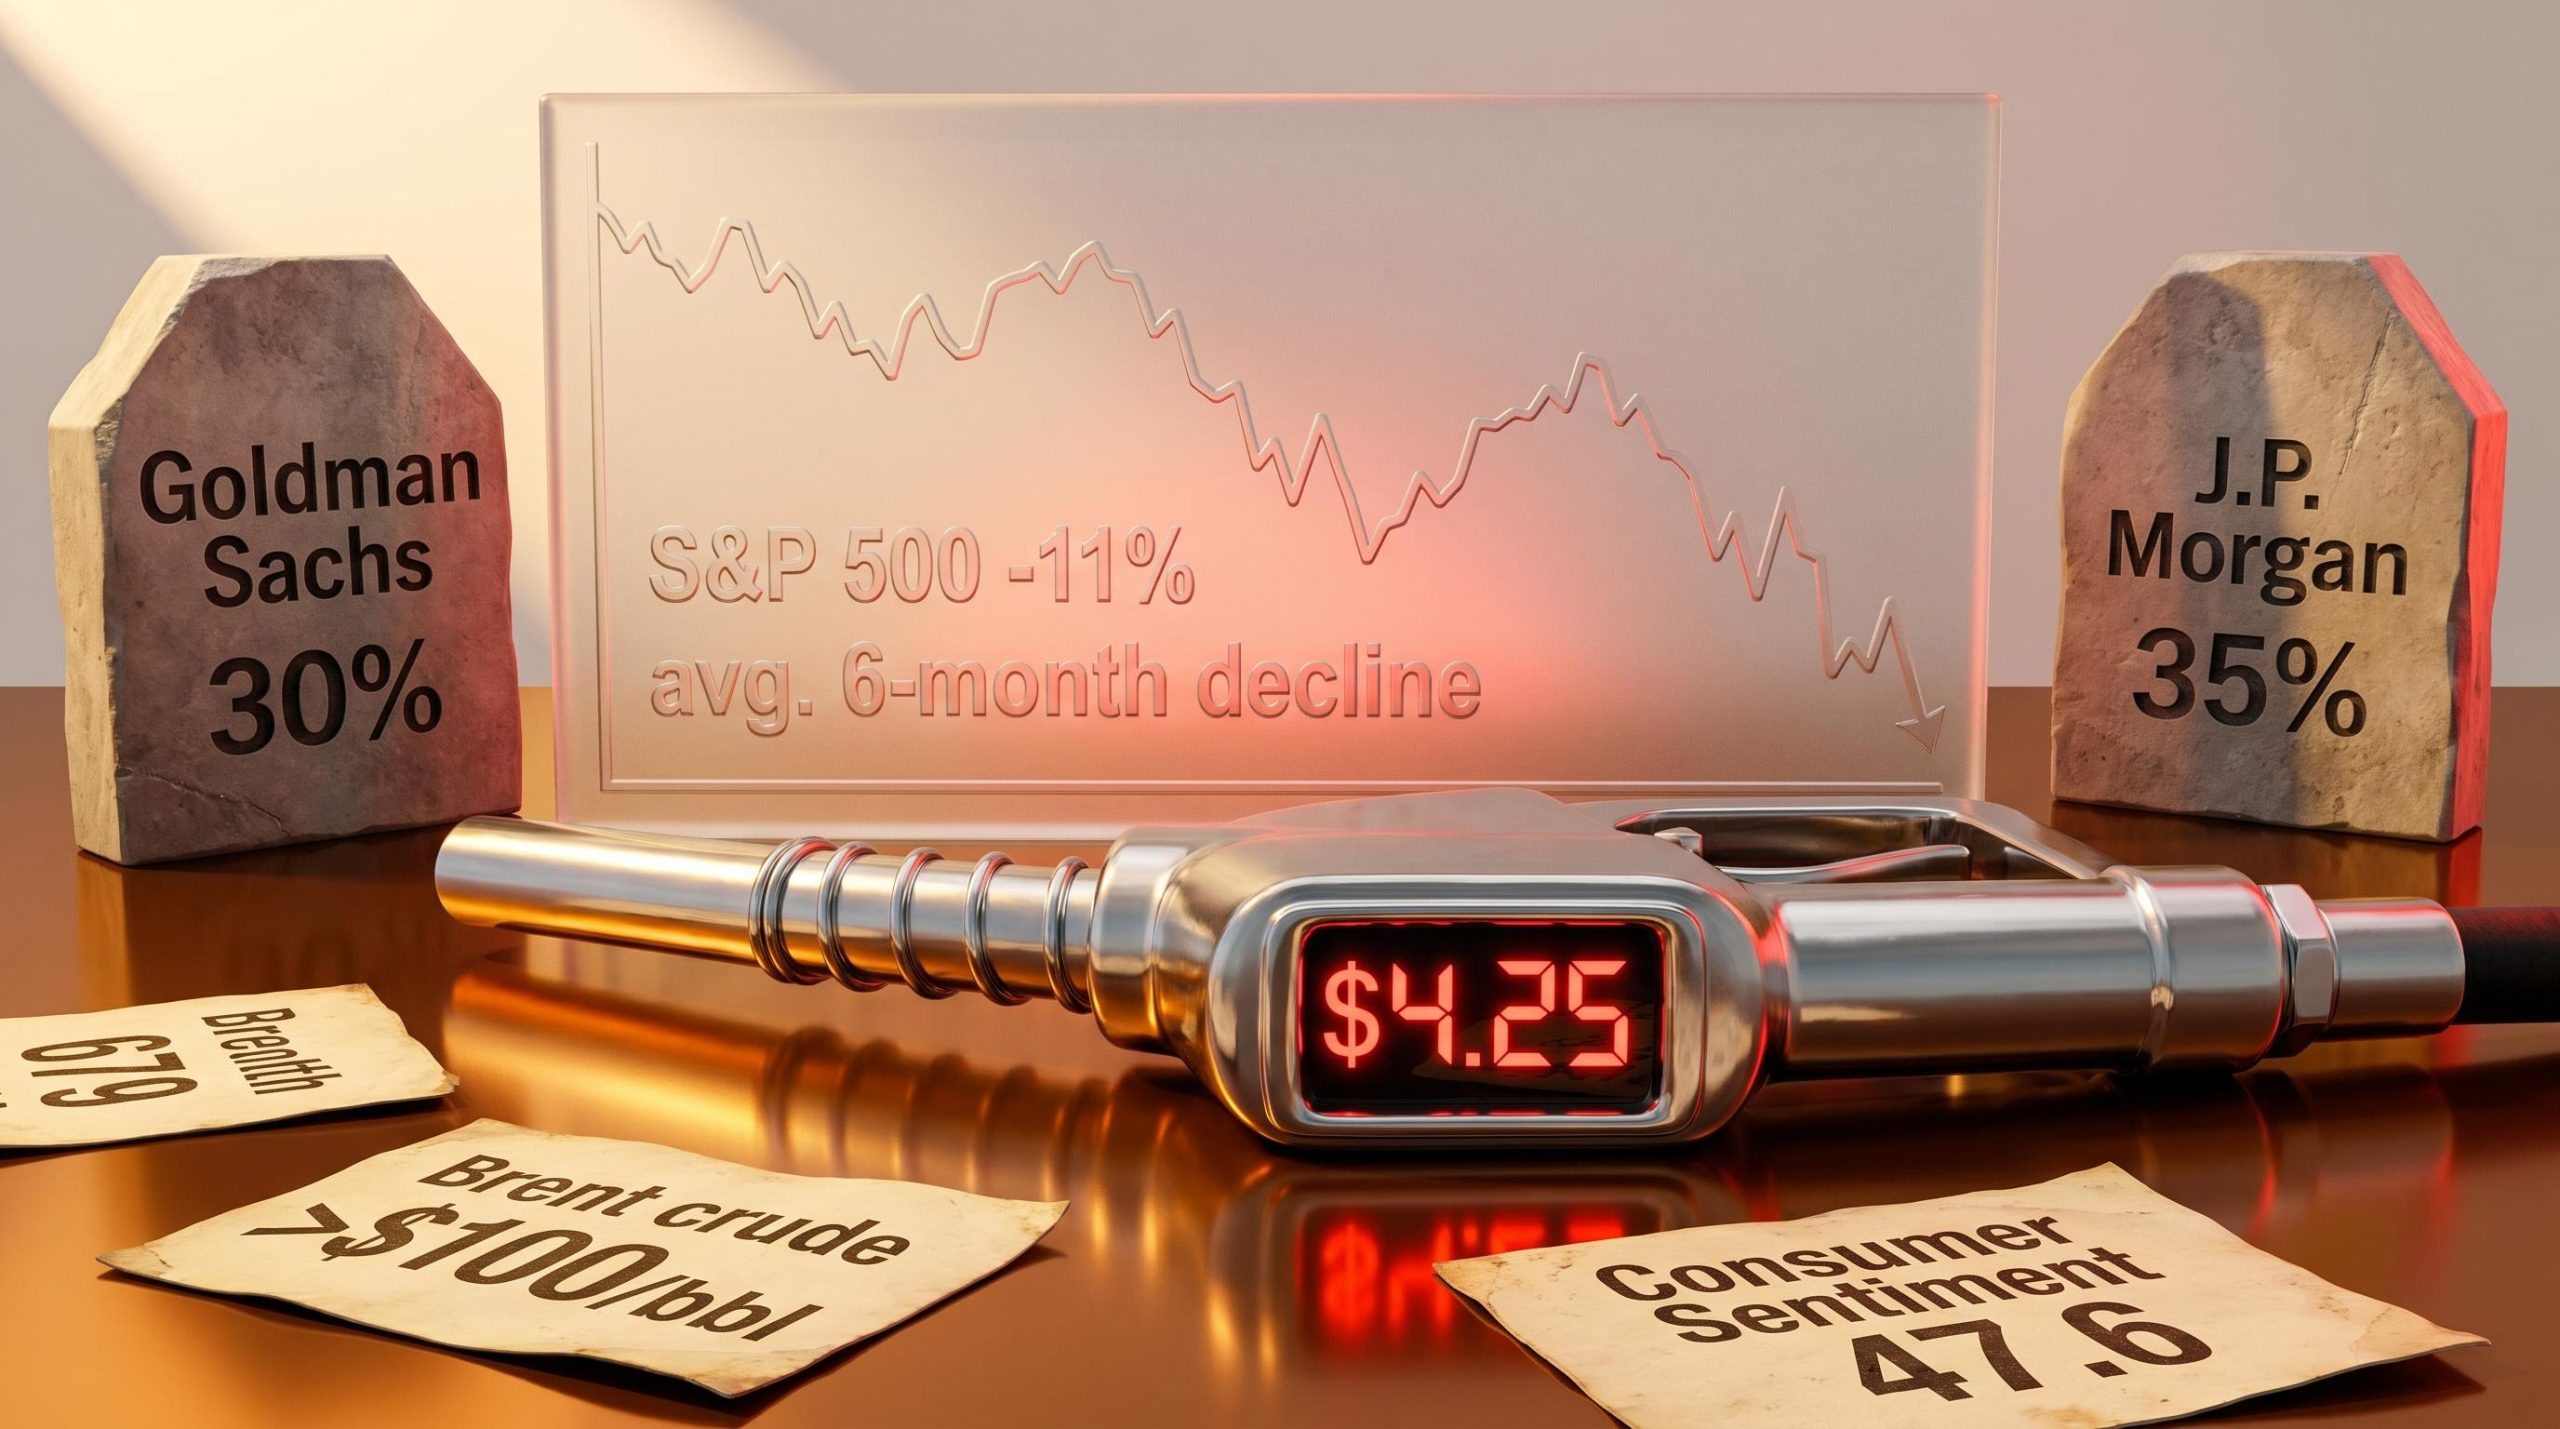
The national average gasoline price hit $4.25 per gallon in the week ending 27 April 2026, according to the U.S. Energy Information Administration (EIA). That price level has been reached in fewer than 44 weeks across the entire period from 1993 to today, a span covering more than 1,700 weekly readings. Every time prices crossed the $4.00 threshold during those rare weeks, the S&P 500 posted an average decline of approximately 11% over the following six months. With Brent crude trading above $100 per barrel due to the Strait of Hormuz closure, recession probability estimates sitting at 30-35% from Goldman Sachs and J.P. Morgan, and consumer sentiment at a record low of 47.6, the conditions surrounding this price spike carry weight beyond the historical pattern alone.
What follows is an examination of the documented relationship between $4.00-plus gasoline and equity returns, the economic transmission mechanism that connects pump prices to portfolio performance, and the current recession risk signals that determine whether the historical average correction or something considerably worse is the more relevant scenario for U.S. investors.
A price signal that has almost never appeared, and what it has meant for stocks
Since 1993, the U.S. national average gasoline price has traded above $4.00 per gallon in just 44 weeks. That represents under 3% of the roughly 1,700 weekly price observations in the EIA’s dataset. The current reading of $4.25, which reflects a 45% increase since the start of 2026, sits at levels last reached in August 2022.
The rarity is itself informative. When a price signal appears in fewer than one out of every thirty observations across three decades, its historical association with equity returns carries statistical weight even with the limited sample size.
The EIA weekly retail gasoline price data, which covers more than 1,700 consecutive weekly observations since 1993, confirms that the current $4.25 reading belongs to a cohort of fewer than 44 weeks in the entire series, placing it in the rarest 3% of all price outcomes recorded across three decades.
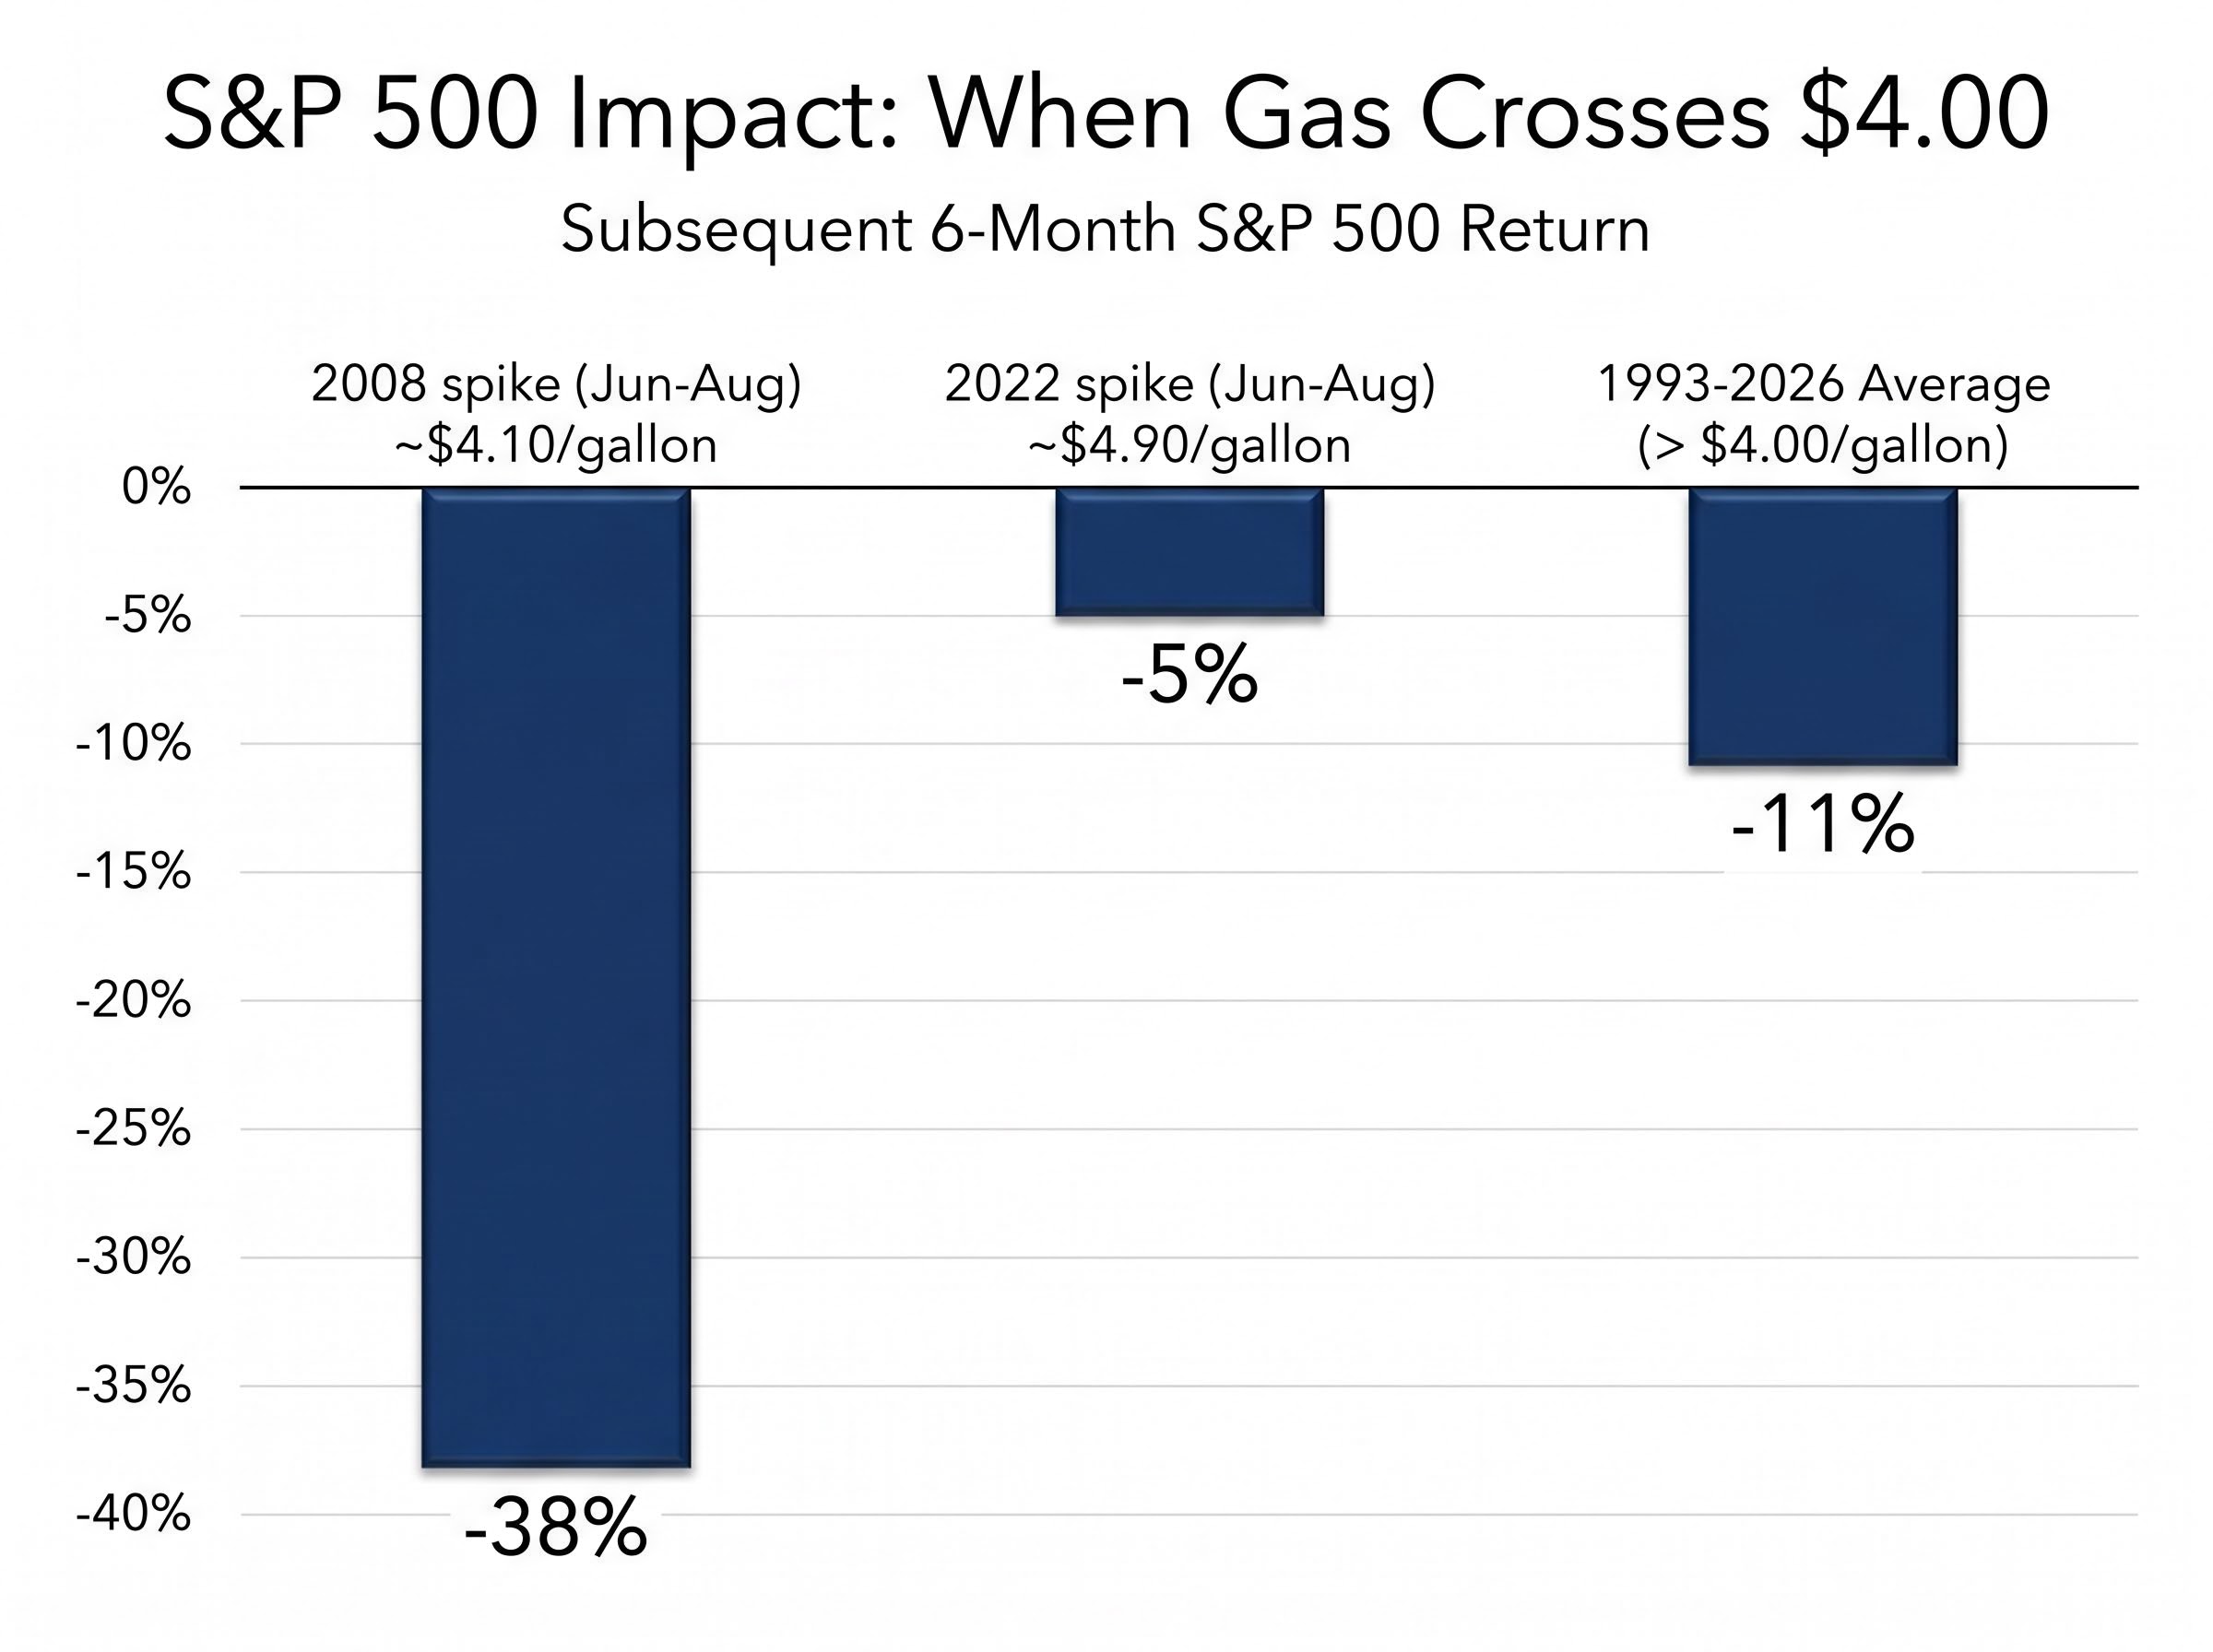
During the 44 weeks in which gasoline exceeded $4.00 per gallon since 1993, the S&P 500 averaged an approximately 11% decline over the subsequent six months.
That figure is an observed historical pattern, not a forward prediction. Context matters: the 2008 spike occurred alongside a financial crisis, while the 2022 spike unfolded during an aggressive Federal Reserve tightening cycle. Still, the consistency of the directional signal across different macro backdrops is difficult to dismiss.
| Time Period | Avg. Gasoline Price | Subsequent 6-Month S&P 500 Return |
|---|---|---|
| 2008 spike (Jun-Aug) | ~$4.10/gallon | Approx. -38% |
| 2022 spike (Jun-Aug) | ~$4.90/gallon | Approx. -5% |
| All 44 weeks above $4.00 (1993-2026) | >$4.00/gallon | Approx. -11% (average) |
The range of outcomes around that -11% average is wide. That variation is precisely why the current macro overlay matters.
Three decades of EIA data on high gas prices and stock returns show that sustained episodes above $4.00 have historically been associated with peak-to-trough bear market declines averaging 41%, a figure considerably worse than the six-month average of 11% and one that becomes relevant if the current spike proves durable rather than transitory.
When big ASX news breaks, our subscribers know first
Why pump prices hit portfolios: the consumer spending transmission channel
The relationship between gasoline prices and equity performance is not a mysterious coincidence. It follows a traceable economic path, and each step in that path is visible in current data.
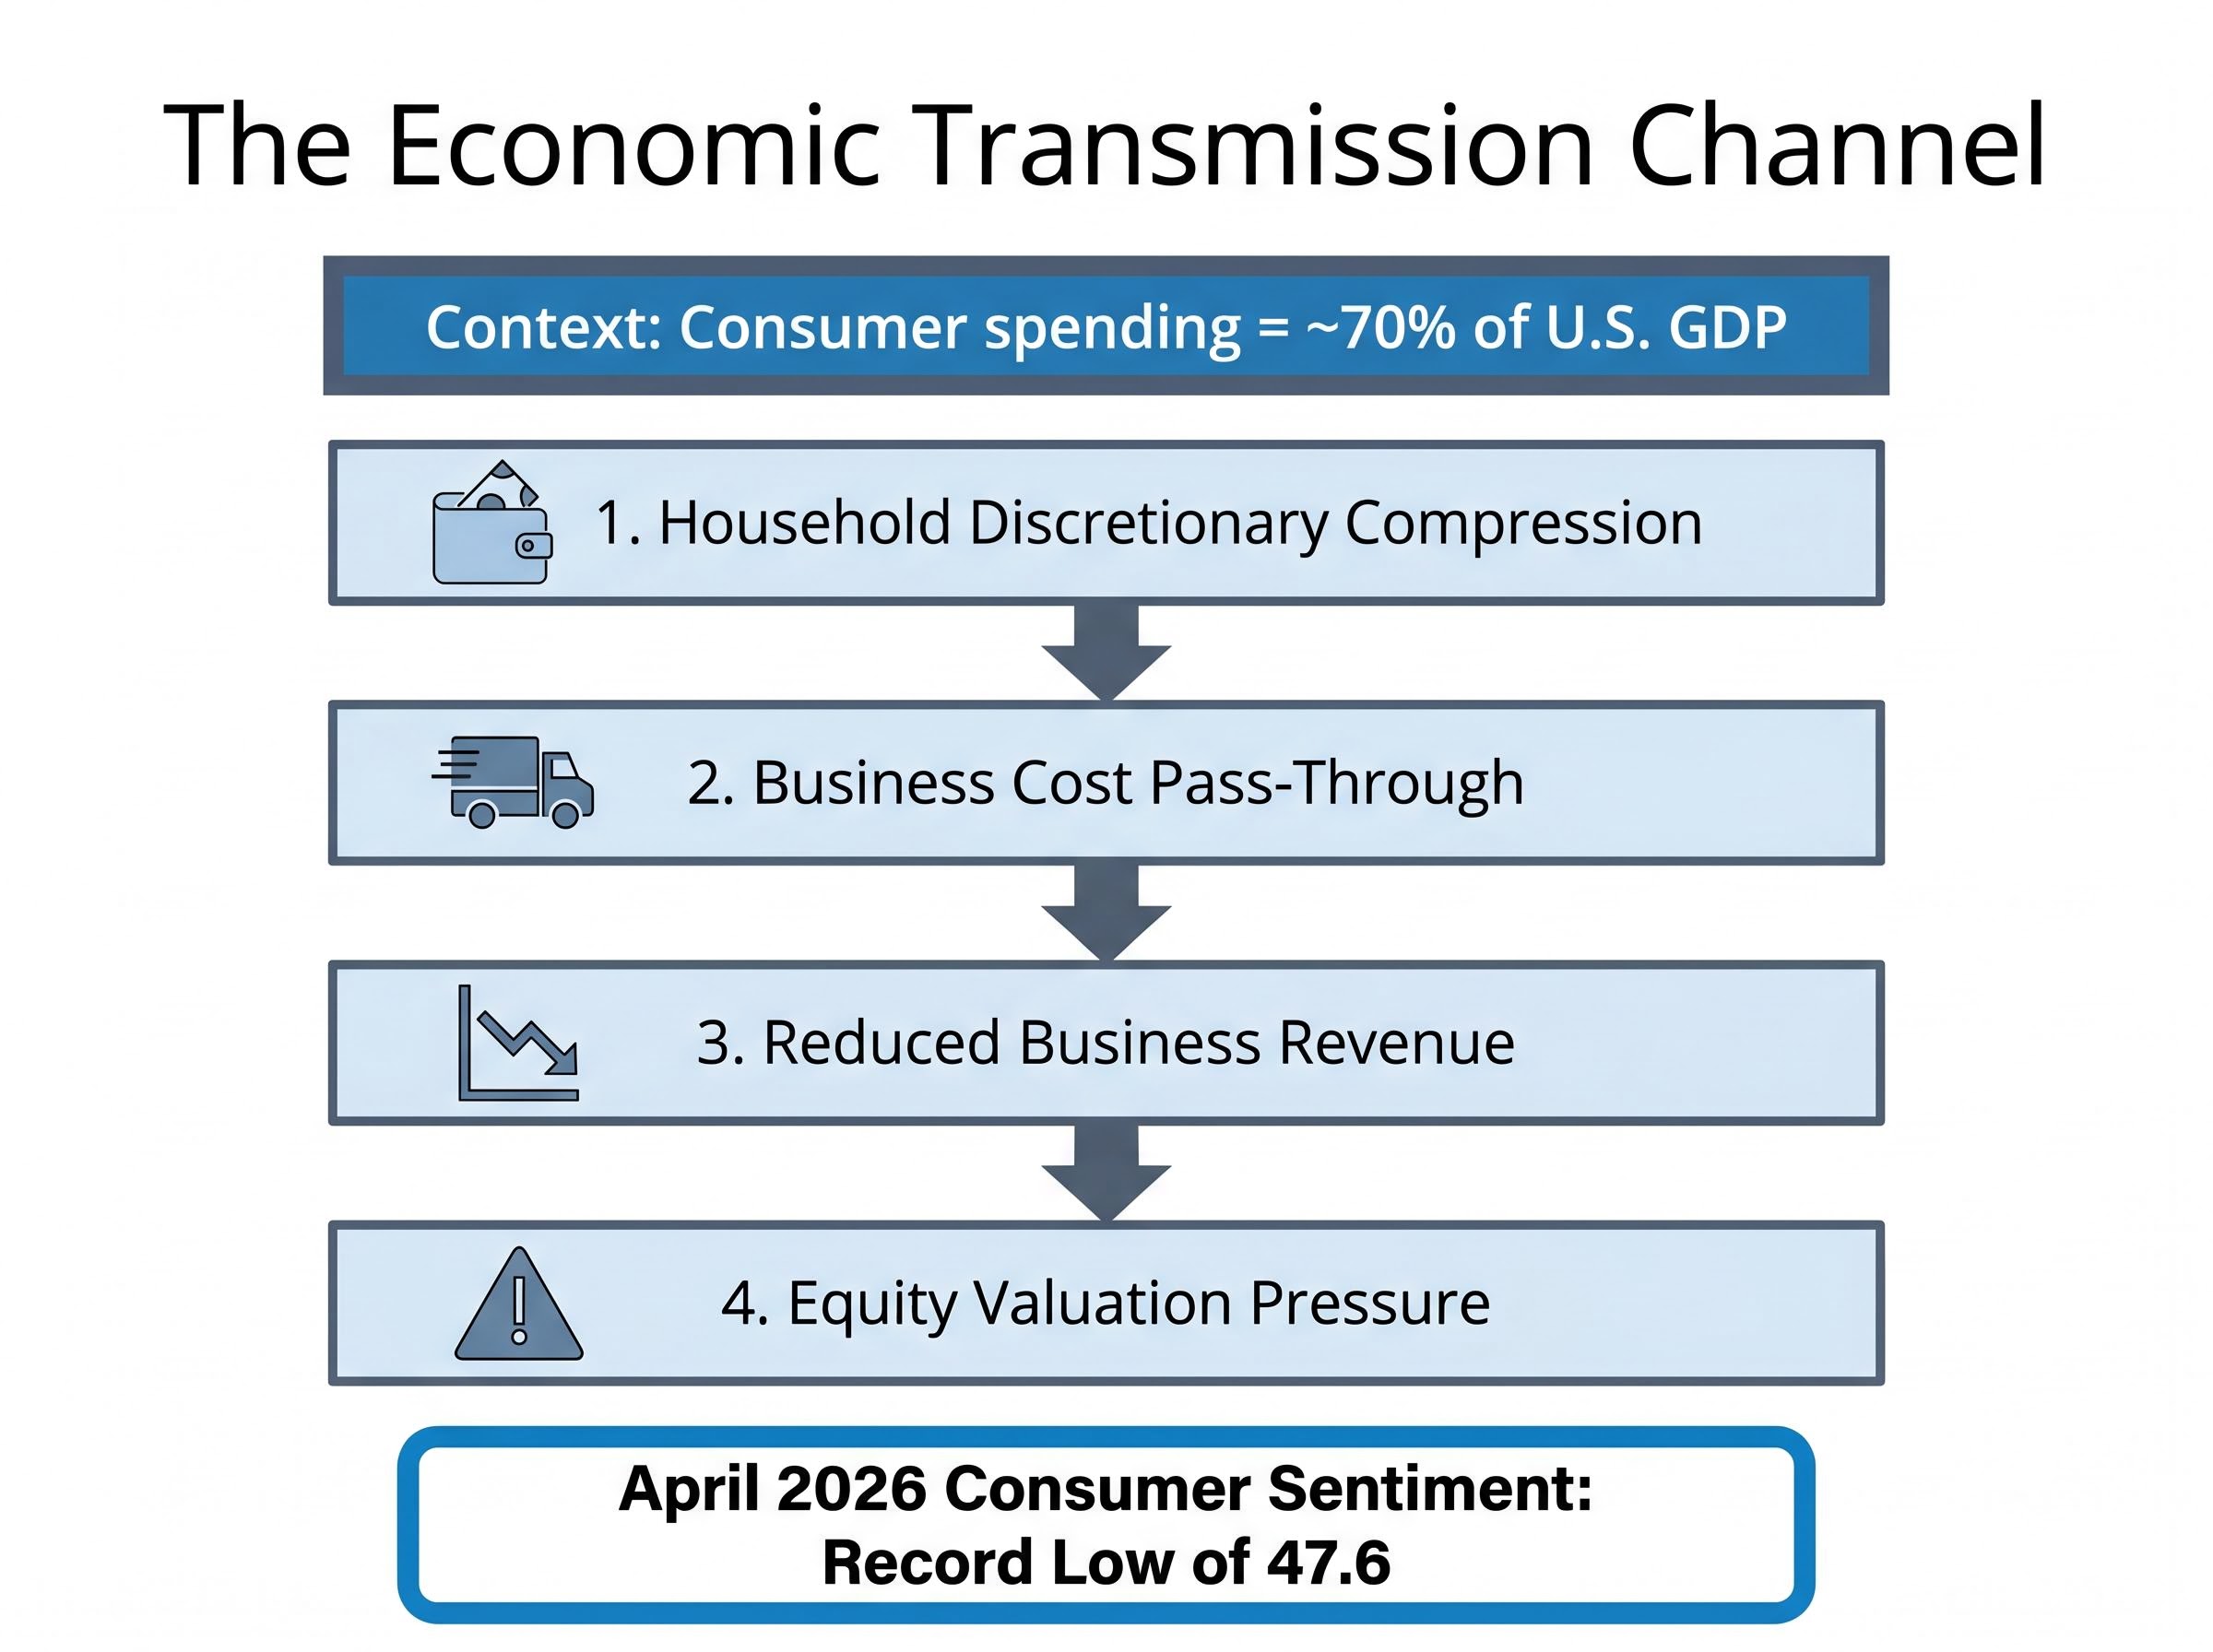
Consumer spending constitutes approximately 70% of U.S. GDP. When household purchasing power is compressed by a sustained increase in a non-discretionary expense, the macroeconomic drag is direct and measurable.
AEA research on gasoline prices and consumer spending quantifies what the transmission mechanism implies in practice: households exhibit a high marginal propensity to spend gasoline savings, meaning the reverse is equally true, and sustained price increases at the pump produce measurable, near-immediate contractions in broader discretionary expenditure.
The transmission operates through two channels simultaneously:
- Household discretionary compression: Every dollar spent at the pump is a dollar unavailable for retail, dining, travel, or other consumer purchases. At $4.25 per gallon, lower-income households face a disproportionate burden because fuel costs represent a larger share of their total spending.
- Business cost pass-through: Elevated transportation and input costs force businesses to either absorb margin compression or raise consumer prices further, creating a feedback loop that compounds the spending squeeze.
- Reduced business revenue: As households pull back discretionary spending, companies in consumer-facing sectors report weaker sales, which feeds directly into earnings guidance.
- Equity valuation pressure: Lower forward earnings expectations translate into downward revisions to stock price targets across affected sectors.
The sentiment evidence
The April 2026 U.S. consumer sentiment reading of 47.6, a record low, is not a lagging indicator in this context. It is evidence that the transmission mechanism is already active. Consumers are reporting that they feel the cost pressure, and historically, sentiment at these levels has preceded measurable reductions in retail spending.
What is driving the current price spike, and why it may not resolve quickly
Brent crude has risen from approximately $65 per barrel at the start of 2026 to above $100 per barrel in April, a gain of more than 50%. The driver is not seasonal demand or a refinery bottleneck. It is a structural supply disruption with no clear resolution timeline.
The Strait of Hormuz, through which roughly 20% of the world’s petroleum passes daily, has been closed to foreign shipping. The U.S. has imposed a naval blockade, and Iran’s proposal to reopen the strait was rejected by the U.S. as of late April 2026. The diplomatic pathway remains blocked.
Three structural constraints prevent rapid price normalisation even if a ceasefire were announced tomorrow:
- Transit route closure: The Strait of Hormuz remains closed, and no alternative shipping route can absorb the displaced volume at equivalent cost.
- Infrastructure damage: Physical damage to production and storage facilities in the region means output capacity cannot recover quickly.
- Production curtailment and slow recovery: Restarting mothballed production takes months, not weeks, creating a lag between any diplomatic breakthrough and actual supply relief.
Morgan Stanley analyst Martijn Rats has outlined two scenarios: a best-case average of $80-$90 per barrel for 2026, and an escalation scenario of $150-$180 per barrel if the Strait remains closed for several months.
The distance between those two projections captures the uncertainty investors are pricing. The current $100-plus environment may be closer to a floor than a ceiling.
Recession risk: the scenario where an 11% pullback becomes a 32% collapse
The 11% average decline following $4.00-plus gasoline captures the energy-price signal in isolation. A recession would shift the analysis into a different risk category entirely.
Since the S&P 500’s inception in 1957, the index has declined by an average of 32% during U.S. recessions.
That is not a modest correction. It is a portfolio event that takes years to recover from for investors who are fully exposed at the onset.
The institutional recession probability estimates for 2026 are not fringe forecasts. Goldman Sachs places the probability at 30%. J.P. Morgan places it at 35%. These reflect the assessments of two of the largest research operations in global finance, and both cite elevated energy costs as a central contributing factor.
Economist Mark Zandi has framed the risk in structural terms: even a rapid de-escalation of the Iran conflict would leave lasting economic damage. GDP recovery and meaningful employment growth are unlikely to materialise for the remainder of the year under even a best-case conflict resolution scenario.
| Scenario | Trigger Condition | Historical Avg. S&P 500 Impact |
|---|---|---|
| Elevated gas prices only | Gasoline above $4.00/gallon, no recession | Approx. -11% over 6 months |
| U.S. recession | Formal economic contraction | Approx. -32% (since 1957) |
| Recession plus energy shock | Both conditions present simultaneously | Historically at the severe end of the -32% range |
The gap between -11% and -32% is the central risk-sizing question for equity investors. The institutional probability estimates suggest the more severe scenario is not a tail risk but a live possibility being actively modelled by sophisticated market participants.
For investors wanting to examine the transmission mechanism in greater structural depth, our full explainer on oil price surge and recession risk traces all four channels from reduced consumer disposable income through Federal Reserve rate pressure to investment and hiring pullback, and documents the historical pattern in which every major U.S. recession since 1973 was preceded by an oil shock with the same structural fingerprint visible in 2026.
The split market: why tech’s resilience does not tell the full story
The S&P 500 gained approximately 5.5% through 24 April 2026, closing at 7,165.08. That monthly performance, combined with strong technology sector earnings, has created a surface narrative of market resilience.
The surface is misleading.
Technology and AI-driven sectors are the primary drivers of that recovery. The tech sector posted projected Q1 2026 growth of approximately 12.6%, with individual high-growth names delivering gains of 15-58%. These companies carry relatively low direct energy cost exposure, and their earnings trajectory is being shaped by AI adoption cycles rather than fuel prices.
Sectors with different cost structures face a different reality:
- Relatively insulated: Technology, AI-adjacent software, cloud infrastructure
- Elevated exposure: Transportation, consumer discretionary, retail, airlines, logistics
The S&P 500 fell approximately 9% from its March 2026 peak as the Iran conflict pushed energy prices higher. The subsequent recovery occurred while every geopolitical and energy driver that caused the selloff remained unresolved. That pattern raises a question the headline index number does not answer: is the recovery durable, or has it been carried by a narrow cohort of large-cap tech names whose weightings can move the index independently of broader economic conditions?
What the headline index conceals
The S&P 500’s market-capitalisation-weighted structure means a small number of mega-cap technology companies can carry the index higher even as a meaningful proportion of constituent companies face margin compression from elevated energy costs.
During the earlier stress period, investor flight to Treasuries and money market funds provided evidence that risk-off behaviour was real beneath the surface. Consumer sentiment at a record low of 47.6 sits in direct tension with the tech-led optimism narrative. Investors interpreting the index-level recovery as an all-clear signal may be underweighting the sector-specific risk concentration that the rebound reflects.
The weight of the evidence, and what it means for investors watching the pump
Three risk signals are operating simultaneously: the historical $4.00-plus gasoline correlation with equity declines, a structural supply disruption with no visible resolution timeline, and institutional recession probability estimates that place the odds of a contraction at roughly one in three.
Those signals point to a range rather than a single outcome.
- Base case (elevated gas prices without recession): The historical pattern suggests an average S&P 500 decline of approximately 11% over six months following sustained gasoline prices above $4.00. This scenario assumes the economy absorbs the energy cost shock without tipping into contraction.
- Adverse case (recession materialises): If the energy shock contributes to a formal recession, the historical average S&P 500 decline widens to approximately 32%, a qualitatively different portfolio event.
The S&P 500’s recent 5.5% monthly gain and close at 7,165 demonstrate that the market has not priced in the adverse scenario. That resilience could reflect justified confidence in tech earnings durability, or it could reflect a narrow rally masking broader vulnerability.
Pump prices are not a standalone market-timing tool. They are a macro monitoring signal that, at the $4.00 threshold, has historically spoken with unusual consistency. Used alongside traditional indicators, including the recession probability estimates from Goldman Sachs and J.P. Morgan, they give investors a data-grounded framework for sizing their equity exposure rather than reacting to headlines.
Gas prices at $4.25 are not just a cost of living story; they are a portfolio risk signal
$4.25 per gallon gasoline occupies a specific position in the historical record. It sits within the rarest 3% of weekly price observations since 1993, a threshold that has been followed, on average, by an 11% decline in the S&P 500 over six months.
The counter-narrative is visible. The S&P 500 trades at 7,165 as of 24 April 2026, near multi-year highs. Technology earnings are strong. The index has recovered from its 9% March drawdown. These facts are real, but prior recoveries during unresolved energy shocks have sometimes preceded further declines rather than signalling durable bottoms.
The two metrics that matter are the 11% average post-$4.00 correction and the 32% average recessionary contraction. Together, they define a historically grounded risk range. Investors who understand both numbers, and the 30-35% institutional recession probability estimates that determine which end of that range is more likely, are positioned to make deliberate allocation decisions rather than reactive ones.
This article is for informational purposes only and should not be considered financial advice. Investors should conduct their own research and consult with financial professionals before making investment decisions. Past performance does not guarantee future results. Financial projections are subject to market conditions and various risk factors.