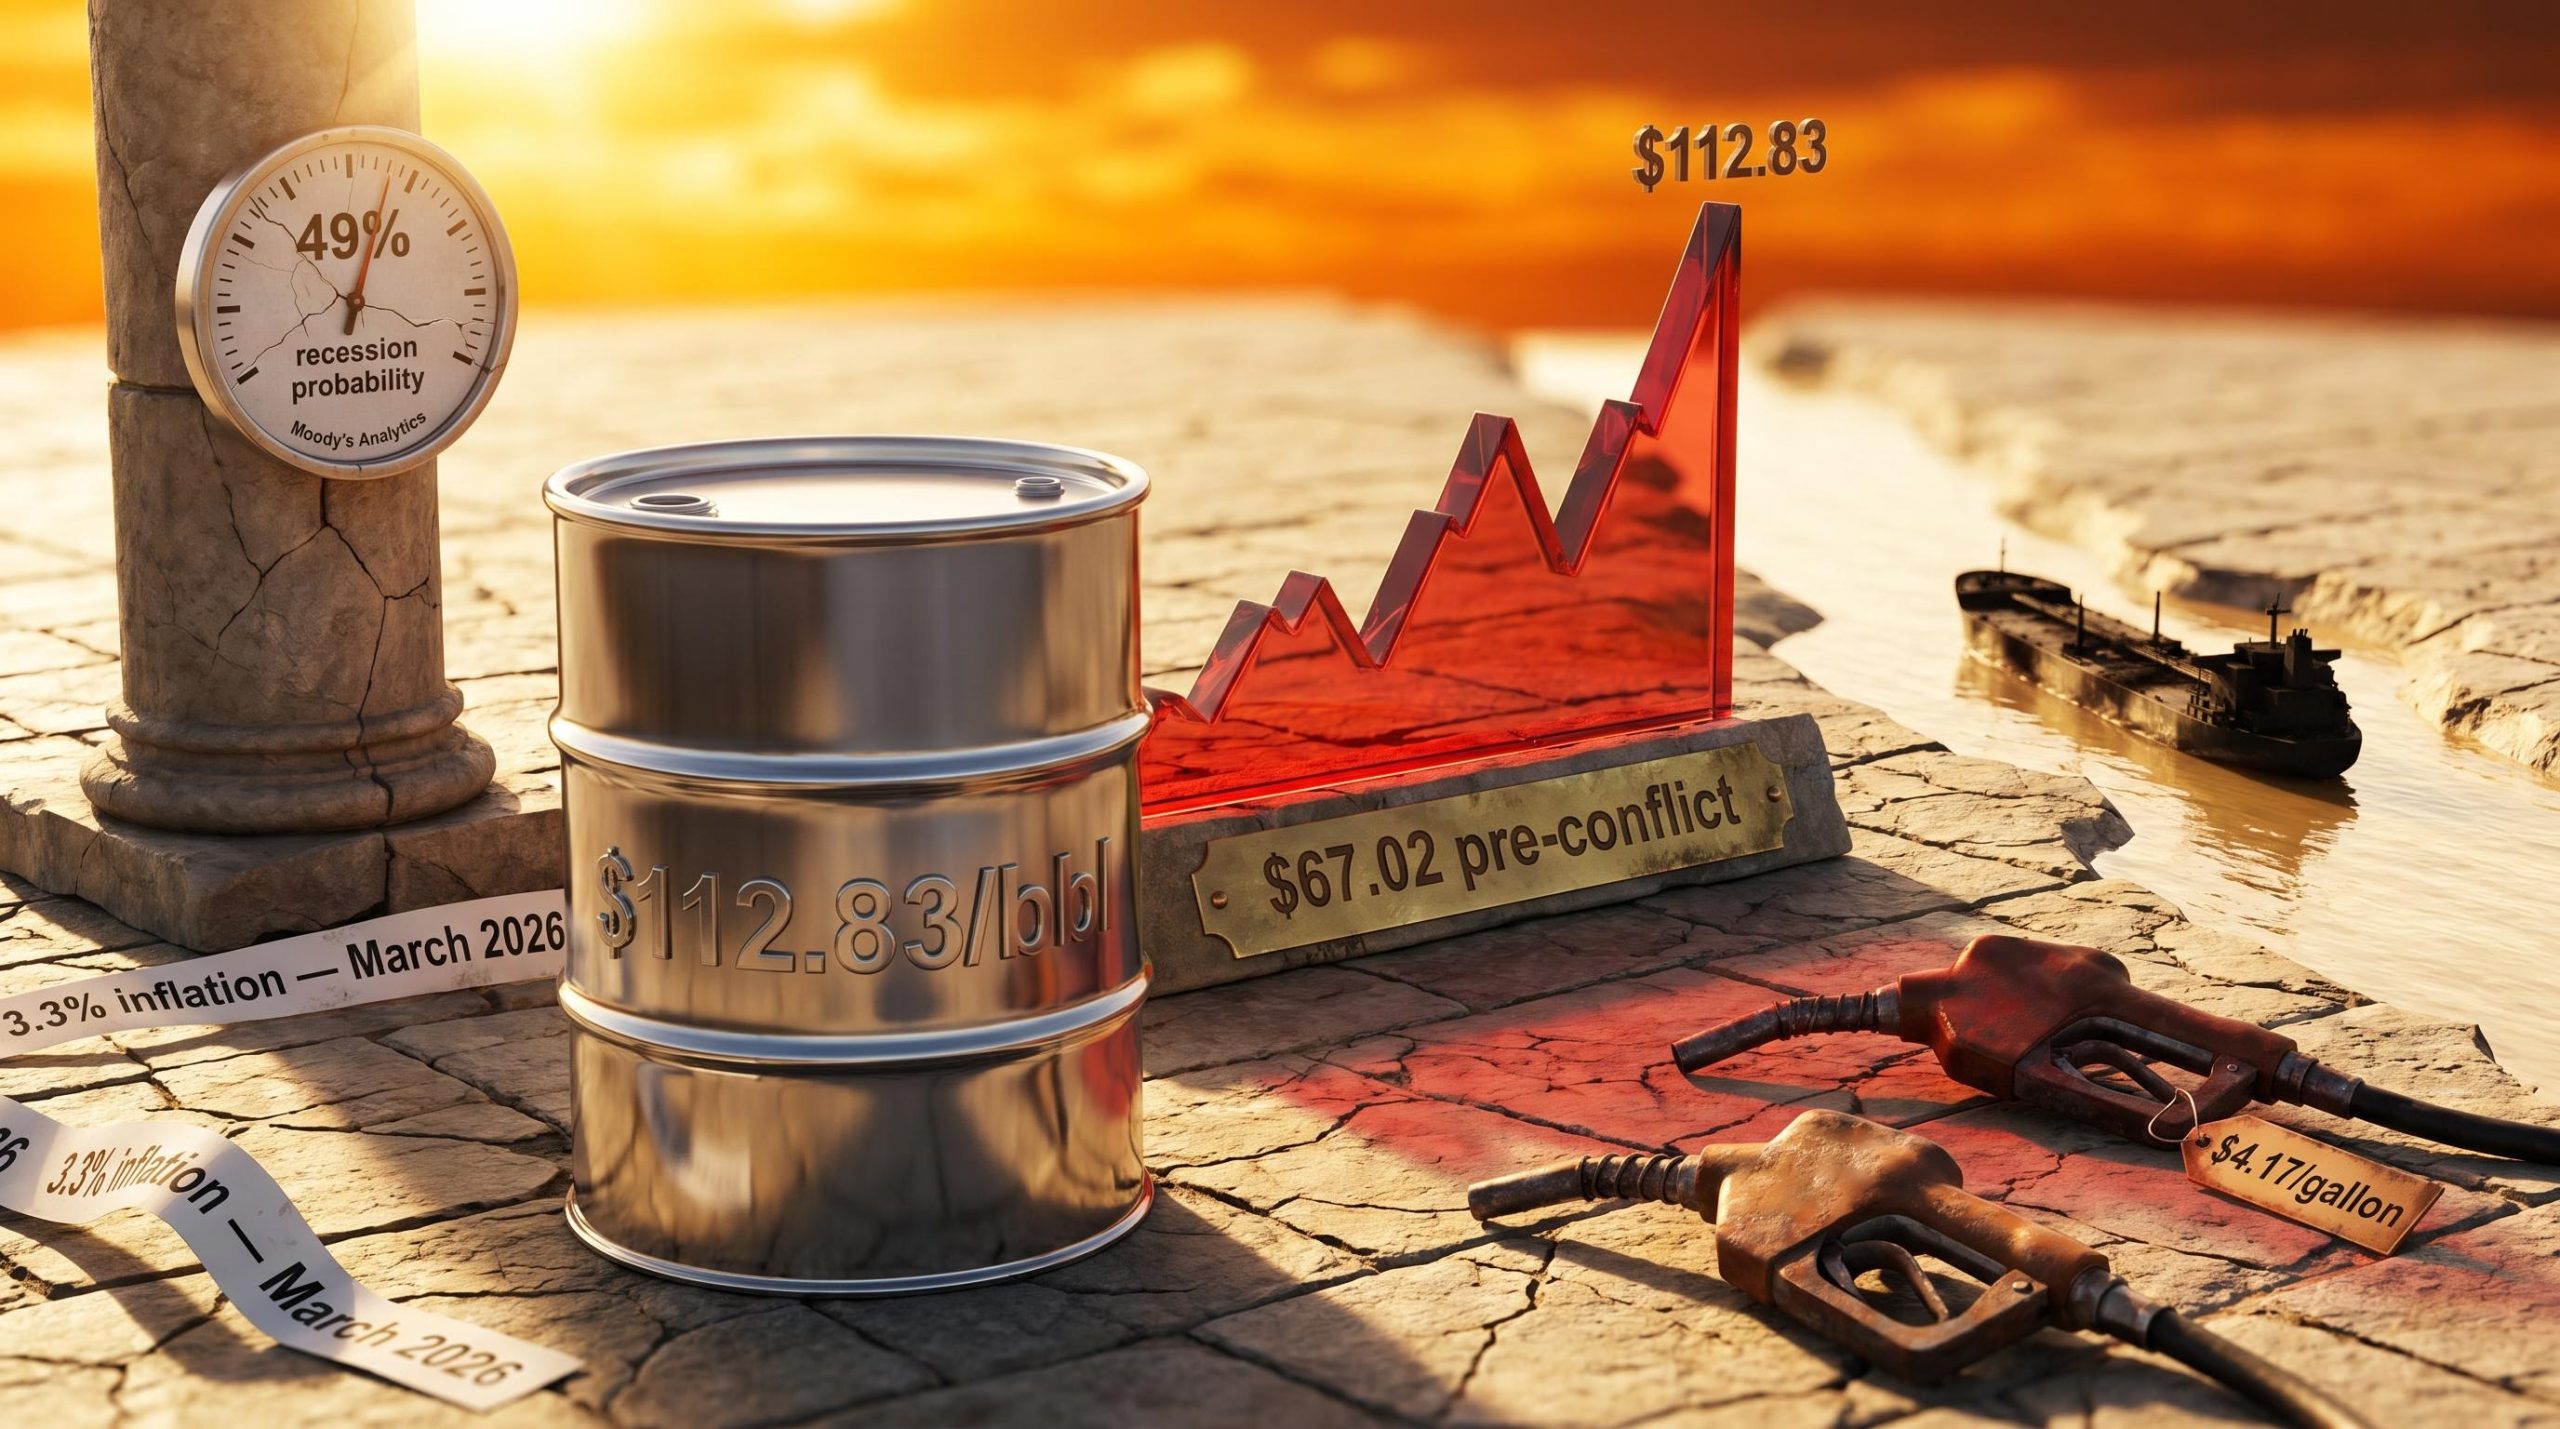
Sixty-one days into a war that has removed roughly 600 million barrels of oil from global markets, Brent crude is trading at $112.83 per barrel and the probability of a US recession sits, by one leading estimate, at nearly 49%. The closure of the Strait of Hormuz following the outbreak of the US-Israel-Iran conflict on 28 February 2026 has triggered the most significant energy shock since 2022. Prices have climbed 68% from pre-conflict levels, inflation has reignited, and the Federal Reserve’s expected rate-cut cycle has been effectively eliminated.
Iran presented a ceasefire proposal on 27 April, but no deal has been reached. Analysts warn that even a swift resolution would not reverse the economic damage already accumulated. What follows maps the transmission path from the Strait of Hormuz to Wall Street, explains what the diverging institutional recession forecasts actually reflect, and identifies the specific price thresholds and market signals that warrant close attention now.
How a single chokepoint became America’s biggest macro risk
The Strait of Hormuz is a narrow waterway between Iran and Oman that handles approximately 20% of global crude oil and natural gas flows. When that corridor closes, one-fifth of the world’s energy supply does not simply reroute. It disappears.
The conflict that began on 28 February 2026 did not merely restrict the strait; it damaged the infrastructure around it. Storage constraints have forced production cuts across the region, and analysts estimate it could take up to six months to fully clear the waterway for commercial shipping even after an agreement is struck. This is not a logistical inconvenience. It is a structural supply removal.
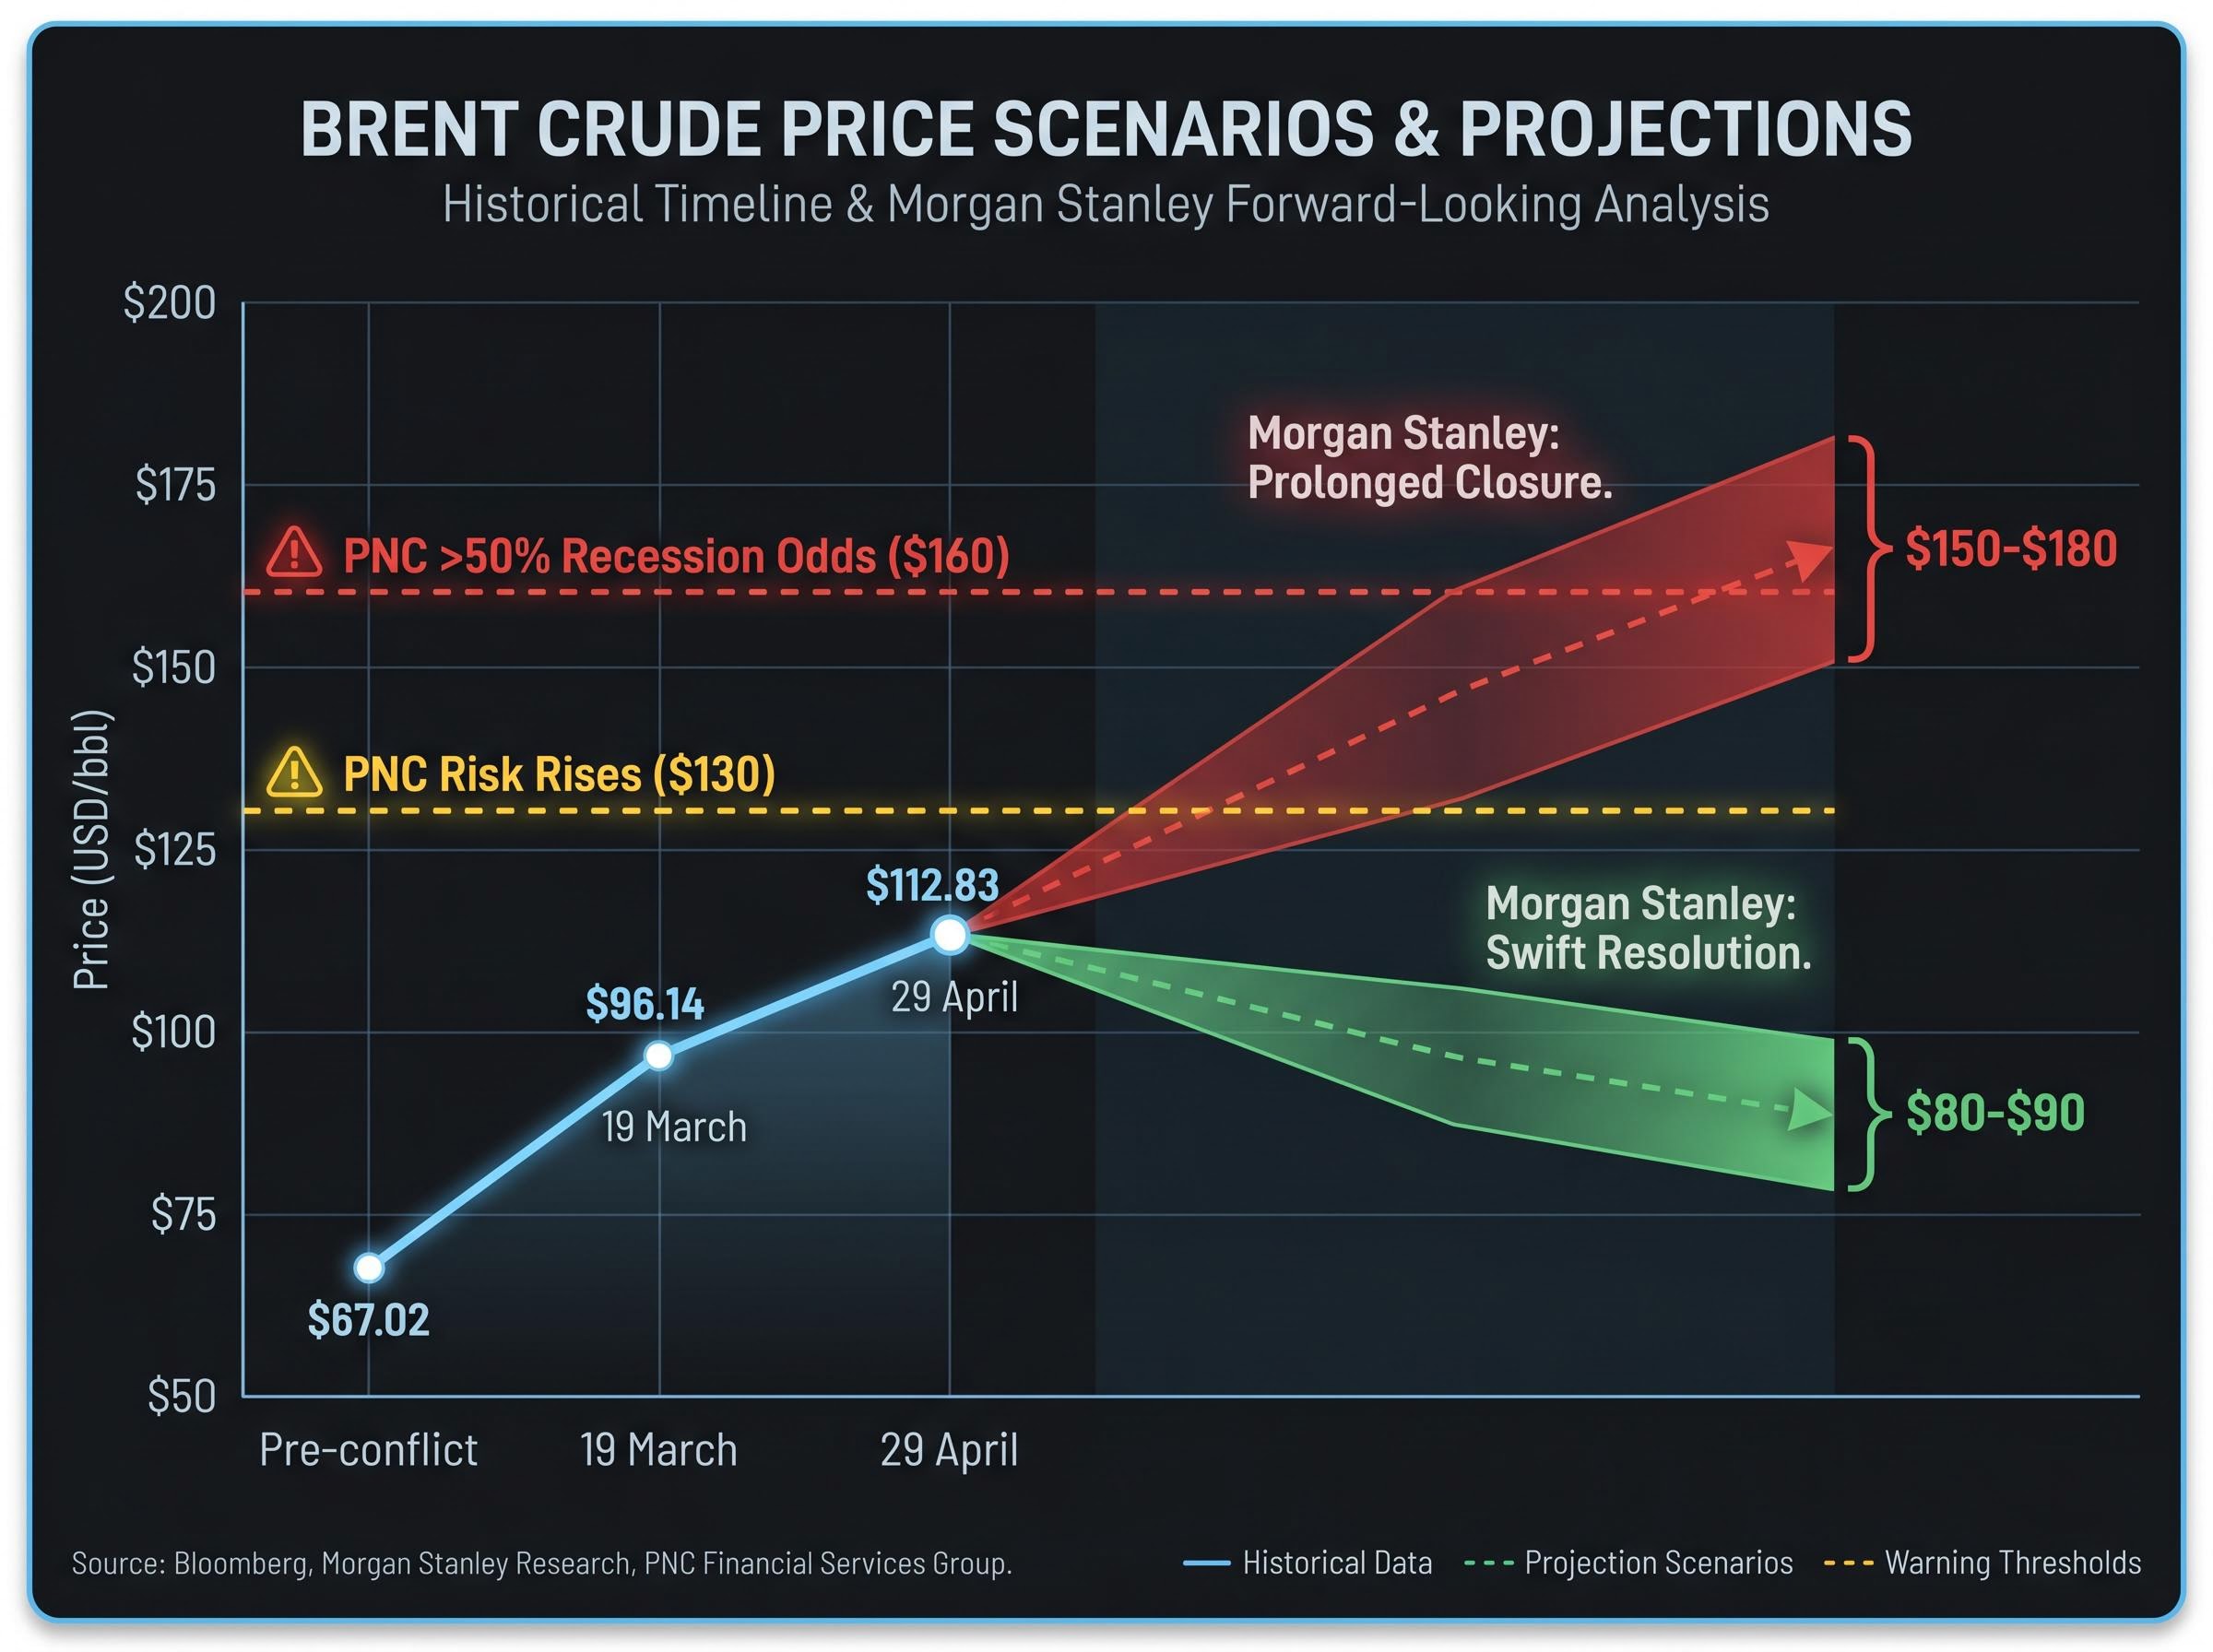
The price trajectory reflects that reality. Brent opened 2026 near $65 per barrel and sat at $67.02 immediately before the conflict. By 19 March, it had climbed to $96.14, a 43% increase. As of 29 April, it stands at $112.83, representing a 68% surge from pre-war levels. Roughly 600 million barrels have been removed from global markets, worth approximately $67.2 billion at current prices.
Three scenarios now define the forward outlook:
- Rapid diplomatic resolution with a phased reopening of the strait, though physical clearance still requires months
- Prolonged closure of three or more months, with cumulative supply losses accelerating
- Iranian attacks on broader regional energy infrastructure, including refineries and pipelines beyond the strait itself
What happens to prices if the strait stays closed
Morgan Stanley analyst Martijn Rats has framed the oil market around two scenarios. Under the best case, a swift resolution with gradual normalisation, Brent averages $80-$90 per barrel. Under a prolonged closure of several months, prices could reach $150-$180 per barrel.
Morgan Stanley’s Martijn Rats projects Brent crude could reach $150-$180 per barrel if the Strait of Hormuz remains closed for several months, a scenario that would place the US economy firmly in recession territory.
PNC Financial Services Group has set a clear threshold: recession odds exceed 50% if oil reaches $160 per barrel, with risk rising materially above $130 per barrel. Current prices at $112.83 sit uncomfortably between those two markers.
When big ASX news breaks, our subscribers know first
What $112 oil actually does to American households
The most immediate way an energy shock reaches the US economy is through the petrol pump. The US Energy Information Administration (EIA) reported average gasoline prices across all grades at $4.17 per gallon for the week ending 27 April 2026. That represents an increase of approximately 40-45% year-to-date.
The $4.25 figure matches highs last recorded in August 2022. The rarity of that price level matters. Since 1993, gasoline has exceeded $4.00 per gallon in only 44 weeks, fewer than 3% of all weeks on record.
The EIA Short-Term Energy Outlook, published in early April 2026, projected retail gasoline prices peaking near $4.30 per gallon during the month, a forecast consistent with the $4.17 all-grades average recorded for the week ending 27 April and with the agency’s assessment that Hormuz-linked supply disruptions were removing a significant share of global crude flows.
Following those 44 weeks when gasoline exceeded $4.00 per gallon, the S&P 500 fell an average of 11% over the subsequent six months.
The transmission runs deeper than the pump. Higher transportation costs for businesses flow into shelf prices. Goldman Sachs modelling forecasts food prices rising approximately 1.5% due to fertiliser cost disruptions linked to the conflict. US Consumer Price Index (CPI) inflation rose to 3.3% annually in March 2026, up from 2.4% pre-conflict.
Consumer spending accounts for roughly 67% of US gross domestic product (GDP), the total value of goods and services produced in the economy. When energy costs absorb a larger share of household budgets, that spending compresses, and the economy’s largest growth engine slows.
| Indicator | Pre-Conflict Level | Current Level (29 April 2026) | Change |
|---|---|---|---|
| Brent Crude | $67.02/bbl | $112.83/bbl | +68% |
| US Gasoline (all grades) | ~$3.00/gallon | $4.17/gallon | +40-45% |
| CPI Inflation (annual) | 2.4% | 3.3% (March 2026) | +0.9 percentage points |
Why this oil shock is different: the educational foundation
A supply-shock recession operates differently from the demand-driven downturns that most investors have experienced in the post-2008 era. The distinction matters because it determines what tools are available to policymakers and, consequently, what investors can expect from the recovery path.
The transmission mechanism follows three steps:
- Energy price surge lifts input costs across the economy, compressing corporate margins and raising consumer prices simultaneously
- Inflation reignition freezes the Federal Reserve, removing rate cuts as a conventional shock absorber
- Consumer spending compression follows as households absorb higher costs with no relief from lower borrowing rates, producing a growth slowdown that occurs alongside rising prices
That combination, slowing growth with persistent inflation, is a stagflationary environment. In a demand-driven recession, the Fed can cut rates to stimulate borrowing and spending. In a supply-shock recession, cutting rates risks accelerating inflation while the economy is already weakening, a policy trap with no clean exit.
Investors who want to understand the precise mechanics behind this transmission will find our full explainer on how oil price surges transmit into recession, which maps all four simultaneous channels: reduced consumer disposable income, rising business input costs, Federal Reserve rate pressure, and the investment and hiring pullback that follows when corporate confidence deteriorates.
The Fed is caught between inflation and slowdown
Before the conflict, markets priced near 90% probability of a Fed rate cut by mid-2026. That probability has collapsed to near zero. The energy-driven inflation surge has effectively eliminated the easing cycle that equity markets had been anticipating for months.
The International Monetary Fund (IMF) has downgraded global 2026 growth to 3.1% from 3.3%, citing the Iran war’s energy and trade impacts. One unnamed firm has cut its 2026 US GDP forecast to 2.4% from 2.8%. The White House, by contrast, projects 3.5% US growth, a notably more optimistic baseline.
That gap reflects genuinely different assumptions about conflict duration rather than simply political optimism. If the strait reopens swiftly and prices normalise within months, the White House figure becomes plausible. If current conditions persist through the second half of 2026, the private sector forecasts look generous.
Historical context grounds the stakes: since the S&P 500‘s establishment in 1957, the index has lost an average of 32% during recessionary periods.
The recession probability map: where Goldman, Moody’s, and EY-Parthenon disagree
The institutional forecasts do not converge on a single number. They diverge meaningfully, and the spread reveals what each institution is implicitly assuming about the conflict’s trajectory.
| Institution | Recession Probability | Key Assumption |
|---|---|---|
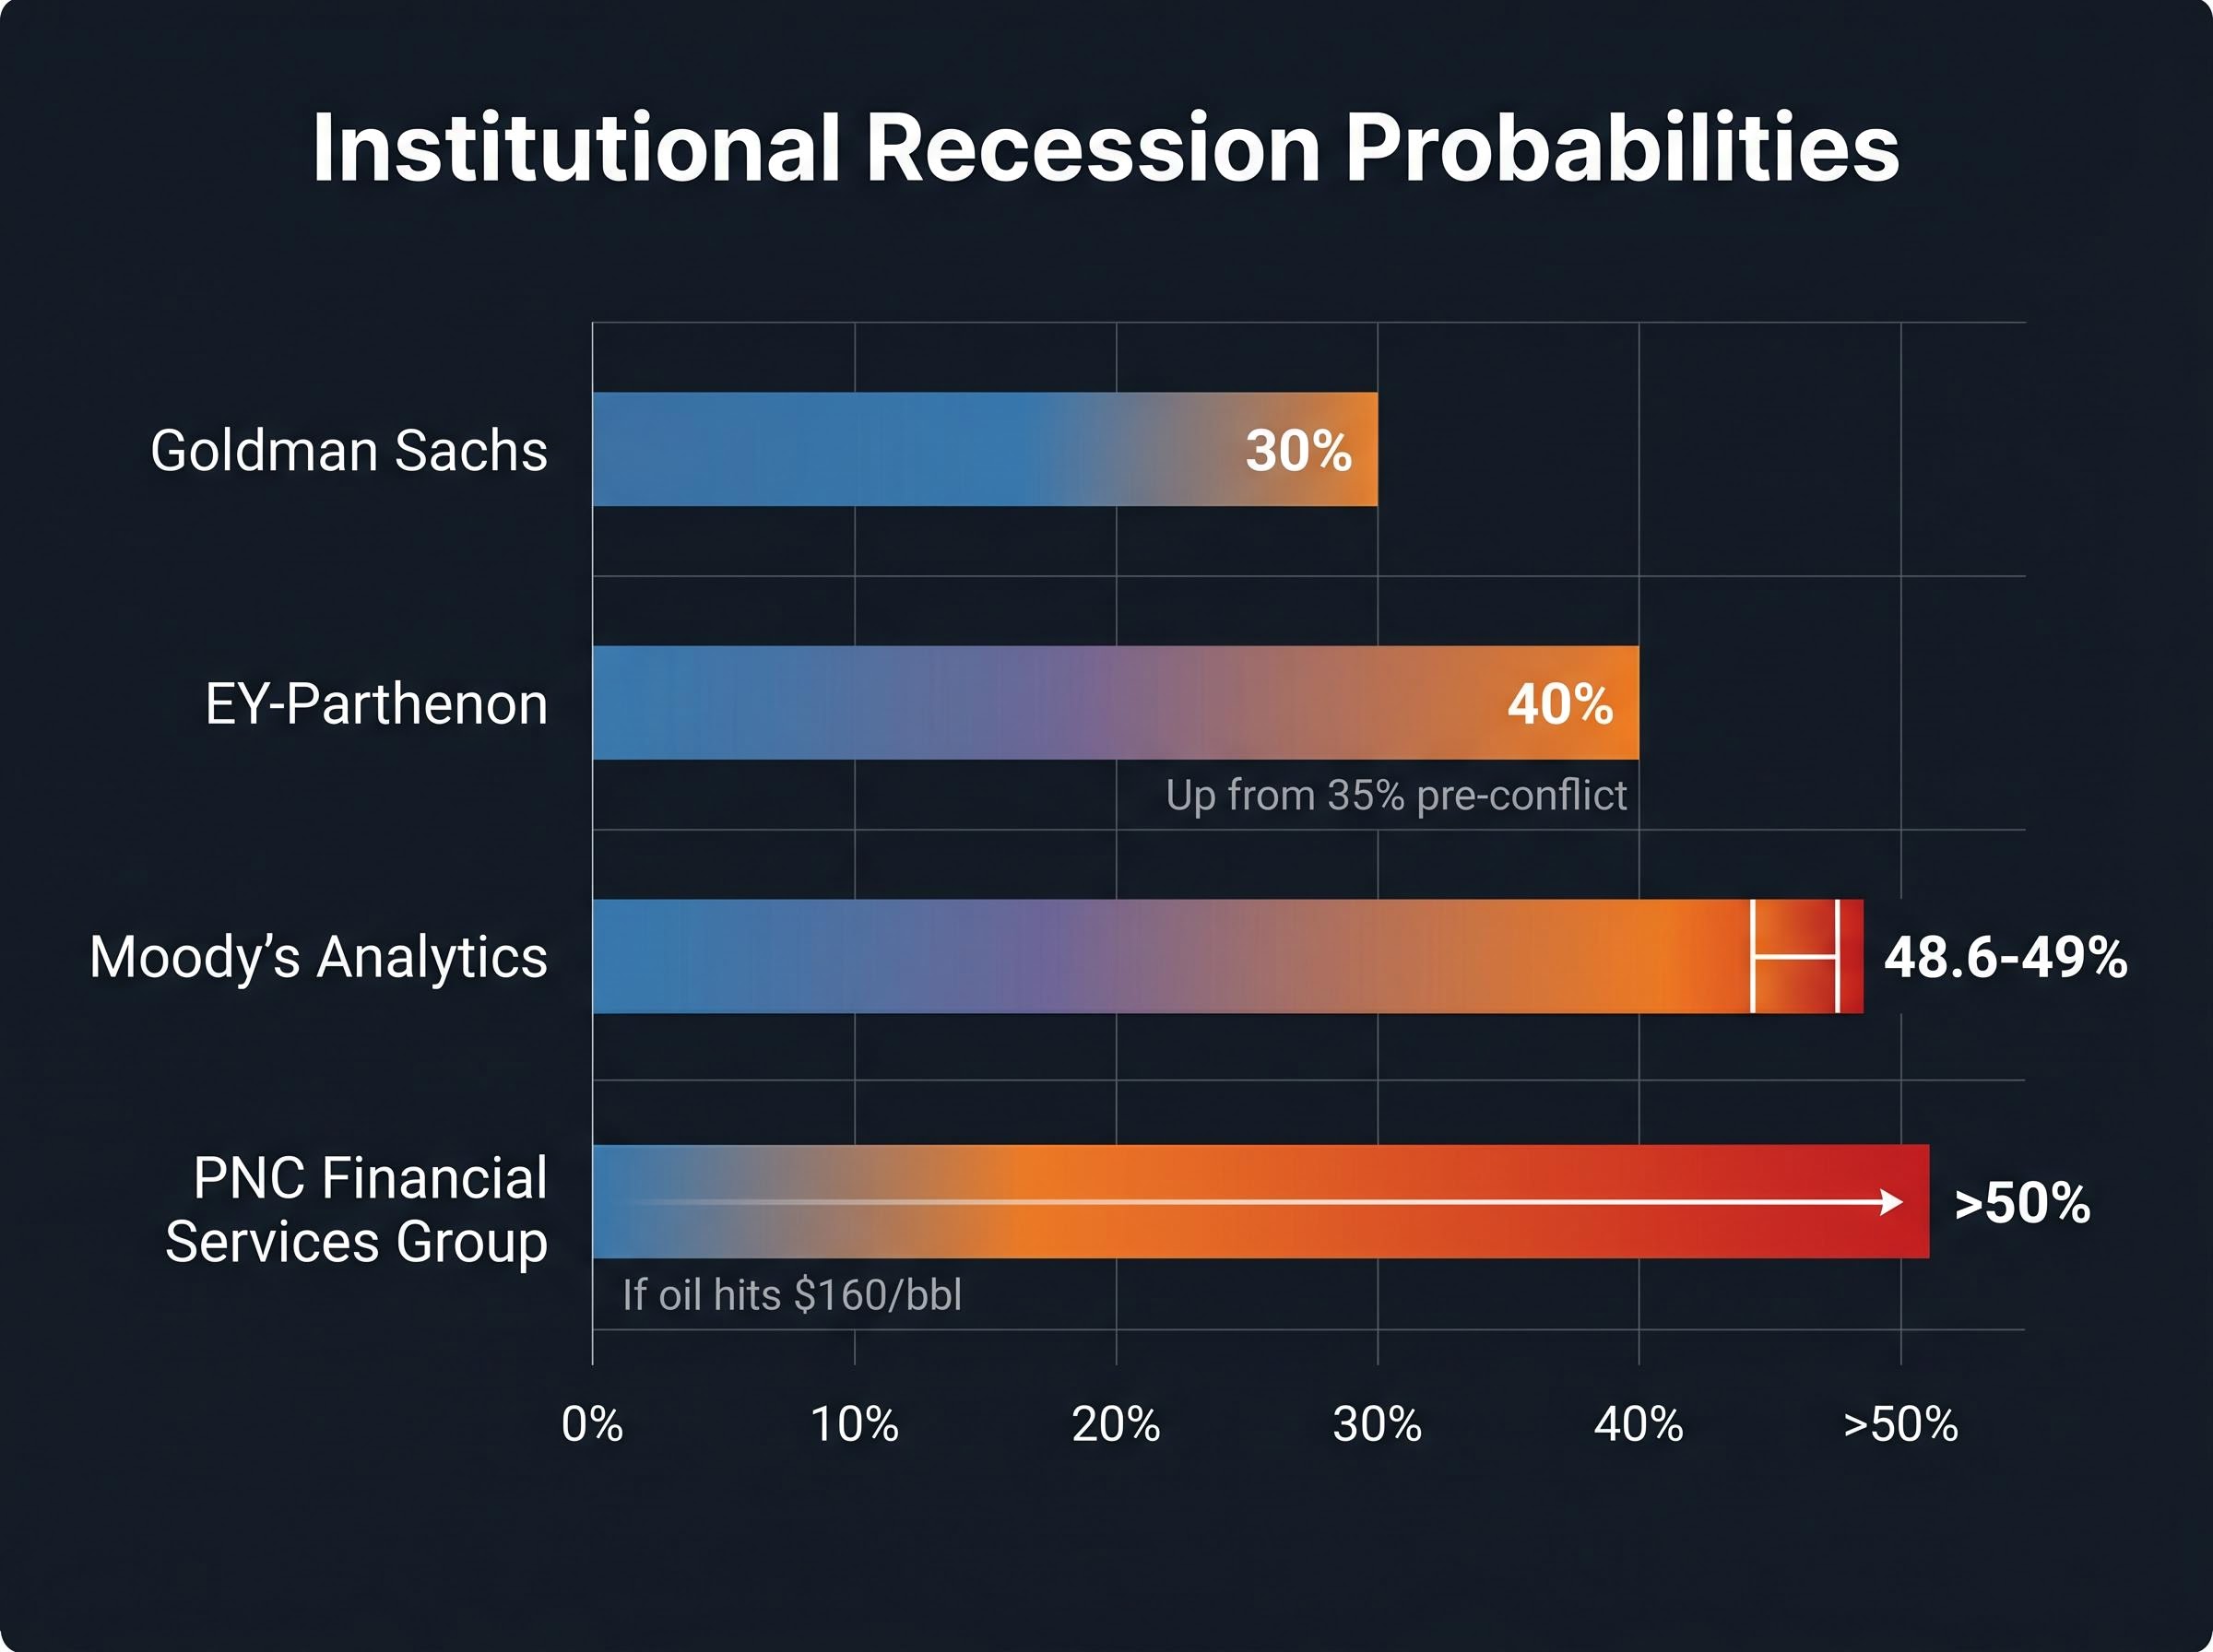
| Goldman Sachs | 30% | Oil price surge is contained; conflict duration is limited |
| EY-Parthenon | 40% (up from 35% pre-conflict) | Moderate duration with partial supply normalisation |
| Moody’s Analytics | 48.6-49% | Extended disruption with cumulative consumer damage |
| PNC Financial Services Group | >50% if oil hits $160/bbl | Price threshold triggers recession regardless of duration |
Goldman Sachs at 30% is pricing in a shorter conflict with manageable supply disruption. EY-Parthenon at 40%, up from 35% before the conflict began, reflects a view that baseline risk has permanently shifted upward. Moody’s Analytics, with Mark Zandi’s estimate near 49%, incorporates the most pessimistic assumptions about duration and cumulative economic damage.
Zandi’s assessment carries a specific implication that investors should weigh carefully.
According to Moody’s Analytics’ Mark Zandi, even a swift conflict resolution with a rapid decline in oil prices would still produce zero GDP growth and zero job creation for the remainder of 2026.
That framing matters. If the most optimistic resolution scenario still delivers economic stagnation, then equity markets pricing in a growth rebound on peace headlines may be mispricing the recovery itself.
The stock market’s fragile recovery and what it is missing
On the surface, equities have absorbed the shock. The S&P 500 fell approximately 9% from its March peak as escalating tensions pushed energy prices higher. It subsequently recovered all losses, returning close to record levels as of late April 2026. A specific rally on 31 March 2026, when the US signalled it was weighing a potential end to the war, helped drive the rebound.
That recovery, however, rests on assumptions that the institutional forecasts do not support. For the current equity pricing to be justified, three conditions would need to hold simultaneously:
- Swift conflict resolution within weeks, not months
- Rapid oil price normalisation to pre-conflict levels, despite the six-month waterway clearance timeline
- Consumer spending resilience despite the inflation damage already accumulated over 61 days
Each condition is plausible in isolation. Together, they describe a best-case scenario that not even Goldman Sachs, the most optimistic institutional voice at 30% recession probability, fully endorses.
The historical pattern reinforces the concern. Following the 44 weeks since 1993 when gasoline exceeded $4.00 per gallon, the S&P 500 averaged an 11% decline over the subsequent six months. Current gasoline prices sit squarely in that territory.
For investors wanting to stress-test these historical averages against the full three-decade data set, our deep-dive into gasoline prices and stock market history examines every episode since 1993 when the $4.00 threshold was breached, including the worst-case peak-to-trough bear market declines averaging 41% during sustained high-price episodes and the sector-by-sector divergence between energy winners and consumer discretionary losers.
What the bond market is signalling that equities are ignoring
Bond markets are telling a different story. Yield curve dynamics have flashed recession warning signals, with inversions noted as a forward-looking indicator. When investors began rotating into Treasuries and money market funds at the conflict’s onset, that capital shift reflected underlying caution that has not been fully unwound despite the equity recovery.
The divergence between equity optimism and fixed income caution is itself a signal. When stocks rally toward record levels while the bond market prices recession risk, one of the two is wrong.
The damage that does not reverse when the shooting stops
The most consequential analytical error investors could make in the current environment is treating a ceasefire as an economic reset button. Conflict resolution, when it comes, will address the geopolitical risk. It will not address the economic damage that has already accumulated.
Three categories of damage persist after any ceasefire:
- Physical infrastructure recovery: Up to six months needed to fully clear the Strait of Hormuz for commercial shipping, meaning supply normalisation extends well into late 2026 or early 2027 regardless of diplomatic timelines
- Labour market deterioration: Unemployment is expected to continue rising regardless of how quickly oil prices pull back, according to Moody’s Analytics assessment
- Inflation re-anchoring: CPI has climbed from 2.4% to 3.3% in two months; that price level does not reverse when oil falls, because businesses rarely lower prices at the same speed they raise them
Mark Zandi’s assessment bears repeating: even a swift resolution produces zero GDP growth and zero job creation for the remainder of 2026. The EY-Parthenon probability shift from 35% to 40% illustrates that the baseline risk level itself has permanently moved higher, even in optimistic scenarios.
Since the S&P 500‘s establishment in 1957, the index has lost an average of 32% during recessionary periods. Institutional recession probabilities in the 30-49% range imply that risk is not a tail scenario; it is a near-coin-flip for portfolio values.
Positioning around a peace deal as if it constitutes an economic all-clear signal is the specific miscalculation this data is designed to highlight.
This article is for informational purposes only and should not be considered financial advice. Investors should conduct their own research and consult with financial professionals before making investment decisions. Past performance does not guarantee future results. Financial projections are subject to market conditions and various risk factors.
What investors should be watching as day 61 becomes day 90
Four indicators will determine whether recession risk materialises or recedes over the coming months. First, the Brent crude trajectory relative to PNC Financial Services Group‘s $130 and $160 thresholds. Second, the pace and substance of ceasefire negotiations following Iran’s 27 April proposal. Third, monthly CPI readings; any acceleration beyond 3.3% would further constrain the Fed. Fourth, consumer spending data, particularly retail sales figures that capture the direct household impact of sustained $4.00-plus gasoline.
The US holds a structural buffer as the world’s largest oil producer, providing a degree of insulation that prior oil-shock economies did not possess. That buffer softens the impact. It does not eliminate it.
The equity market’s recovery implies optimism about resolution that the economic data, the institutional forecasts, and the physical realities of the Strait of Hormuz do not yet justify. The gap between what stocks are pricing and what the economy is absorbing is the space where risk lives, and it widens with every day the strait remains closed.