
How Hormuz Closure at $104 Oil Is Reshaping Every Asset Class
5 hrs ago

The S&P 500 has returned 305% over the past decade, a record so compelling it makes the case against U.S. equities feel almost reckless. Almost. Through the first four months of 2026, the MSCI Emerging Markets index is up 16.51% year-to-date, the MSCI EAFE (developed international) is up 5.43%, and the S&P 500 trails both at 4.63%. That performance gap is not a blip. It is the visible surface of a deeper structural shift that institutional investors at BlackRock, Fidelity, Morningstar, Charles Schwab, and others have been positioning around since late 2025. The conditions underpinning a decade and a half of U.S. market supremacy, specifically compressed valuations abroad, a rising dollar, and unchallenged U.S. capital market dominance, have begun to erode on all three fronts simultaneously. What follows is an examination of whether U.S. market dominance is genuinely peaking, what the data says about international valuations and historical rotation cycles, and what a measured, practical allocation to international stocks looks like for American investors in 2026.
The strength of U.S. equities over the past decade rests on genuine structural foundations:
The Magnificent Seven technology stocks became the apex expression of that dominance, concentrating an extraordinary share of S&P 500 returns in a handful of names. Warren Buffett’s Berkshire Hathaway compounded at approximately 20% annually across six decades, a figure cited in his 2021 shareholder letter as evidence of U.S. long-run compounding power.
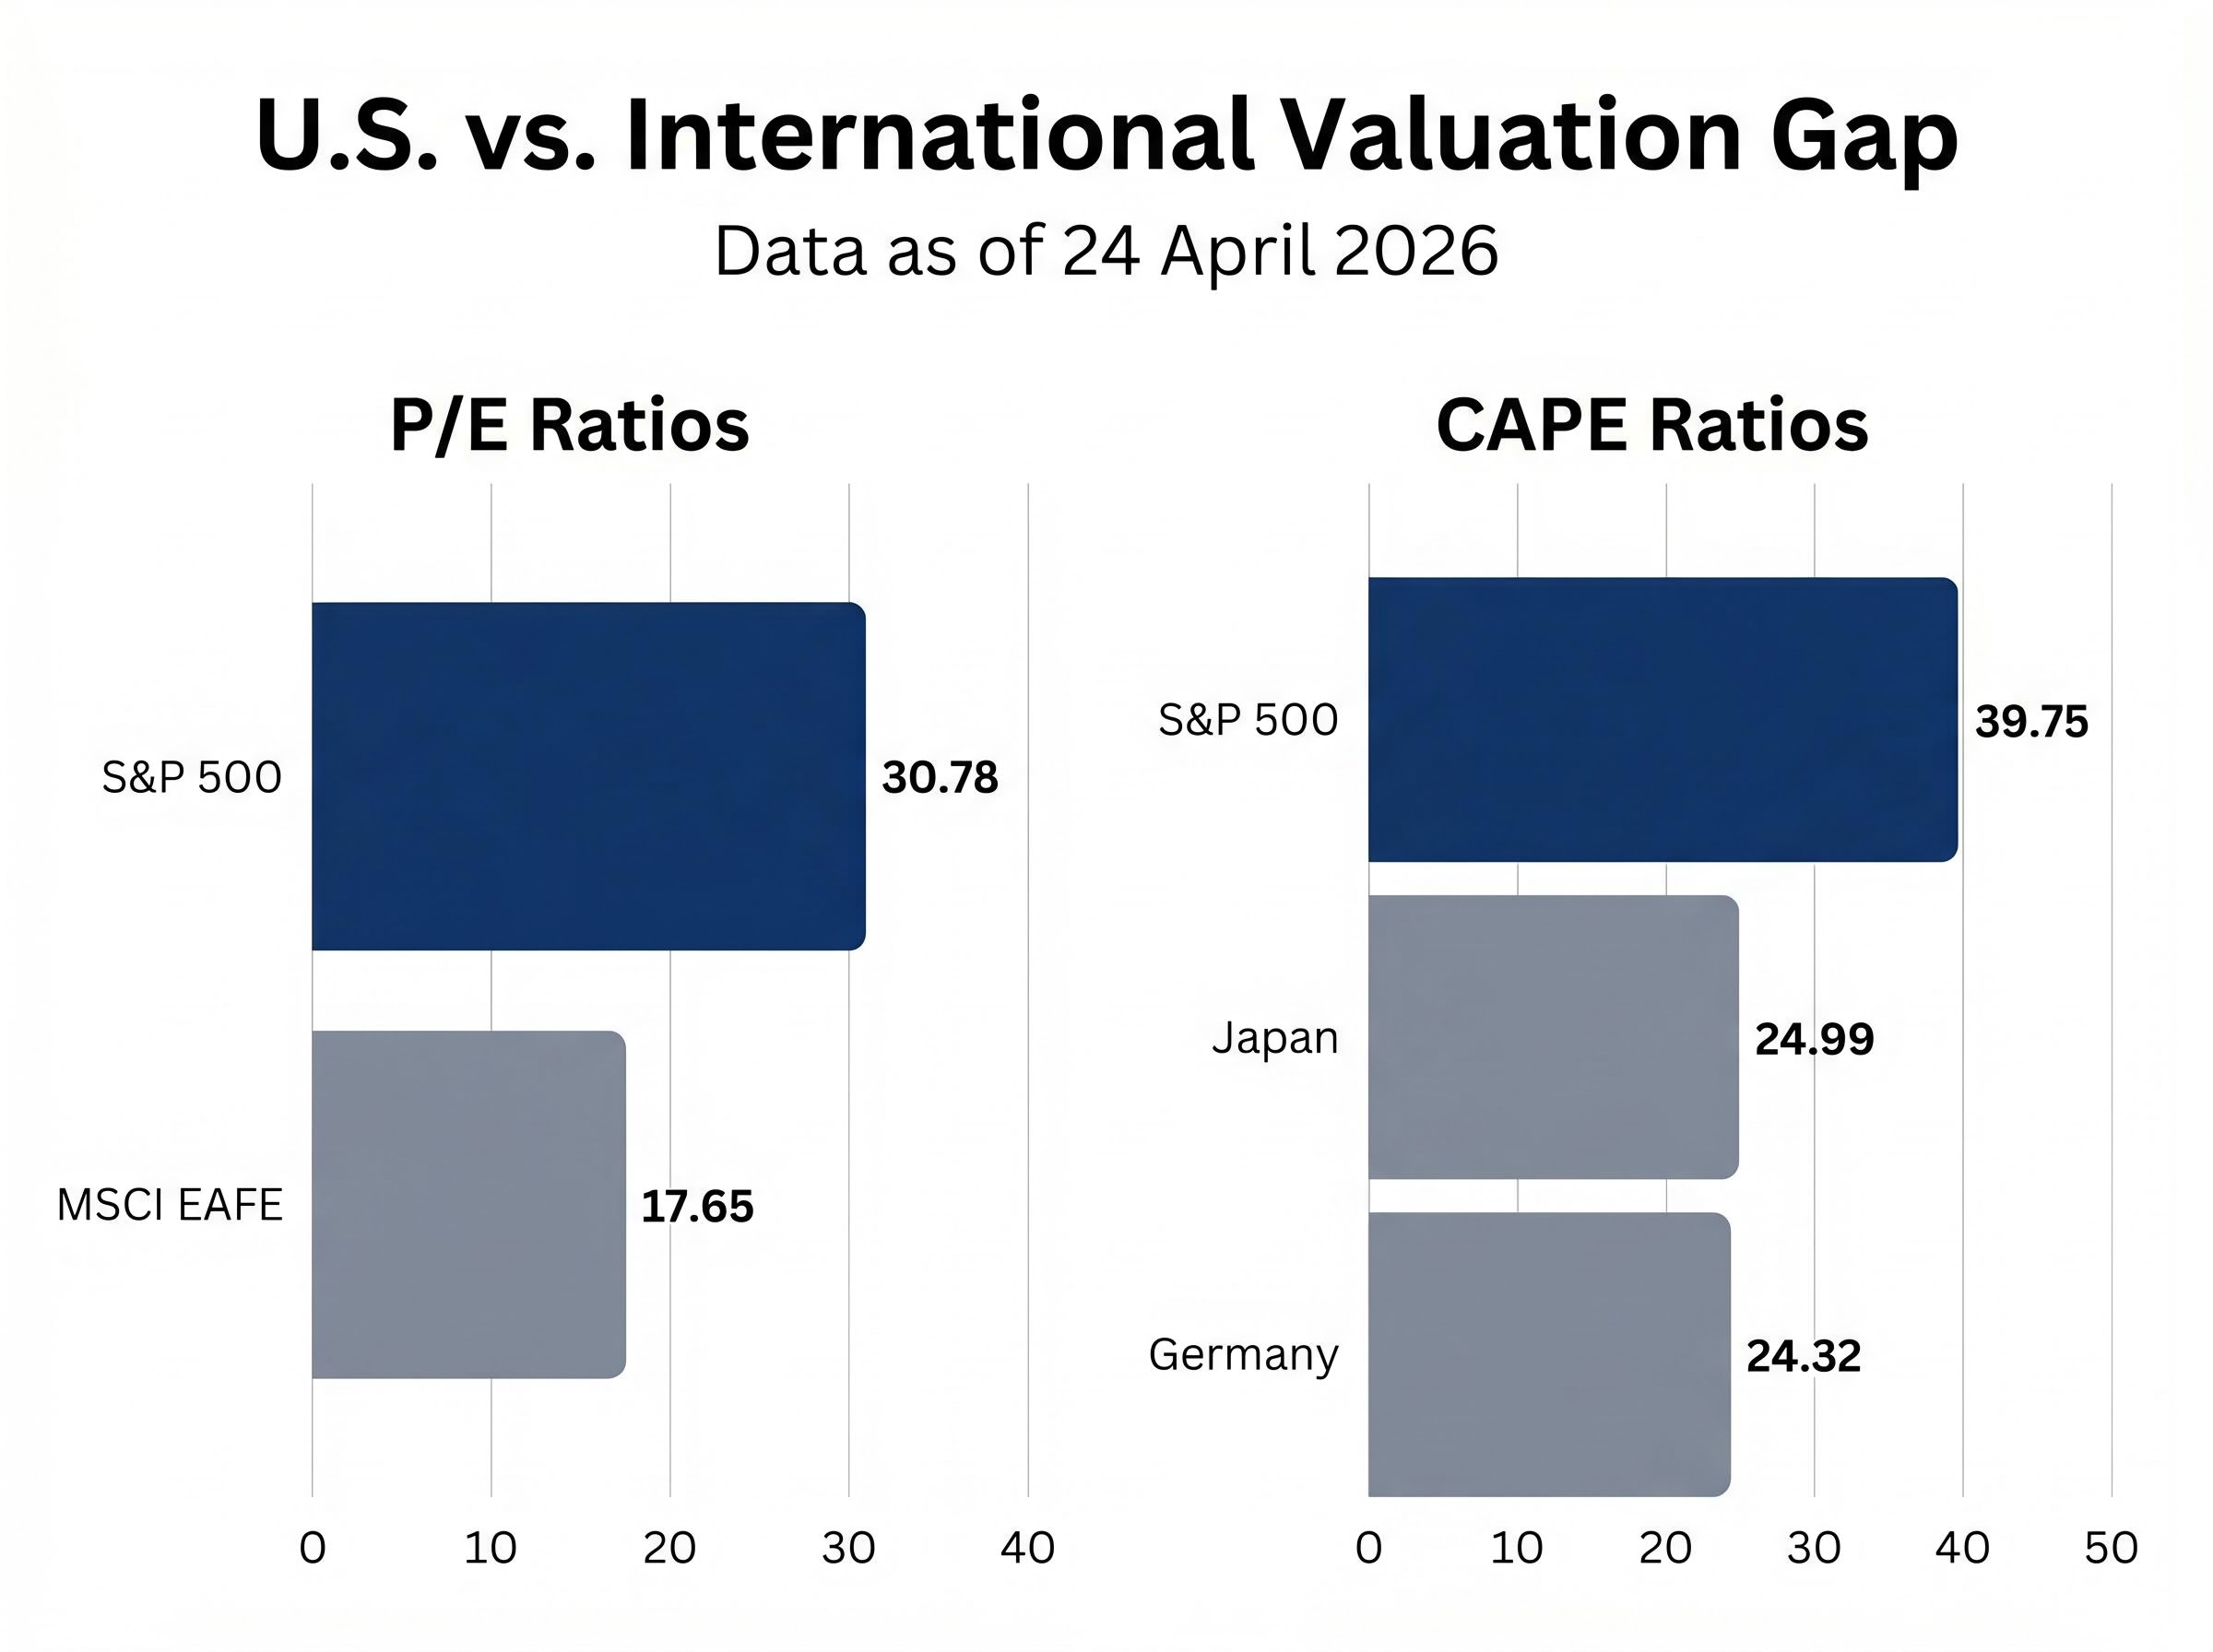
The concern, however, is not with U.S. quality. It is with U.S. price. The S&P 500 currently trades at a price-to-earnings ratio of 30.78 and a cyclically adjusted price-to-earnings (CAPE) ratio of 39.75, as of 24 April 2026.
The structural fault lines beneath the S&P 500 record extend well beyond valuation: a 116-basis-point inflation surge in eight weeks, Strait of Hormuz disruption affecting roughly 20% of global petroleum demand, and a narrowing rally concentrated in a handful of names all create compounding pressure on the discount-rate assumptions embedded in current stock prices.
The S&P 500 CAPE ratio of 39.75 has historically been exceeded only during the dot-com bubble peak, placing current valuations in rare company.
That valuation level does not guarantee a correction. It does, however, compress the range of probable forward returns and raises a direct question: is the next decade’s return already priced into today’s market?
The U.S. premium over international equities is not a matter of perception. It is measurable, and at current levels, it is striking.
The S&P 500’s P/E of 30.78 sits nearly double the MSCI EAFE’s 17.65. When the comparison shifts to cyclically adjusted earnings, which smooth out short-term profit cycles and provide a cleaner long-horizon lens, the gap persists across every major developed market.
| Market | P/E Ratio | CAPE Ratio |
|---|---|---|
| S&P 500 (U.S.) | 30.78 | 39.75 |
| MSCI EAFE | 17.65 | — |
| Japan | — | 24.99 |
| Germany | — | 24.32 |
The numbers tell the same story from every angle. U.S. equities are priced for sustained excellence; international equities are priced for mediocrity. If reality lands anywhere between those two extremes, the relative return math shifts.
Cheap valuations alone do not move markets. Combined with earnings growth, a weakening dollar, and active institutional repositioning, they represent a meaningful asymmetry that long-horizon investors can position around.
A tiered allocation framework for reducing U.S. concentration risk, anchoring broad international exposure in VXUS, adding targeted emerging market weight through IEMG, and using single-country ETFs as satellite positions, reflects how institutional investors with long-horizon mandates are operationalising the same valuation gap data that retail investors are now encountering.
The CAPE ratio, sometimes called the Shiller P/E, divides price by the average of inflation-adjusted earnings over the prior ten years. Its value for investors lies not in timing corrections but in framing expectations. Historically, elevated CAPE readings have been followed by lower annualised returns over the subsequent decade, not necessarily by immediate declines.
A CAPE of 39.75 does not signal an imminent crash. It does suggest that U.S. equities face probable compression of long-run annualised returns relative to historical averages, a headwind that international markets, priced at roughly 60-65% of the U.S. multiple, do not share to the same degree.
A starting allocation of approximately 5% offers a modest but meaningful entry point, one that complements existing U.S. holdings rather than displacing them. The practical question is what that 5% actually looks like inside a brokerage account.
The broadest, lowest-friction option is a total international ETF. Vanguard Total International Stock ETF (NASDAQ: VXUS) holds developed and emerging market equities in a single instrument at an expense ratio of 0.05%. As of 27 April 2026, VXUS traded at $82.36, within a 52-week range of $63.23 to $84.48. Its top three holdings, Taiwan Semiconductor Manufacturing, Samsung Electronics, and ASML Holding, illustrate that international exposure increasingly means global technology and semiconductor exposure, not a retreat from growth.
| Vehicle | Ticker | Scope | Expense Ratio |
|---|---|---|---|
| Vanguard Total International Stock ETF | VXUS | Broad International (Developed + EM) | 0.05% |
| iShares Core MSCI International | IXUS | Broad International (Developed + EM) | 0.07% |
| iShares Core MSCI Emerging Markets | IEMG | Emerging Markets | 0.09% |
| Single-Country ETFs (e.g., South Korea, Brazil, Japan) | Various | High-Conviction Tactical | Varies |
For investors who want targeted emerging market exposure, IEMG and EEM offer concentrated EM allocations. Single-country ETFs allow high-conviction tactical positions in specific markets. American depositary receipts (ADRs) provide individual stock exposure without direct foreign exchange trading.
Tax considerations warrant brief attention:
Investors should consult IRS Publication 515 or a tax adviser for guidance specific to their situation.
Investors exploring how geographic diversification differs from sector diversification in practical portfolio terms will find our dedicated guide to geographic diversification for U.S. investors covers the Japan corporate governance reform tailwind, the foreign tax credit mechanics under IRS Publication 514, and why a 5% starting allocation through VXUS or IXUS avoids materially disrupting an existing domestic portfolio.
U.S. and international equity markets have historically traded leadership in multi-year cycles, with the dominant region rotating roughly every 7-10 years. This pattern is not a trading signal. It is a structural observation drawn from data stretching back to 1979.
The timeline follows a recognisable sequence:
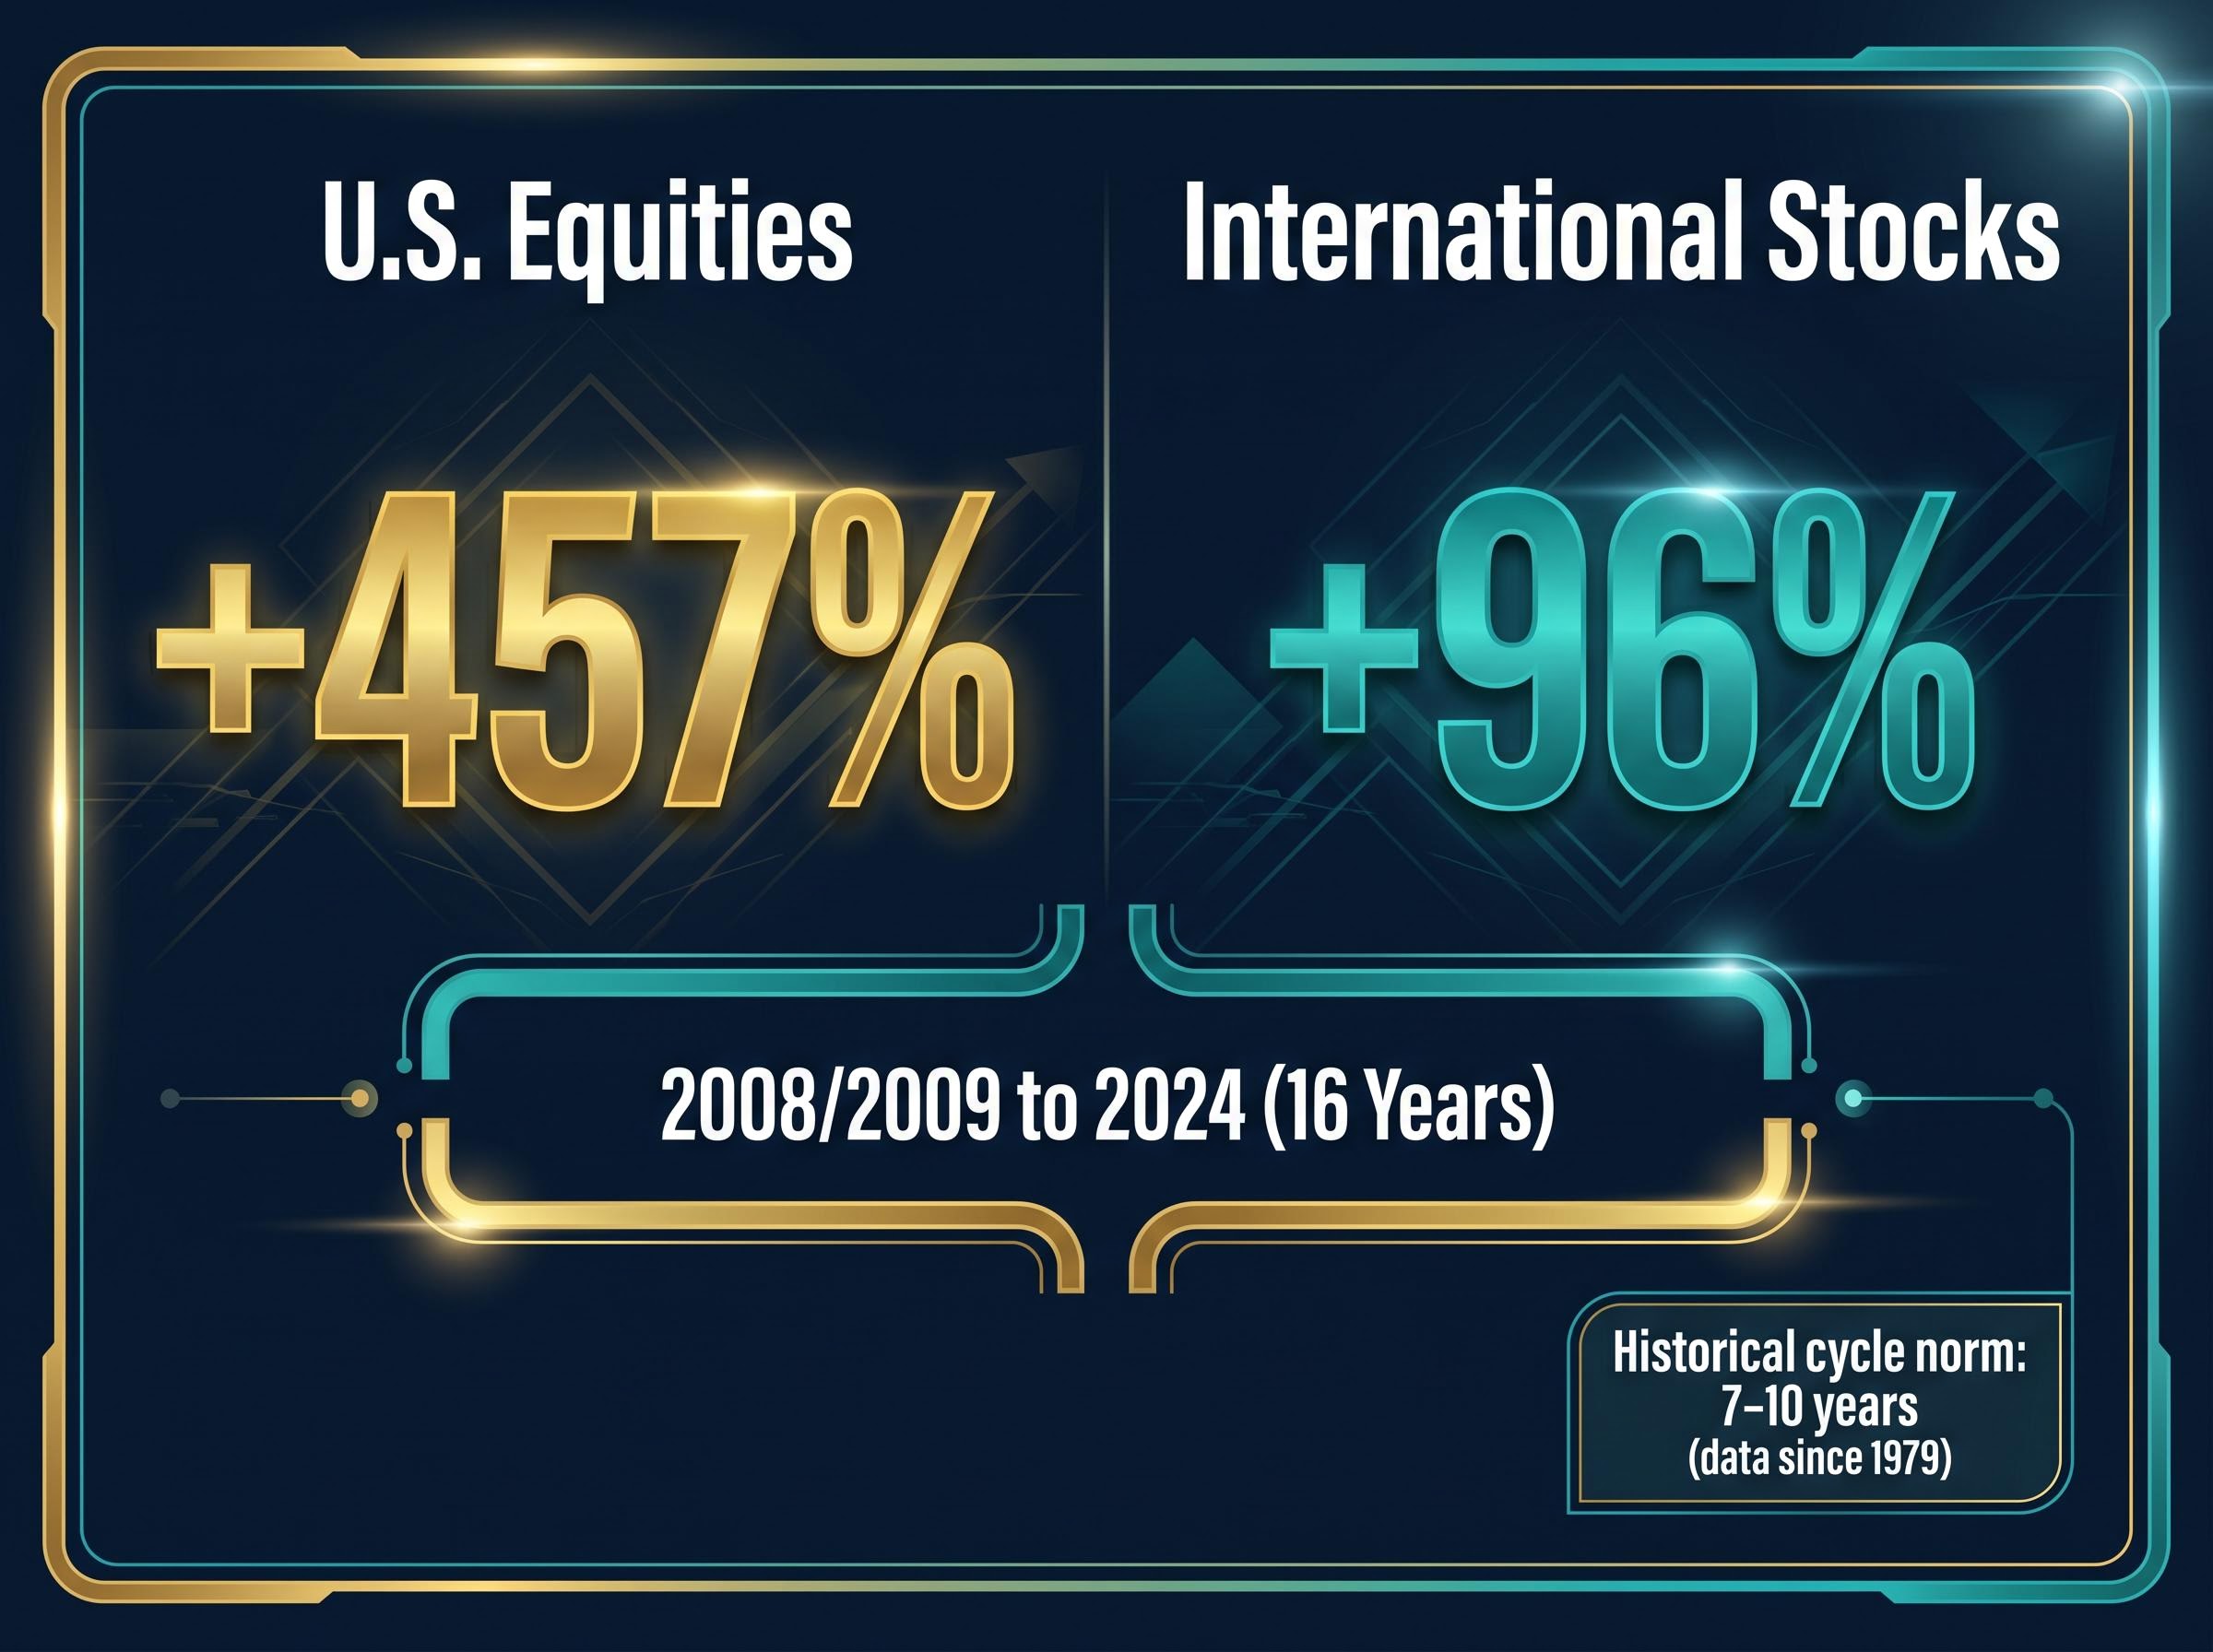
Over the most recent 16-year U.S. dominance cycle, the cumulative return gap reached +457% versus +96% for international equities. If historical mean reversion patterns hold, the current gap implies a directional advantage for international stocks over the coming cycle.
If historical cycle durations hold, the current international outperformance phase may have years remaining. That does not guarantee it will persist, but it reframes the current shift as a cycle resuming rather than a surprise, and makes the case for international allocation a structural portfolio decision rather than a short-term tactical bet.
The scale of international equity rotation and institutional fund flows in late 2025 and early 2026 adds a behavioural dimension to the structural picture: approximately $75 billion rotated out of U.S. equity funds over the six months through February 2026, a pace that reinforces the view that the current outperformance cycle reflects deliberate repositioning by large allocators, not merely short-term momentum.
The international thesis in 2026 is not a valuation argument waiting for a catalyst. The catalysts are already in motion across three distinct regions:
The dollar dynamic deserves particular attention. The DXY (U.S. Dollar Index) declined from approximately 99.5 in mid-January 2026 to 98.3 by 27 April 2026, a drop of roughly 2.24%. For U.S.-based investors holding unhedged international positions, a weaker dollar amplifies foreign equity returns when converted back to U.S. dollars.
Morningstar’s 2026 analysis of dollar weakness and international equity returns details the mechanical relationship at work: when the DXY declines, unhedged foreign asset values translate back into more U.S. dollars, effectively layering a currency return on top of local equity performance and compounding the advantage of holding international positions during periods of sustained dollar depreciation.
iShares/BlackRock stated in March 2026 that it preferred emerging markets over developed economies, citing lower international valuations and favourable dollar dynamics for U.S. investors.
Morningstar’s forecast of prolonged cyclical dollar weakness aligns with the observed trend. Wellington stands as the notable institutional outlier, preferring Japan and then U.S. equities over Europe and emerging markets, a reminder that the consensus is broad but not unanimous.
A credible case for international allocation requires the same precision applied to its risks as to its opportunities:
The 52-week range of VXUS ($63.23 to $84.48) illustrates the volatility band investors face when holding broad international exposure.
None of these risks negate the diversification case. They reinforce why a measured starting allocation, such as the 5% entry point discussed earlier, is more appropriate than a dramatic portfolio overhaul. Broad international ETFs such as VXUS inherently diversify across dozens of countries and currencies, reducing the concentration risk that single-country or single-currency positions carry. The goal is not to replace U.S. equities but to complement them with a valuation and cycle-aware allocation.
The 16-year cycle of U.S. market dominance was real, well-founded, and compounding. The question for 2026 is not whether U.S. equities belong in a portfolio but whether a portfolio built exclusively on U.S. equities is priced for the next 16 years or the last ones. The valuation gap (U.S. P/E of 30.78 versus international P/E of 17.65), the year-to-date performance reversal, the dollar trajectory, and the institutional consensus converge on a single practical implication: a modest international allocation is no longer a contrarian bet. It has become a mainstream diversification move that the data now actively supports. Investors may benefit from reviewing their current portfolio’s geographic concentration, considering what a 5% international allocation would look like using low-cost vehicles such as VXUS or IXUS, and consulting a financial adviser for personalised guidance before making allocation changes.
This article is for informational purposes only and should not be considered financial advice. Investors should conduct their own research and consult with financial professionals before making investment decisions. Past performance does not guarantee future results. Financial projections are subject to market conditions and various risk factors.
The CAPE ratio (Cyclically Adjusted Price-to-Earnings) divides a market's price by the average of ten years of inflation-adjusted earnings, giving investors a long-horizon valuation lens. The U.S. S&P 500 currently sits at a CAPE of 39.75 compared to roughly 24-25 for Japan and Germany, meaning international markets are priced significantly cheaper, which historically points to higher probable forward returns.
A starting allocation of approximately 5% offers a meaningful entry point that complements existing U.S. holdings without dramatically overhauling a portfolio, and low-cost broad ETFs such as VXUS (expense ratio 0.05%) or IXUS (0.07%) are practical vehicles for establishing that position.
Three catalysts are driving international outperformance: Germany's largest fiscal stimulus since reunification supporting European equities, ongoing corporate governance reforms in Japan improving capital returns, and a weakening U.S. dollar (the DXY fell roughly 2.24% from mid-January to late April 2026) that amplifies foreign equity returns for unhedged U.S. investors.
Key risks include currency risk (a strengthening dollar would erode unhedged returns), valuation persistence (cheap markets can remain cheap due to governance or demographic issues), lower liquidity in single-country and frontier market instruments, and geopolitical instability that can mask underlying volatility even when headline index returns look strong.
The Vanguard Total International Stock ETF (VXUS) provides broad developed and emerging market coverage at a 0.05% expense ratio, iShares Core MSCI International (IXUS) offers similar scope at 0.07%, and iShares Core MSCI Emerging Markets (IEMG) at 0.09% targets concentrated emerging market exposure for investors seeking higher growth potential.


