
How Hormuz Closure at $104 Oil Is Reshaping Every Asset Class
5 hrs ago

International stocks outperformed the S&P 500 by nearly double in 2025, and that gap extended into 2026. For U.S. investors who spent a decade assuming domestic equities were the only allocation that mattered, the performance data poses a question many may not be ready to answer. The S&P 500 delivered a cumulative total return of 305% over the ten years ending April 2026, a run that made the case for international diversification feel academic. Now, with the S&P 500 Shiller CAPE at approximately 39.75 (exceeded only during the dot-com era), international markets posting superior returns across two consecutive periods, and a weakening U.S. dollar amplifying those gains for American investors, the question of geographic allocation has shifted from theoretical to pressing.
This analysis walks through both sides of the debate with specific data: the legitimate reasons to stay U.S.-heavy, the structural forces now favouring international exposure, the real risks to the international thesis, and a practical framework for how U.S. investors might act on the evidence today.
International equities, for U.S. investors, break into two main buckets. The first is developed international markets, tracked by the MSCI EAFE index, which covers Europe, Australasia, and the Far East. These are deep, liquid markets with established regulatory frameworks, lower volatility than their emerging counterparts, and slower structural growth. The second is emerging markets, tracked by the MSCI EM index, covering higher-growth but higher-volatility economies across EM Asia, Latin America, and Eastern Europe.
In practice, U.S. investors access these markets through a handful of familiar vehicles:
The distinction between developed and emerging international matters for portfolio construction. Developed international markets offer lower volatility, deeper liquidity, and more stable currency dynamics, but also lower expected growth. Emerging markets offer structurally higher growth potential, particularly in EM Asia where AI infrastructure demand is accelerating earnings, but carry elevated currency risk, political risk, and single-country concentration risk.
BlackRock’s iShares unit specifically prefers emerging markets over developed international for 2026, citing lower valuations and EM Asia earnings growth driven by AI infrastructure demand. That preference shapes which vehicles investors choose, not just whether they allocate internationally at all.
The iShares Spring 2026 Investment Directions on EM Asia earnings and AI infrastructure sets out BlackRock’s preference for emerging markets over developed international in concrete terms, with EM Asia’s role in the global AI buildout cited as the primary earnings catalyst driving that allocation tilt.
The numbers built the case before any narrative did. The S&P 500 returned 305% cumulatively over the ten years ending 23 April 2026. Warren Buffett’s Berkshire Hathaway compounded at approximately 20% annualised over roughly six decades, as noted in his 2021 shareholder letter, a record assembled almost entirely within U.S. equities.
Buffett’s compounding record: approximately 20% annualised over roughly six decades, built almost entirely within U.S. equities, remains one of the strongest empirical arguments for the depth and dynamism of American capital markets.
The structural advantages underpinning that performance were not cyclical accidents. Entrepreneurial culture, deep capital markets, strong property rights, and sector dominance across financials, defence, energy, entertainment, and pharmaceuticals created compounding advantages that international markets struggled to match over sustained periods. The Magnificent Seven, the mega-cap technology cohort whose products shape global technological development, became the gravitational centre of recent U.S. performance.
Acknowledging the legitimacy of that record matters. The case for U.S.-focused investing was grounded in decades of compounding evidence. What follows is not a dismissal of that logic, but an examination of whether the conditions that produced it have shifted.
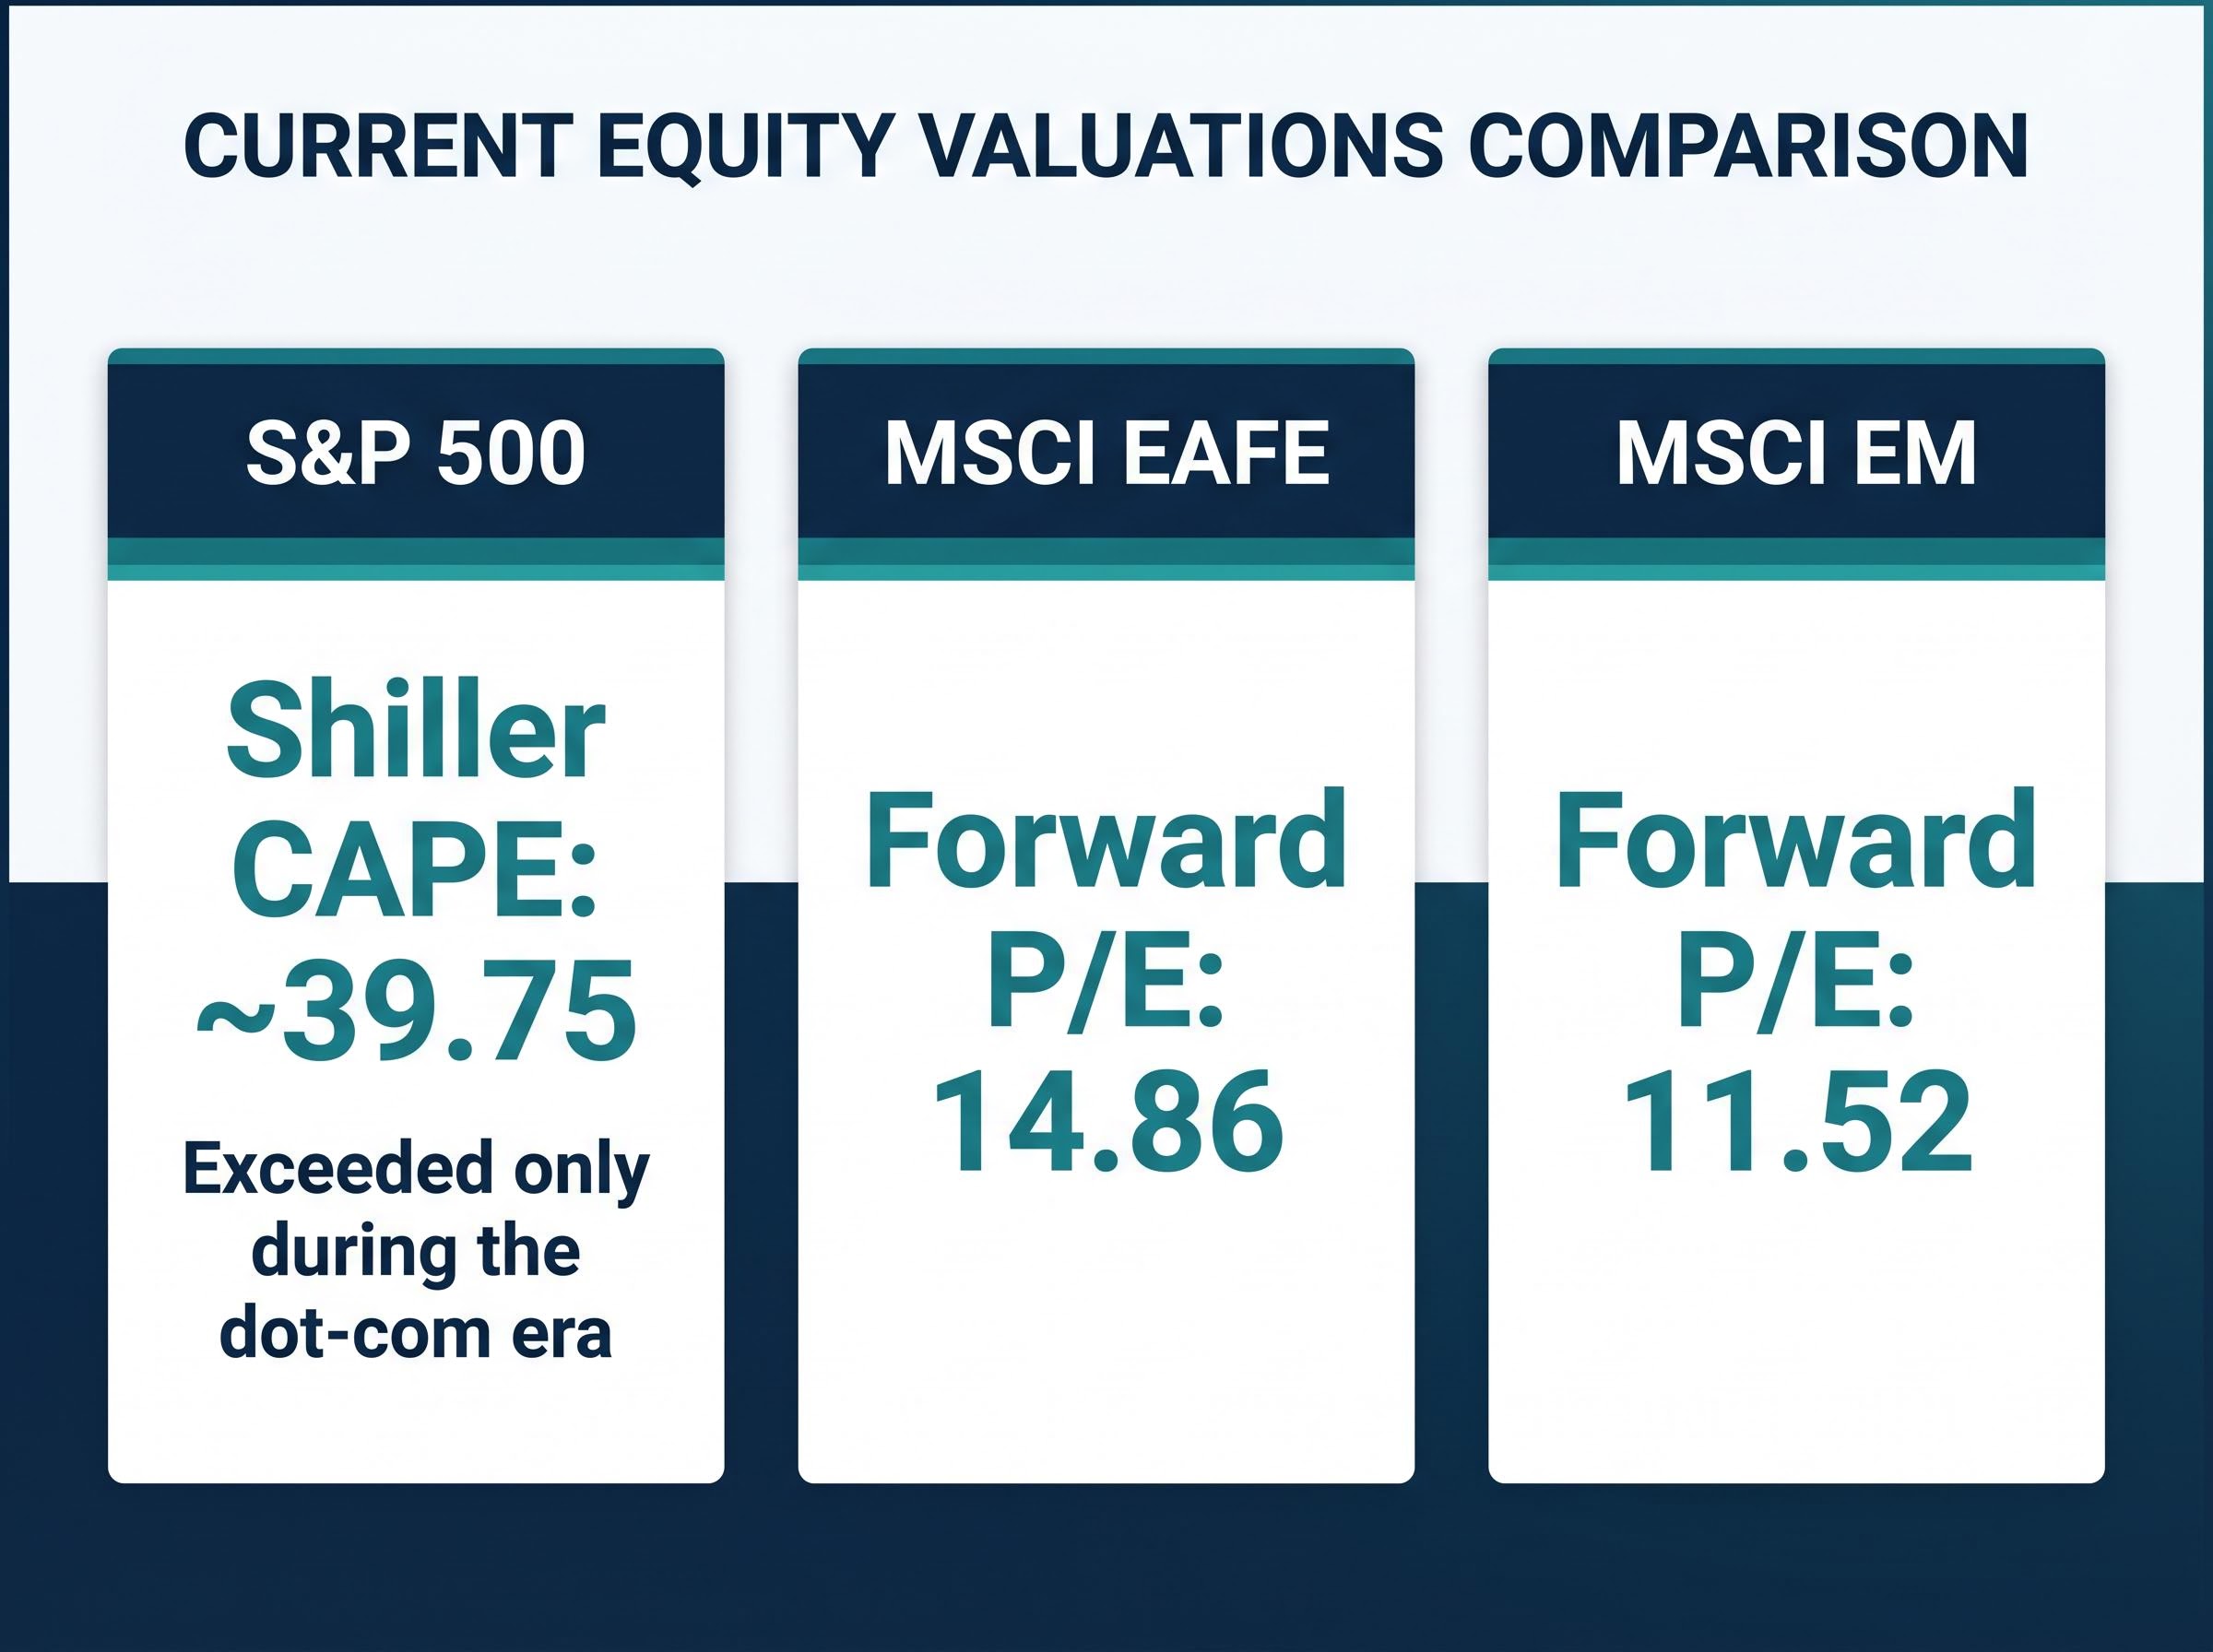
Start with U.S. equities. The S&P 500 Shiller CAPE sits at approximately 39.75 as of April 2026. That reading has been surpassed only once in modern market history: during the dot-com bubble.
The current S&P 500 Shiller CAPE of approximately 39.75 has been exceeded only during the dot-com era, placing U.S. equity valuations in historically rare territory.
Now step to developed international markets. The MSCI EAFE forward P/E is 14.86. And emerging markets sit lower still: the MSCI EM forward P/E is 11.52.
| Index | Valuation Metric | Current Reading | Context |
|---|---|---|---|
| S&P 500 | Shiller CAPE | ~39.75 | Exceeded only during the dot-com era |
| MSCI EAFE | Forward P/E | 14.86 | Substantially cheaper than U.S. equities |
| MSCI EM | Forward P/E | 11.52 | Most attractively valued major region |
Elevated valuations alone do not guarantee weak forward returns. However, valuation is among the most reliable predictors of long-run outcomes, and the gap between U.S. and international readings is historically wide. The concentration risk compounds the picture: a small number of mega-cap stocks drive the S&P 500, meaning a reversal in those names carries outsized consequences for the index as a whole.
The disparity widens with each step down the table. That widening is the analytical signal.
Investors who want the full quantitative treatment, including Vanguard, GMO, and Research Affiliates forward return projections and a percentile ranking of current S&P 500 valuations against 155 years of market history, will find our dedicated guide to U.S. valuations and the international investment case, which builds out the decade-ahead return comparison across U.S. large-cap, international developed, and emerging market asset classes.
The valuation gap would be an academic observation if it were not accompanied by actual performance divergence. It is.
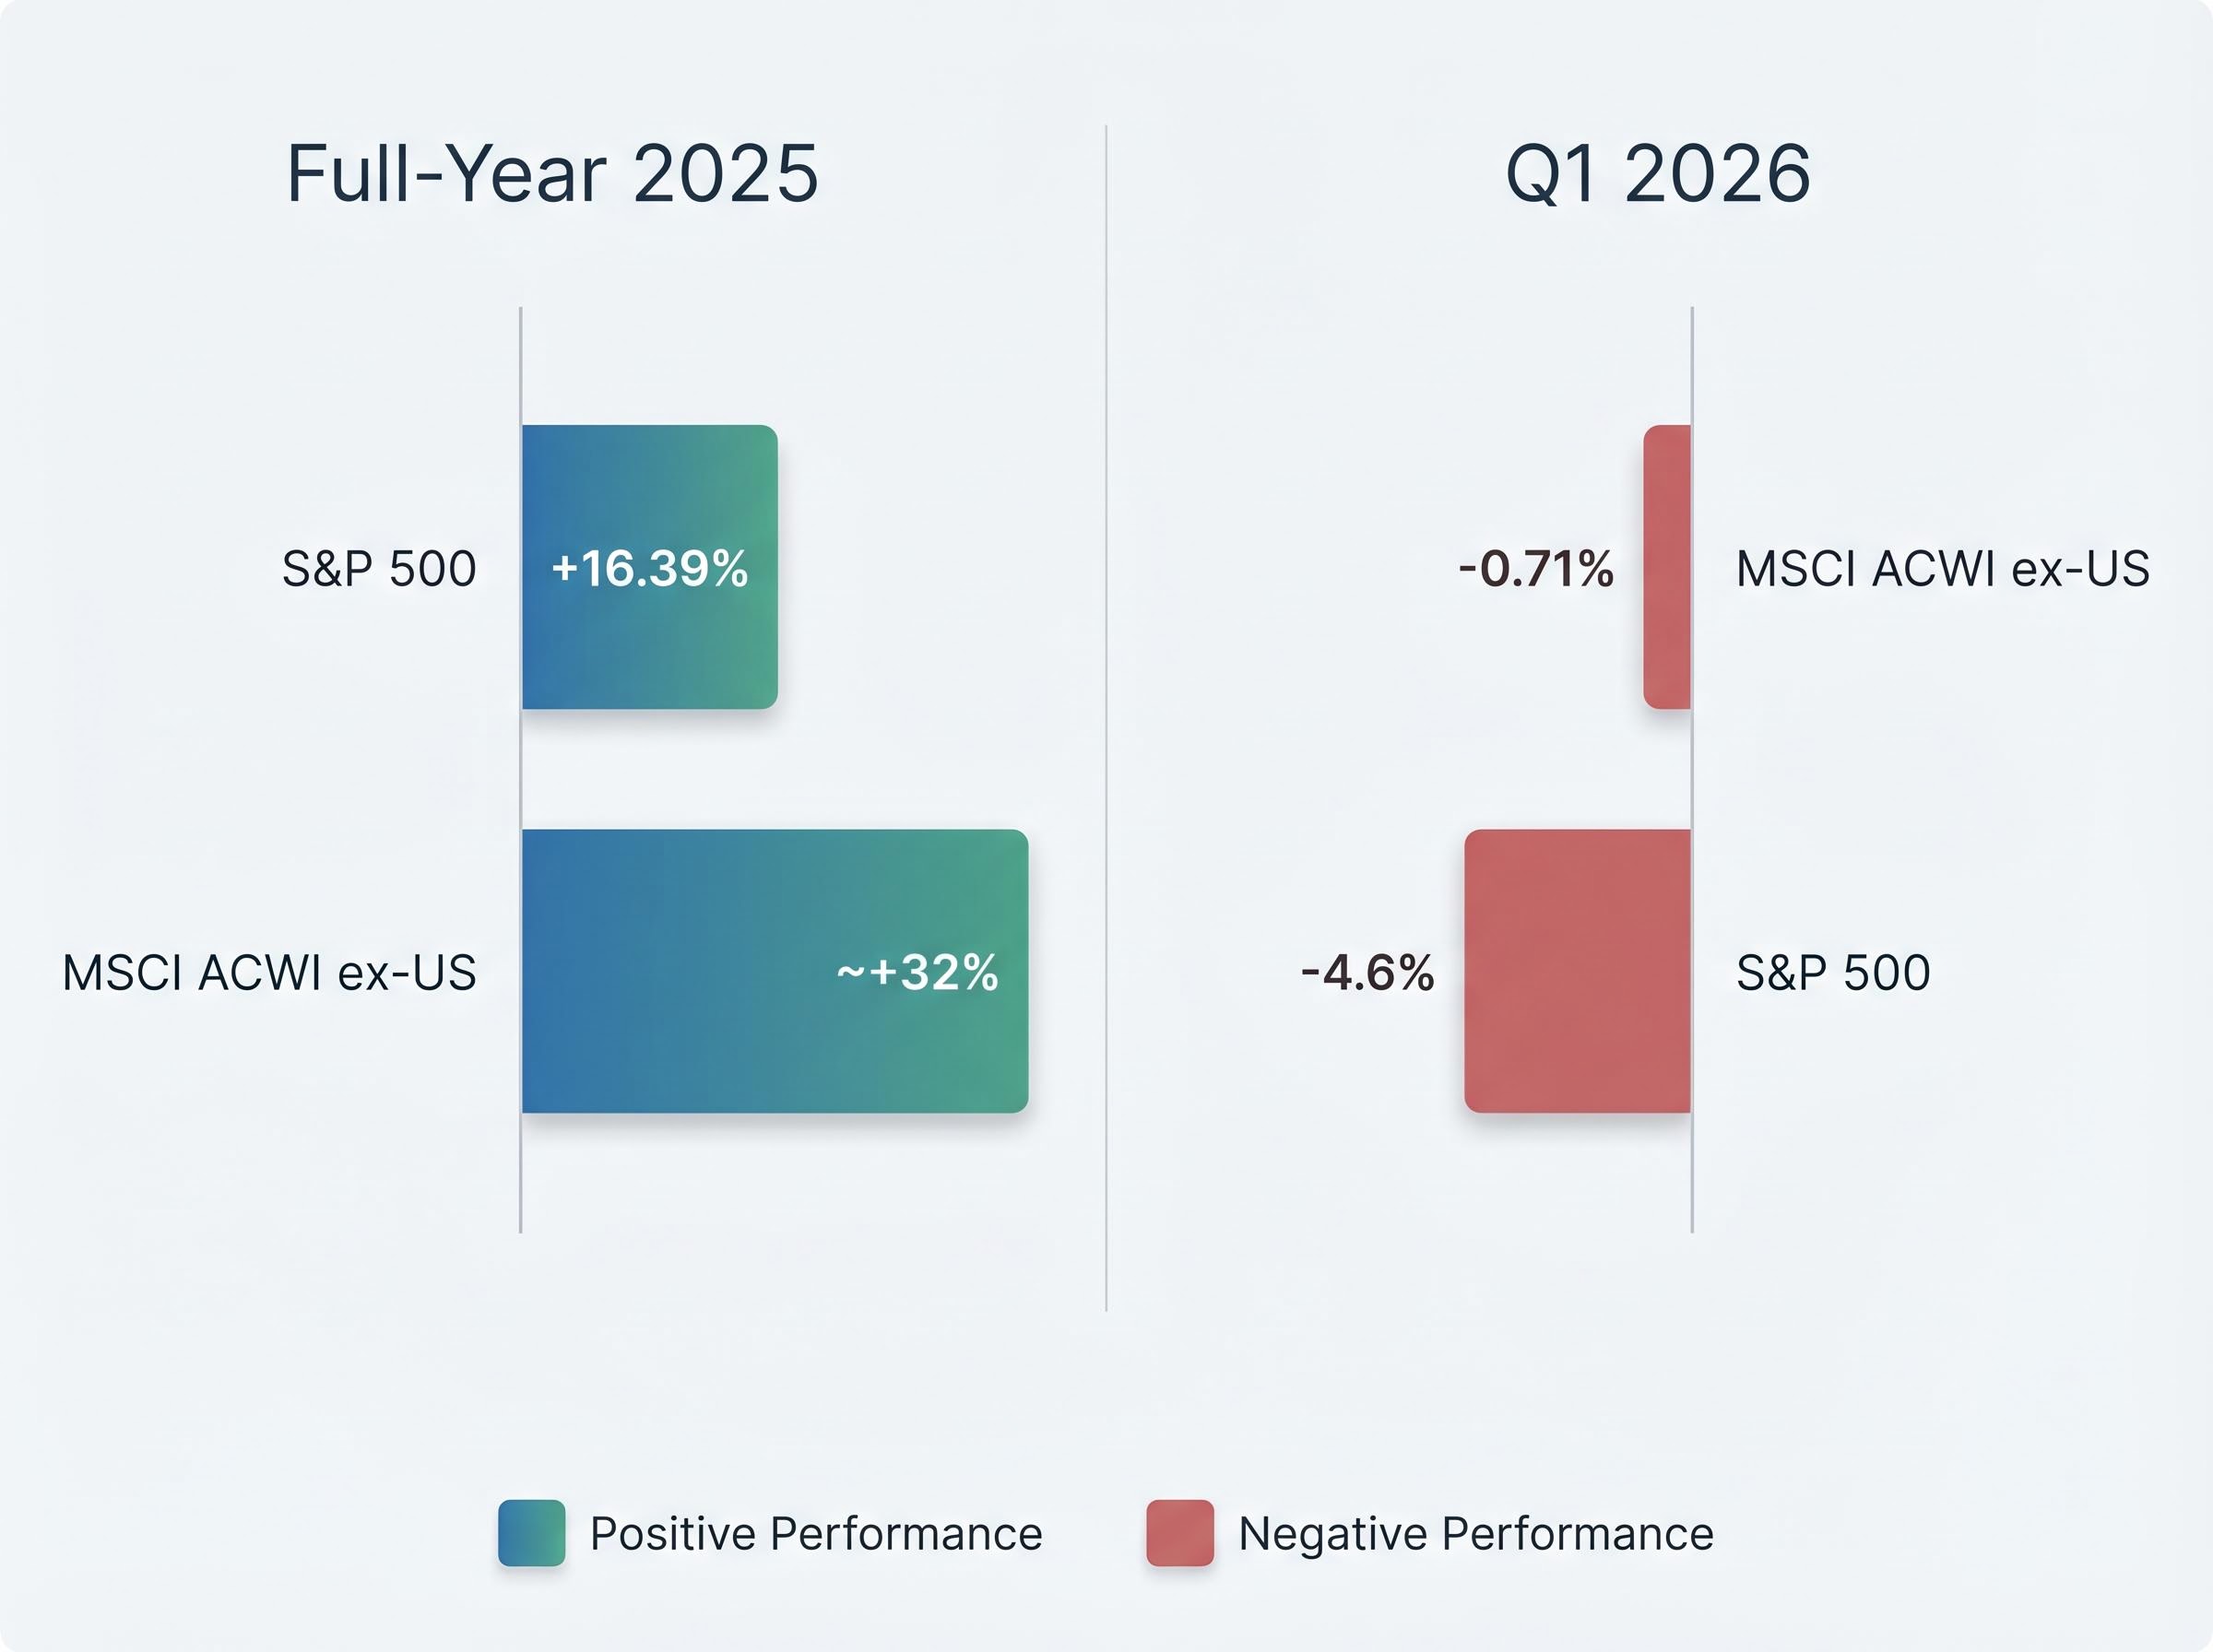
In 2025, international stocks (proxied by MSCI ACWI ex-US) returned approximately +32%. The S&P 500 returned +16.39%. In Q1 2026, the gap persisted: the MSCI ACWI ex-US declined -0.71% while the S&P 500 fell -4.6%.
| Period | S&P 500 Return | MSCI ACWI ex-US Return | Key Driver |
|---|---|---|---|
| Full-Year 2025 | +16.39% | ~+32% | Valuation gap, tariff headwinds for U.S. |
| Q1 2026 | -4.6% | -0.71% | Dollar weakness, commodity surge (Iran war) |
Three macro forces amplified the divergence. First, dollar weakness: the DXY index declined to approximately 98.25 by late April 2026, turning currency into a tailwind for USD-based investors holding international assets. Second, a commodity surge driven by the Iran war beginning in early March 2026, which pushed Brent crude to approximately $106.98/bbl as of 27 April 2026 (averaging approximately $103.1/bbl in March). That surge disproportionately benefited EM energy exporters and international indices with higher commodity-sector weightings. Third, tariff-driven trade flow redirection disadvantaged U.S. equities while certain international markets absorbed redirected demand.
Charles Schwab research on dollar weakness and unhedged international equity returns quantifies how currency translation converts DXY declines into additional percentage points of return for U.S. investors holding foreign assets, making the dollar’s slide to approximately 98.25 a directly measurable component of the 2025-2026 international outperformance story.
U.S.-listed emerging market equity ETFs attracted an estimated $20-25 billion in inflows during the first eight weeks of 2026, exceeding total inflows for all of 2025. The iShares Core MSCI EM ETF (IEMG) alone received approximately $6 billion in January 2026.
That flow data signals institutional conviction, not retail enthusiasm. When capital moves at that scale and velocity, it reflects strategic repositioning by allocators who are repricing the relative opportunity between U.S. and international equities.
The pattern spans two consecutive periods. That distinction matters: one quarter of outperformance can be noise. Two consecutive periods, supported by identifiable structural drivers, suggests something more durable is in motion.
The data above makes the international case compellingly. Intellectual honesty requires presenting the failure modes with equal specificity.
Indonesia’s $190 billion market wipeout following MSCI governance concerns illustrates idiosyncratic EM risk playing out in real time: passive outflows triggered by index reconstitution decisions can compress a market rapidly regardless of broader EM sentiment, and that dynamic is distinct from the country-level political or currency risk that most investors associate with emerging market exposure.
These risks are specific enough to slow a wholesale rotation. The better response is proportionate exposure, not performance-chasing conviction.
The decision is not binary. The question is not “U.S. or international” but what degree of international exposure is consistent with a given investor’s return expectations, risk tolerance, and investment horizon.
Source material suggests a 5% international allocation as a low-friction starting point for investors with no existing international exposure. Fidelity notes that investors are “rediscovering” international stocks following 2025 outperformance, with tailored financial plans increasingly incorporating international allocations. The directional consensus among strategists is clear: reduce U.S. overweight without prescribing a single target number.
Portfolio construction research supports a 5% VXUS allocation as a low-friction starting point precisely because the drawdown math is asymmetric: a 10% decline in VXUS at that weight produces only a 0.5% drag on total portfolio value, while a sustained period of international outperformance compounds into a meaningful contribution.
A tiered vehicle approach aligns exposure with risk tolerance:
The worst version of this analysis is using it to chase two years of international outperformance by rotating wholesale into international equities at current levels. The better version is using it to systematically introduce a structural allocation that reduces U.S. concentration risk, at a time when valuations make the case independently of recent performance.
The U.S. case is legitimate and historically grounded. A decade of compounding evidence supported it. The combination now facing investors is different: a historically wide valuation gap, two consecutive periods of international outperformance, dollar weakness amplifying those gains, and mega-cap concentration risk within the S&P 500. Taken together, these factors make the structural case for some international allocation unusually strong in April 2026.
Investors who spent a decade ignoring international markets made a defensible decision given the evidence available. Investors who ignore the current evidence without examining it are making a different kind of decision. The right question is not whether to include international exposure, but how much, through which vehicles, and with what rebalancing discipline.
This article is for informational purposes only and should not be considered financial advice. Investors should conduct their own research and consult with financial professionals before making investment decisions. Past performance does not guarantee future results. Financial projections are subject to market conditions and various risk factors.
The MSCI EAFE index tracks developed international markets across Europe, Australasia, and the Far East, offering U.S. investors exposure to deep, liquid markets with established regulatory frameworks. It currently trades at a forward P/E of 14.86, significantly cheaper than U.S. equities as measured by the S&P 500 Shiller CAPE of approximately 39.75.
International stocks proxied by the MSCI ACWI ex-US returned approximately 32% in 2025, nearly double the S&P 500 return of 16.39%, with the outperformance gap persisting into Q1 2026 when international markets declined only 0.71% versus a 4.6% drop for the S&P 500.
VXUS (Vanguard Total International Stock ETF) is widely cited as a low-cost starting point, offering broad international exposure at a 0.05% annual expense ratio with top holdings including TSMC, Samsung Electronics, and ASML Holding. For investors seeking higher growth potential, IEMG provides emerging market exposure that BlackRock's iShares unit prefers over developed international for 2026.
When the U.S. dollar weakens, foreign asset returns translate into more dollars when repatriated, adding a currency gain on top of local market returns. The DXY declining to approximately 98.25 by late April 2026 acted as a direct tailwind for U.S. investors holding unhedged international equity positions.
A 5% allocation to broad international exposure via VXUS is suggested as a low-friction starting point for investors with no existing international exposure, as a 10% decline in VXUS at that weight produces only a 0.5% drag on total portfolio value while sustained outperformance compounds into a meaningful contribution. The broader directional consensus among strategists is to reduce U.S. overweight without prescribing a single target number.


