
How Hormuz Closure at $104 Oil Is Reshaping Every Asset Class
2 hrs ago

The S&P 500 forward price-to-earnings ratio sits at 20.68 as of late April 2026. Japan’s Nikkei 225 has gained approximately 16.9% year-to-date. For US investors holding only domestic equities, that divergence is not a distant warning signal. It is already visible in returns.
After more than a decade of US equity dominance, a convergence of elevated valuations, geopolitical friction, federal debt concerns, and desynchronised global business cycles is prompting institutional asset managers, including BlackRock, Fidelity, Charles Schwab, and Morningstar, to advocate revisiting geographic diversification. This is not a call to abandon American equities. It is a case for a modest, deliberate complement to them.
What follows walks through the structural argument for adding a small international allocation now, examines the specific regions and catalysts driving non-US outperformance in 2026, acknowledges the real risks involved, and closes with a practical starting framework accessible to everyday US investors.
The case for US-only investing has been compelling for good reason. The S&P 500 delivered a cumulative total return of 305% over the decade ending 23 April 2026, according to analysis by Motley Fool’s Neil Patel. Berkshire Hathaway has compounded at roughly 20% annualised across six decades. American enterprise has rewarded patient capital more consistently than any other single-country equity market over that span.
The tension: The S&P 500 returned 305% over the past decade, yet its forward P/E now stands at 20.68, a valuation level exceeded only during the dot-com era. What the past delivered and what the price now implies are two different conversations.
That success, however, has priced itself into the present. A forward P/E of 20.68 places US equities near historically elevated territory, with only the late-1990s dot-com era representing a more expensive period. A significant portion of recent index-level gains has been concentrated in the Magnificent Seven technology names, meaning the valuation risk itself is concentrated rather than broadly distributed.
The FactSet S&P 500 earnings season data for April 2026 places the forward 12-month P/E ratio at 20.9, above both the five-year average of 19.9 and the ten-year average of 18.9, confirming that current US equity valuations sit at a meaningful premium to their own historical norms rather than simply reflecting a changed structural environment.
Elevated valuations do not guarantee poor outcomes. They do, however, compress the margin for error. The probability distribution of future returns narrows when the starting price is high, and for US investors whose entire equity allocation sits inside that distribution, the question of geographic diversification becomes less theoretical than it was five years ago.
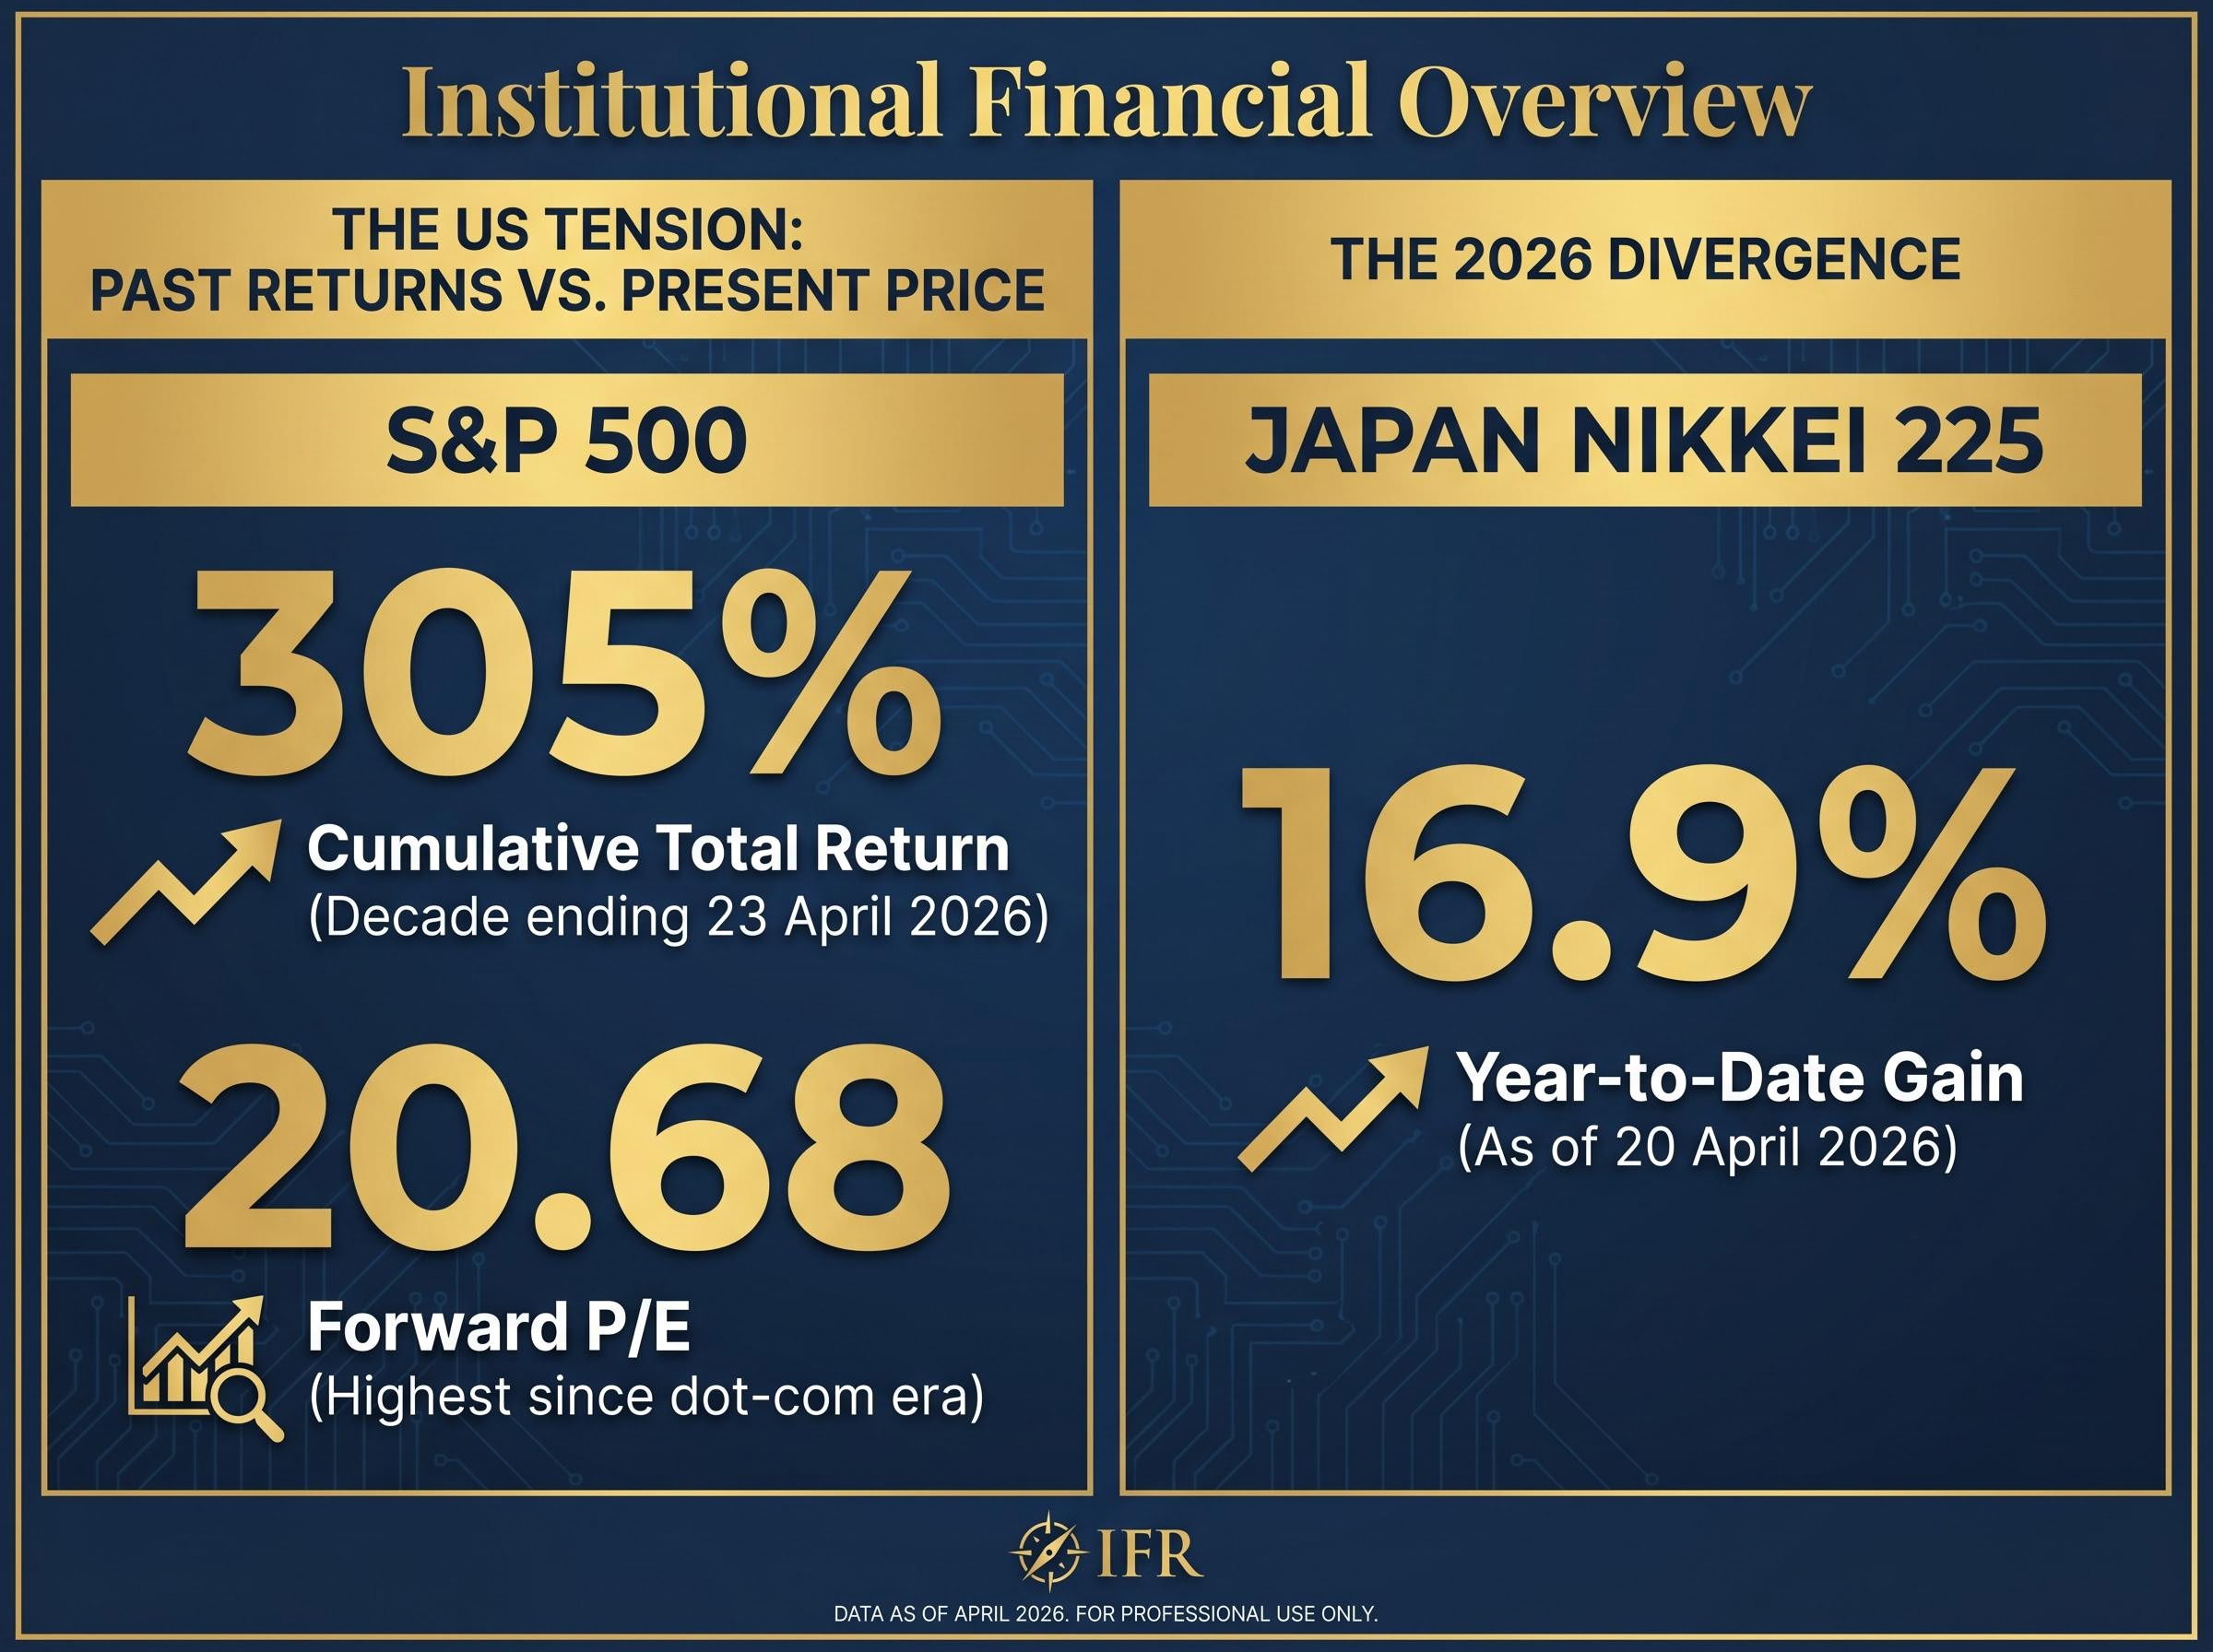
The performance divergence in 2026 is not a single data point. Japan’s Nikkei 225 gained approximately 16.9% year-to-date as of 20 April 2026, while the S&P 500 delivered flat or minimal gains over the same period. That gap is wide enough to reshape return assumptions, and it is being driven by distinct, region-specific catalysts rather than a generic “cheap stocks catching up” narrative.
Japan’s rally reflects structural change, not sentiment. Corporate governance reforms have accelerated shareholder return improvements, with Japanese companies unwinding cross-shareholdings and increasing buybacks at a pace not seen in prior cycles. Reflation dynamics have added a domestic demand component that was absent during the country’s deflationary decades.
Europe’s gains rest on a different foundation: defence spending increases following shifting geopolitical postures, German election outcomes that cleared fiscal policy uncertainty, and domestic bank fundamentals that have strengthened materially since 2023. These are structural shifts in capital allocation, not purely cyclical rebounds.
EM Asia has benefited from earnings growth tied to AI infrastructure investment, with geographic capital reallocation favouring the region’s semiconductor and hardware supply chains. China’s re-rating has been driven by profitability gains and AI infrastructure spending, though volatility remains elevated. Latin America, particularly Brazil, has captured trade-diversion tailwinds from US tariff policy, positioning the region as a beneficiary of reshuffled global supply chains.
EM returns carry higher volatility and remain sensitive to dollar episodes, a reality that moderated flows into South Korea and Brazil after a strong January.
Currency volatility in EM Asia during geopolitical episodes illustrates how quickly the two risk dimensions compound: the South Korean won fell 0.6% in a single session after a naval incident in the Strait of Hormuz sent WTI crude surging nearly 6%, with north Asian currencies insulated by lower energy import dependency while south Asian currencies faced simultaneous pressure from dollar strength and rising oil prices.
| Region | Primary catalyst | 2026 outlook note |
|---|---|---|
| Japan | Corporate governance reforms, reflation | Nikkei 225 up ~16.9% YTD |
| Europe | Defence spending, bank fundamentals | Structural fiscal expansion underway |
| China | Profitability gains, AI infrastructure | Re-rating in progress; volatility elevated |
| Latin America | Trade-diversion tailwinds (tariff policy) | Brazil positioned as primary beneficiary |
| EM Asia | Earnings growth, AI hardware supply chain | Strong inflows, moderated by dollar volatility |
Many US investors diversify across technology, healthcare, and financials while remaining entirely exposed to US-specific fiscal, monetary, and political risk. Sector rotation addresses industry concentration. It does not address country concentration. Geographic diversification hedges a different risk dimension altogether.
The structural logic is straightforward: non-US equities have a lower correlation to US equity returns than most domestic sector tilts. When non-synchronised business cycles are at work, as they are now, with Europe, Japan, and parts of emerging markets at earlier expansion stages than the US, the diversification benefit compounds. Fidelity’s Asset Allocation Research Team describes these desynchronised cycles as the core engine of international diversification value, separate from the valuation argument.
Charles Schwab frames geographic diversification as a “free lunch” in portfolio construction, citing the combination of low correlation with US equities alongside meaningful current return potential across developed and emerging international markets.
Morningstar’s historical analysis reinforces the point. Extended cycles of international outperformance occurred in the 1970s, 1980s, and 2000s, periods when US equity dominance faded for years at a time. The valuation discount of non-US equities versus the S&P 500 remains meaningful across both developed and emerging markets, even after 2025-2026 gains.
Geographic diversification specifically hedges risks that sector diversification cannot:
Currency risk comes first because it is the most immediate and least intuitive. Unhedged international ETFs expose US investors to local currency fluctuations that can amplify or offset equity market gains in any given quarter. The rangebound dollar of early 2026 has been broadly supportive of unhedged international returns, but that is a cyclical condition, not a structural guarantee.
Hedged ETF share classes, available through providers including iShares and Vanguard, remove most currency fluctuation from the return equation. They carry a cost, typically reflected in a modestly higher expense ratio and the drag of rolling currency forwards. Most long-term diversification arguments assume unhedged exposure, on the basis that currency effects wash out over full market cycles. Investors with a strong dollar outlook or a shorter time horizon may find hedged vehicles more appropriate.
Geopolitical and trade policy risk deserves specificity rather than a broad label. US tariff escalations on steel, aluminium, and copper imports remain active as of April 2026, with ongoing litigation creating uncertainty for individual market trajectories. The trade-diversion tailwinds benefiting Latin America depend on the durability of current tariff structures, which is not assured.
Emerging market risks are distinct from developed international risks. EM equities carry amplified exposure to dollar strength episodes, geopolitical flashpoints, and liquidity differences. Flows into South Korea and Brazil moderated after a strong January 2026 start as dollar volatility increased, illustrating that EM returns are structurally more volatile even when the trend is positive.
Emerging market index classification risk adds a dimension beyond price volatility: Indonesia shed US$190 billion in equity market value after MSCI flagged governance concerns in January 2026, with passive outflows triggered by the removal of specific tycoon-linked stocks from MSCI indexes illustrating how index reconstitution events can compress returns in ways unrelated to underlying business fundamentals.
A 5% portfolio allocation to international equities represents a practical entry point: large enough to provide meaningful geographic diversification, small enough to avoid materially disrupting an existing domestic-oriented portfolio. The research framing from multiple institutional sources supports this as a reasonable starting position.
Two broad international ETFs stand out for accessibility and cost. The Vanguard Total International Stock ETF (VXUS) carries an expense ratio of 0.05%, with a share price of $82.36 as of 27 April 2026 and a 52-week range of $63.23 to $84.48. Its largest holdings include Taiwan Semiconductor, Samsung Electronics, and ASML Holding, providing exposure to both developed and emerging international markets in a single vehicle. The iShares Core MSCI Total International Stock ETF (IXUS) offers comparable broad international coverage and is recommended by BlackRock as a geographic diversification vehicle for US retail investors.
For investors seeking to overweight the emerging markets opportunity specifically, the iShares Core MSCI Emerging Markets ETF (IEMG) attracted approximately $4 billion in January 2026 inflows alone, reflecting strong institutional and retail interest. Its volatility profile is higher than broad international funds.
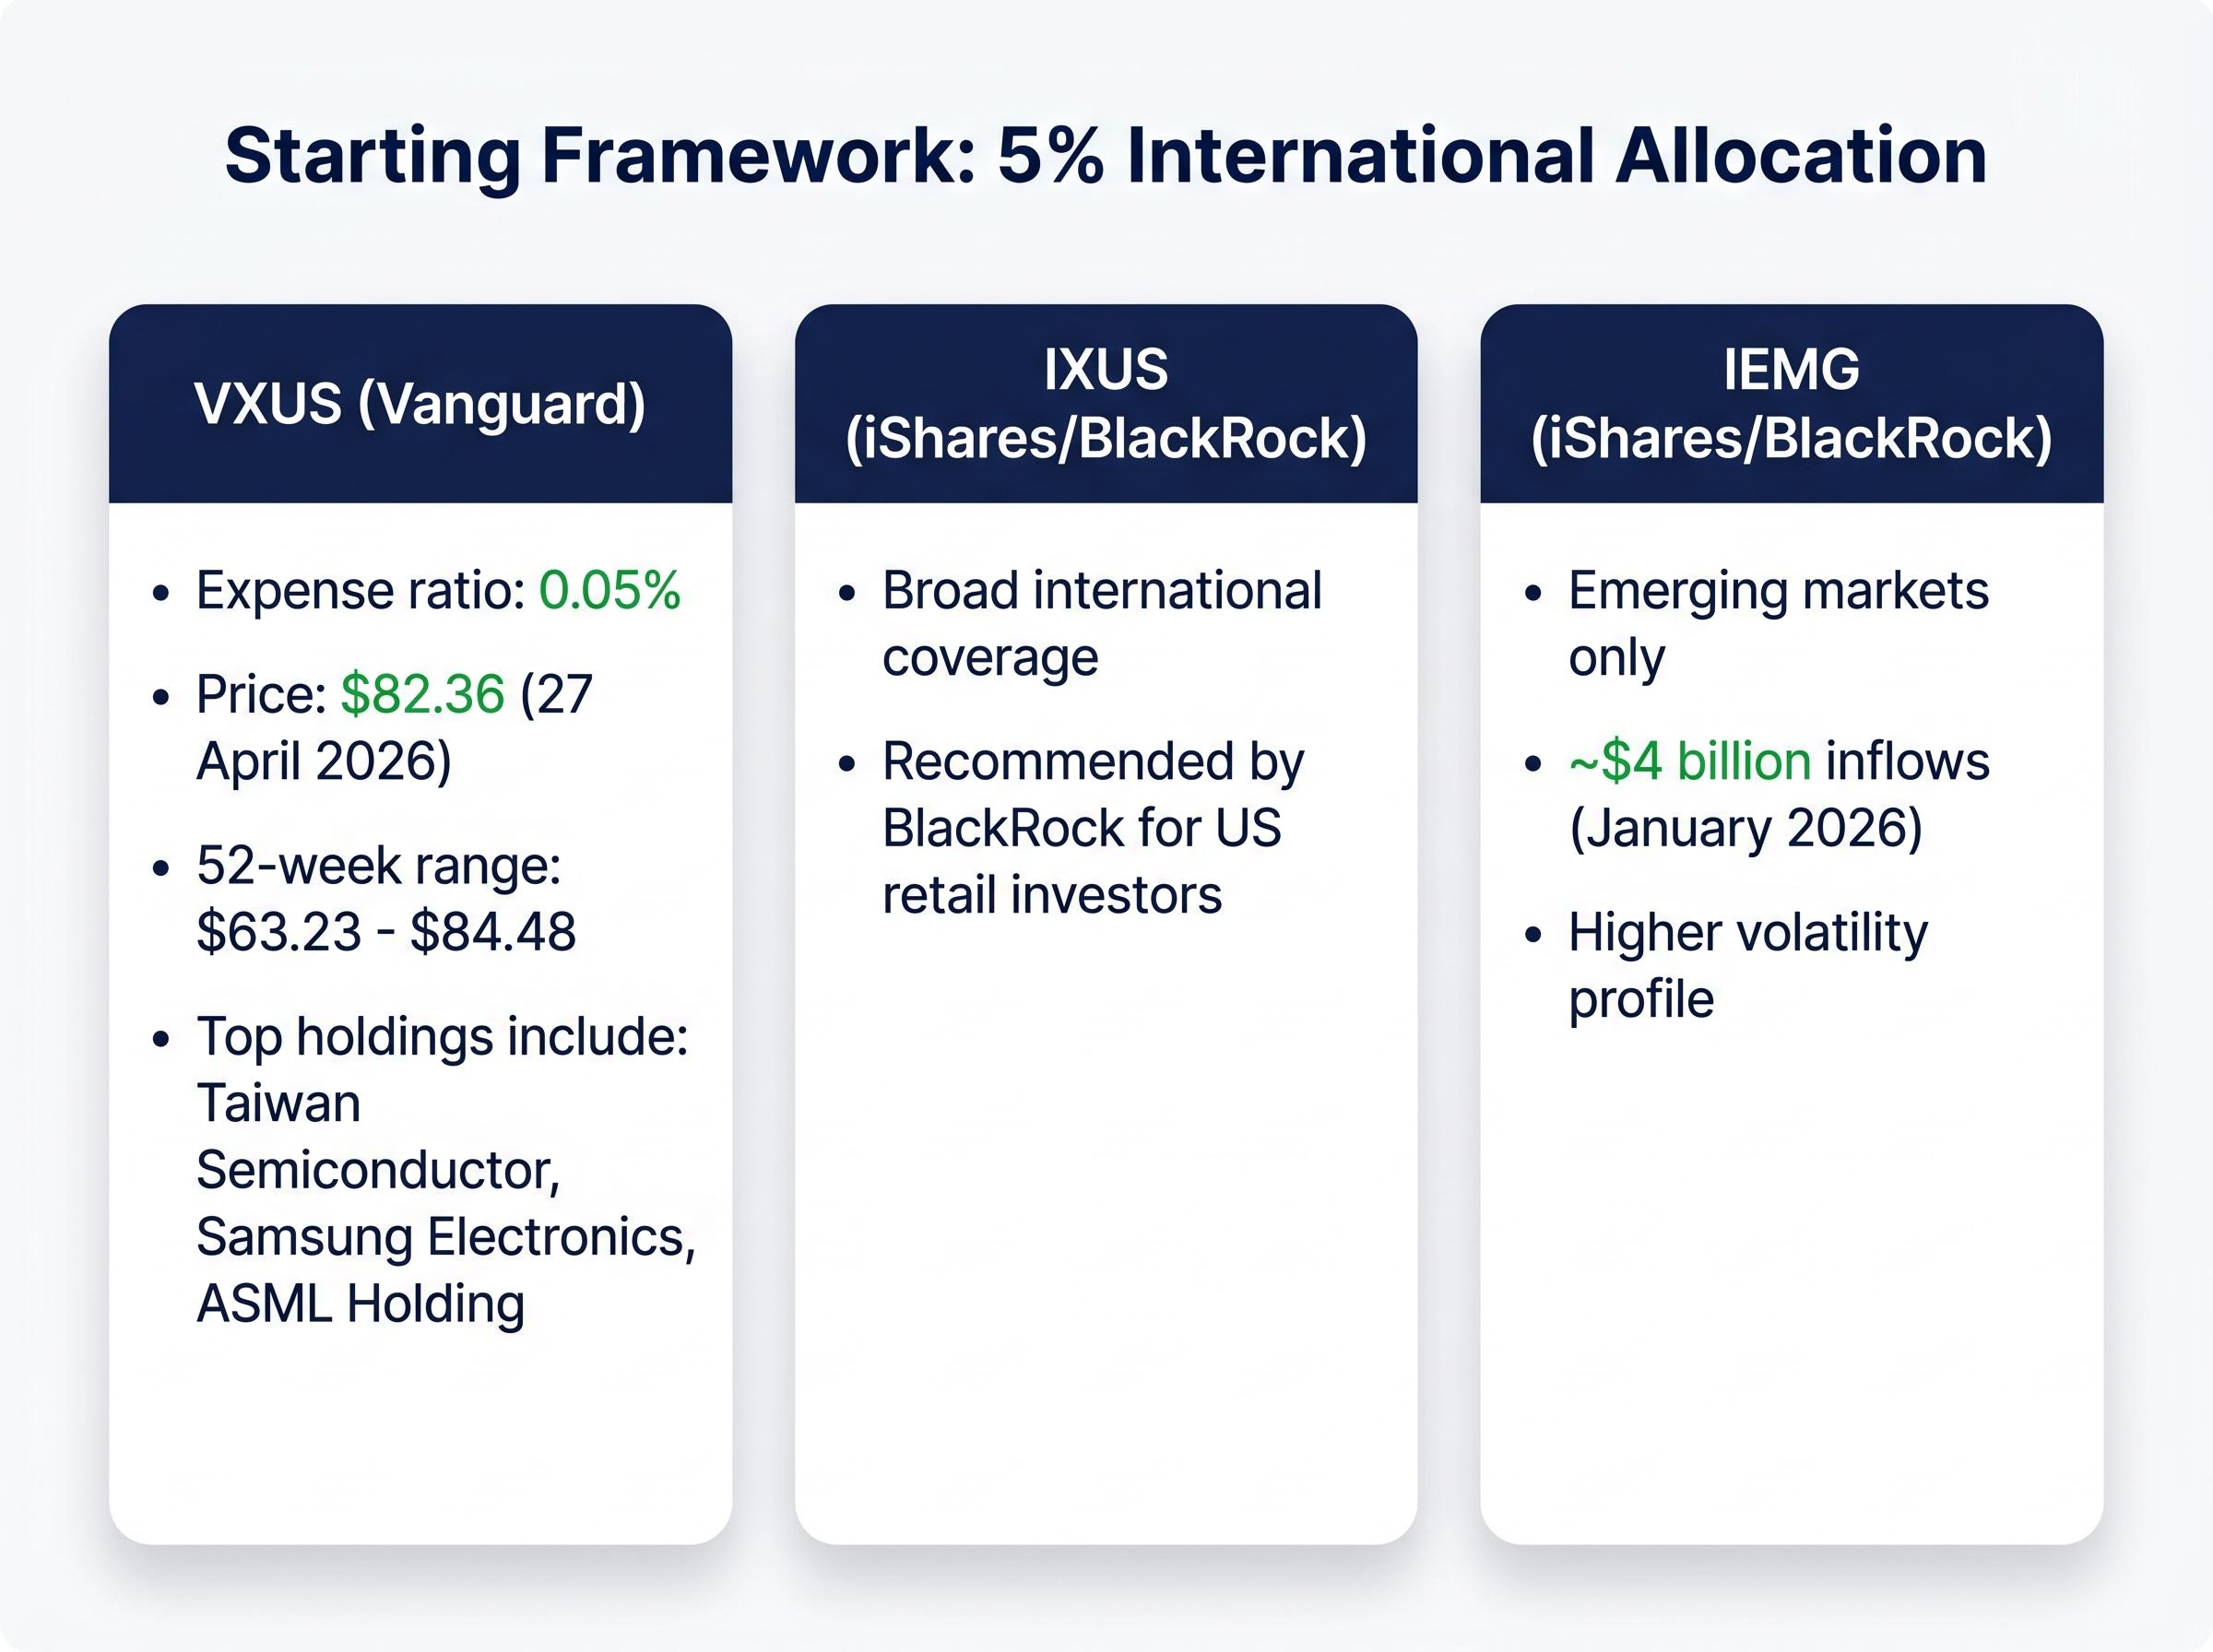
| ETF ticker | Issuer | Expense ratio | Coverage scope | 2026 positioning note |
|---|---|---|---|---|
| VXUS | Vanguard | 0.05% | Broad international (developed + EM) | Lowest-cost broad international vehicle |
| IXUS | iShares (BlackRock) | Low-cost | Broad international (developed + EM) | BlackRock-recommended for US retail |
| IEMG | iShares (BlackRock) | Low-cost | Emerging markets only | ~$4B Jan 2026 inflows; higher volatility |
Practical implementation considerations include:
IRS Publication 514 guidance on the foreign tax credit for individuals outlines the eligibility conditions, calculation methods, and carryover rules that apply when US taxpayers receive dividends from foreign securities, including the distinction between taking the credit and taking a deduction, which affects after-tax return calculations for international ETF holders.
The case for adding a modest international allocation in April 2026 rests on converging evidence rather than a single data point: elevated US valuations at a forward P/E of 20.68, demonstrated non-US outperformance year-to-date, desynchronised global business cycles, structural reform catalysts across Japan and Europe, and consistent institutional advocacy from BlackRock, Fidelity, Schwab, and Morningstar. The risks, particularly currency exposure and EM volatility, are real and require informed sizing rather than avoidance.
A 5% starting allocation through a low-cost vehicle such as VXUS or IXUS does not require abandoning confidence in American enterprise. It requires acknowledging that the global opportunity set extends beyond the S&P 500, and that at current valuations, the cost of ignoring it may be higher than it has been for many years.
Investors considering this move should review their current domestic equity concentration, confirm brokerage access to international ETFs, and consult IRS Publication 514 for guidance on foreign tax credit treatment before initiating a position.
This article is for informational purposes only and should not be considered financial advice. Investors should conduct their own research and consult with financial professionals before making investment decisions. Past performance does not guarantee future results. Financial projections are subject to market conditions and various risk factors.
Geographic diversification means spreading equity holdings across multiple countries rather than concentrating in one market. In 2026, it matters because US equities trade at elevated valuations (forward P/E of 20.68) while non-US markets including Japan and Europe are posting stronger year-to-date returns, creating a meaningful performance divergence.
A 5% allocation to international equities is cited by institutional sources as a practical starting point: large enough to provide meaningful geographic diversification, yet small enough to avoid disrupting an existing domestic-oriented portfolio.
The Vanguard Total International Stock ETF (VXUS) offers broad international coverage at a 0.05% expense ratio, while the iShares Core MSCI Total International Stock ETF (IXUS) is recommended by BlackRock for US retail investors seeking similar diversification.
The primary risks include currency fluctuations on unhedged ETFs, geopolitical and trade policy uncertainty, and higher volatility in emerging markets, which are more sensitive to dollar strength episodes and liquidity differences than developed market funds.
Non-US outperformance in 2026 is driven by distinct regional catalysts: corporate governance reforms and reflation in Japan, defence spending and stronger bank fundamentals in Europe, and AI infrastructure investment driving earnings growth across EM Asia.


