
How Dual-Class Shares Put $24 Billion in Gulf Capital at Arm’s Length
22 hrs ago

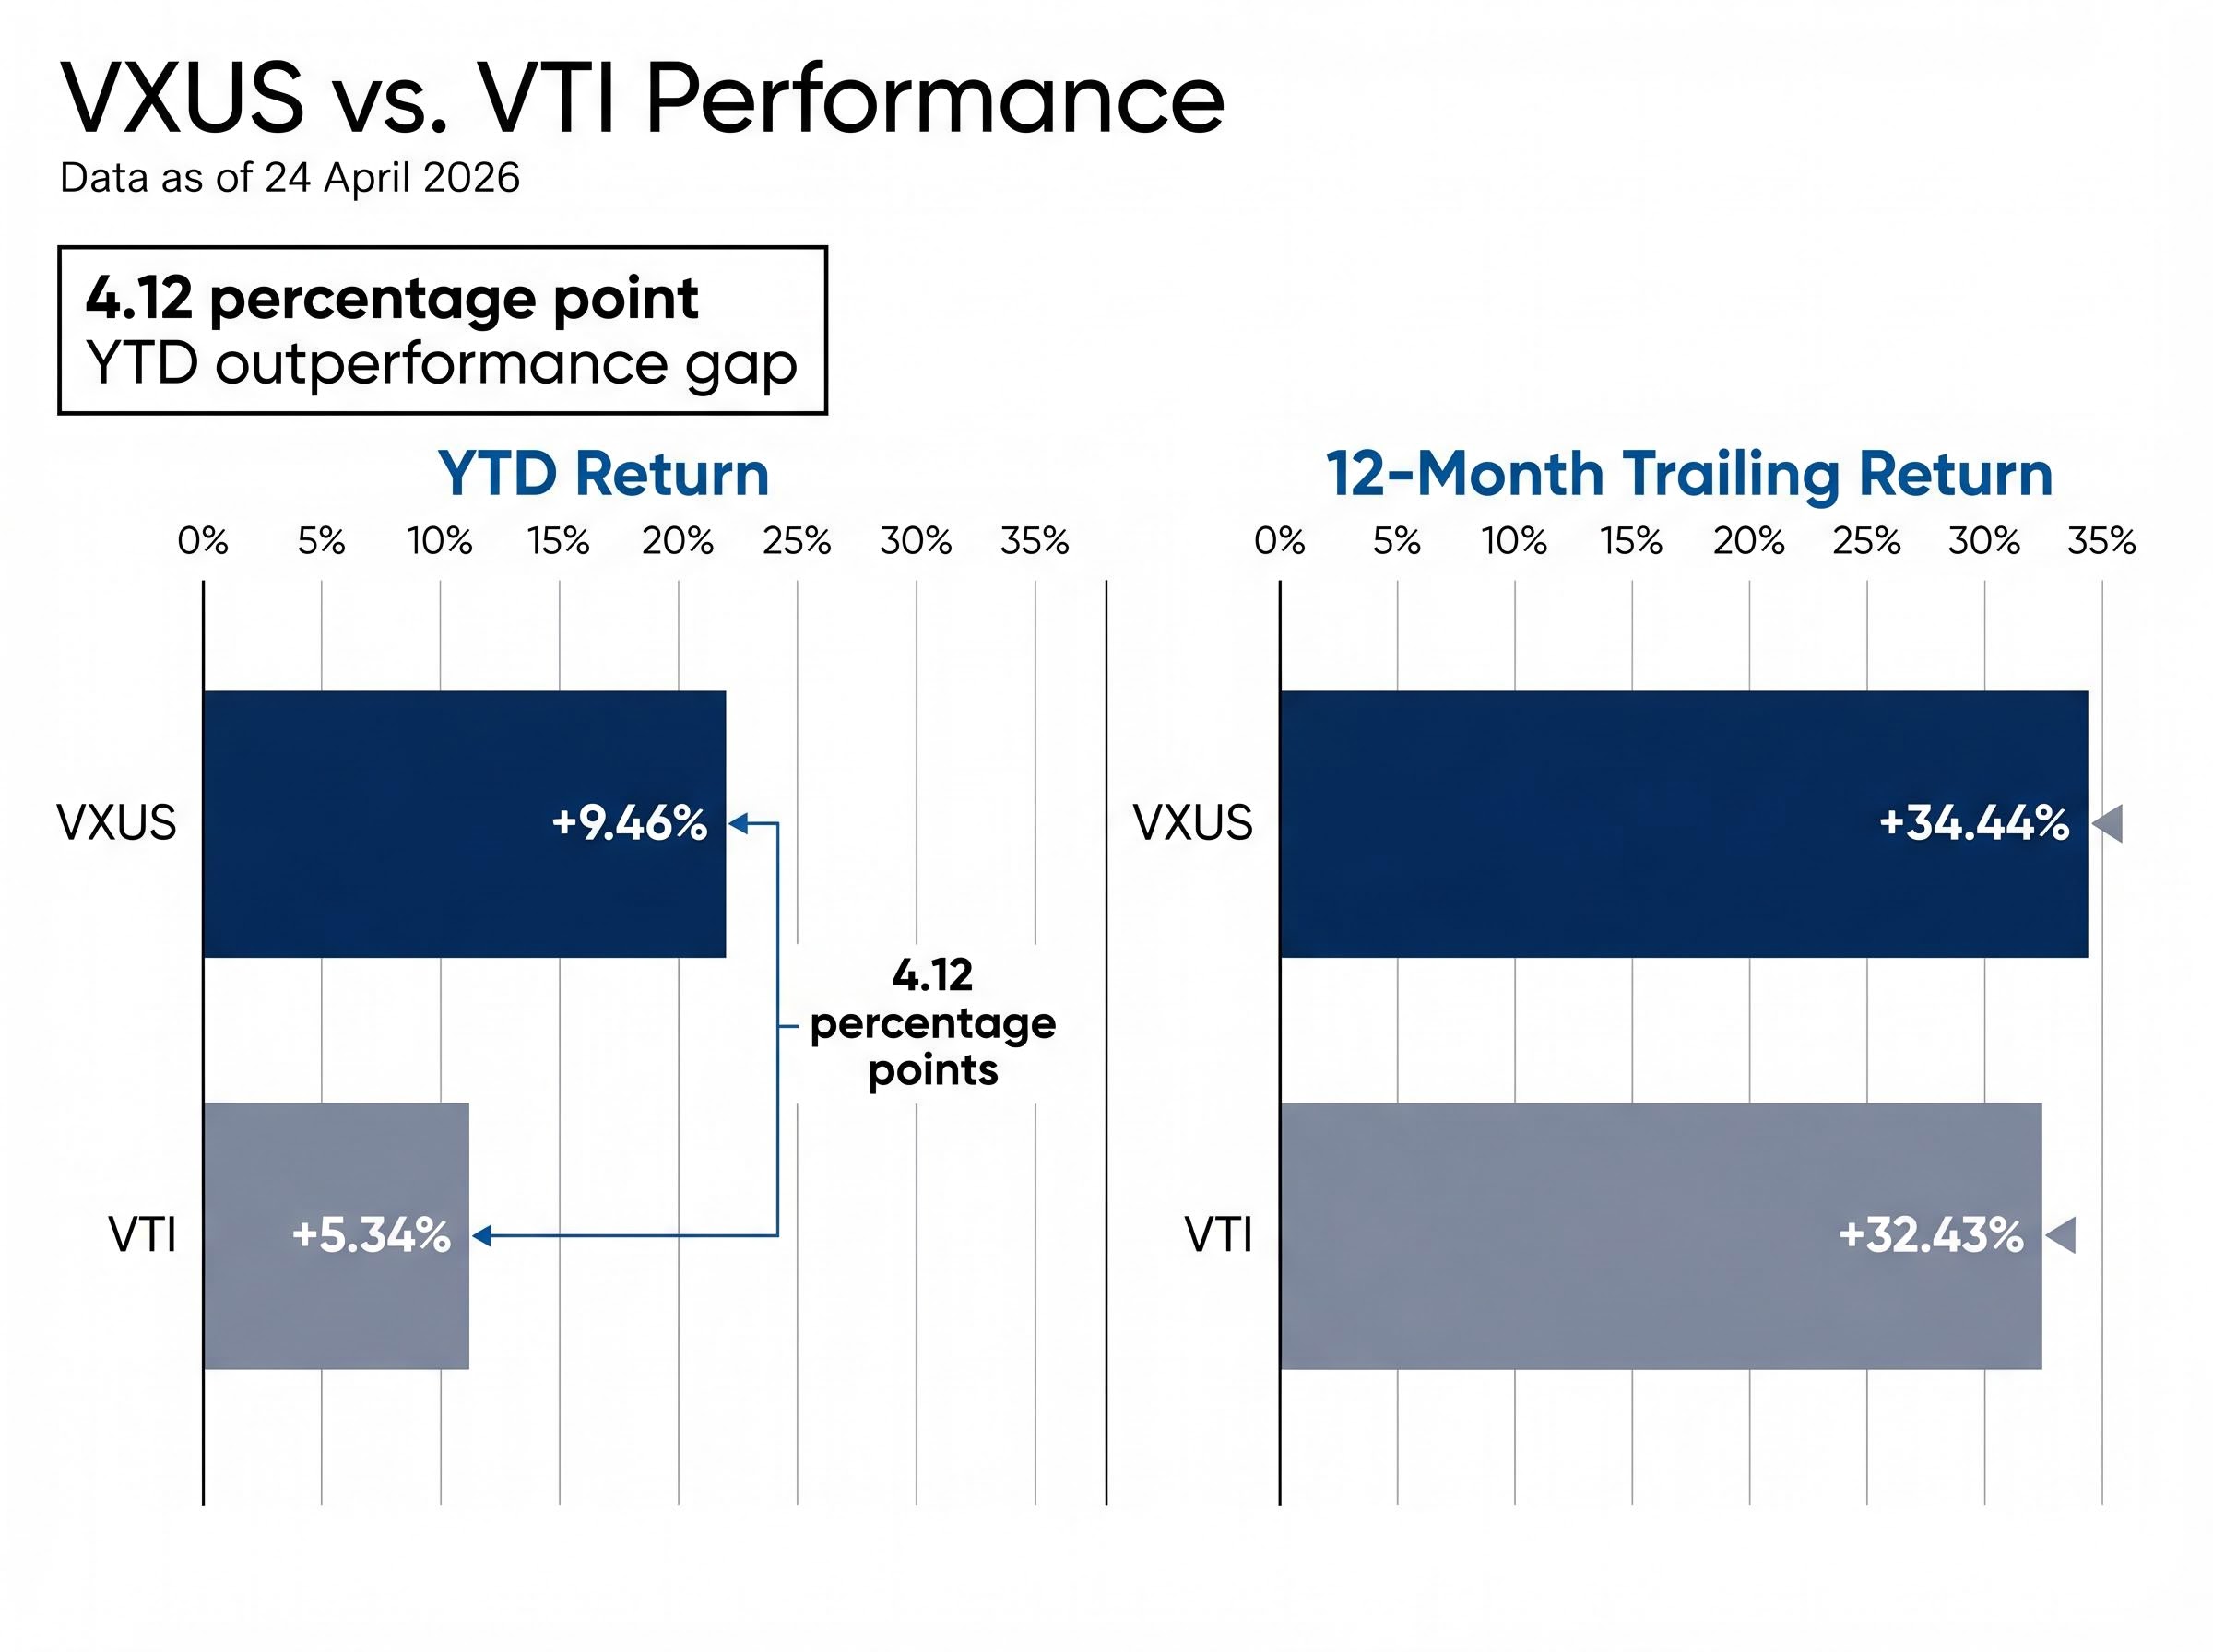
Vanguard’s VXUS ETF is up 9.46% year-to-date as of 24 April 2026. Over the same period, the U.S. total market, measured by VTI, has returned 5.34%. International equities are not merely serving as a diversification hedge this year; they are outperforming outright.
For years, U.S. investors absorbed a familiar message: international exposure was theoretically sound but practically expensive in foregone returns. In 2026, that calculation has shifted in measurable terms. Dollar weakness, valuation gaps between U.S. and non-U.S. equities, and sustained rotation out of mega-cap technology have combined to create conditions where broad international holdings are generating real portfolio value. VXUS, with its 0.05% expense ratio and 8,794 underlying securities, has become the single-trade answer for investors seeking that exposure. What follows is an analysis of what the fund holds, how it is priced relative to its range, how it compares against direct competitors, and what the macro environment means for investors evaluating an allocation in late April 2026.
$582.3 billion in total net assets as of 31 March 2026, making VXUS one of the largest ETFs in existence.
That figure is not just a measure of popularity. It reflects the depth of liquidity available to investors entering and exiting positions, and it anchors the fund’s ability to track its benchmark, the FTSE Global All Cap ex U.S. Index, with minimal tracking error. VXUS trades on NASDAQ under the ticker VXUS and holds 8,794 individual securities as of 31 March 2026.
The top holdings illustrate where global economic weight concentrates outside U.S. borders:
These three names reveal a fund tilted toward global technology and industrial leadership, not simply a basket of developed-market dividend payers. The breadth of 8,794 securities means single-company and single-country risk is structurally diluted across virtually every publicly traded non-U.S. company.
At $82.36 as of 27 April 2026, VXUS is trading near the top of its 52-week range of $63.23 to $84.48. That places the fund approximately 97% of the way to its 52-week high. For momentum-oriented investors, proximity to the high signals continued strength in the underlying trend. For value-oriented investors, it raises the question of whether the current entry point leaves sufficient margin.
Investors evaluating whether to enter VXUS near its 52-week high will find our dedicated guide to ETF volatility metrics covers the specific beta and maximum drawdown calculations that reveal how a fund behaves during stress periods, providing a quantitative framework for assessing whether the current entry point aligns with their risk tolerance.
At 0.05%, confirmed as of 27 February 2026, VXUS sits among the cheapest international equity ETFs available. This is not a promotional rate. It is a structural feature of the fund’s design.
The number looks small in isolation. Applied over a decade of compounding, it becomes material. Consider a hypothetical $50,000 investment held for 10 years, assuming a 7% annualised return:
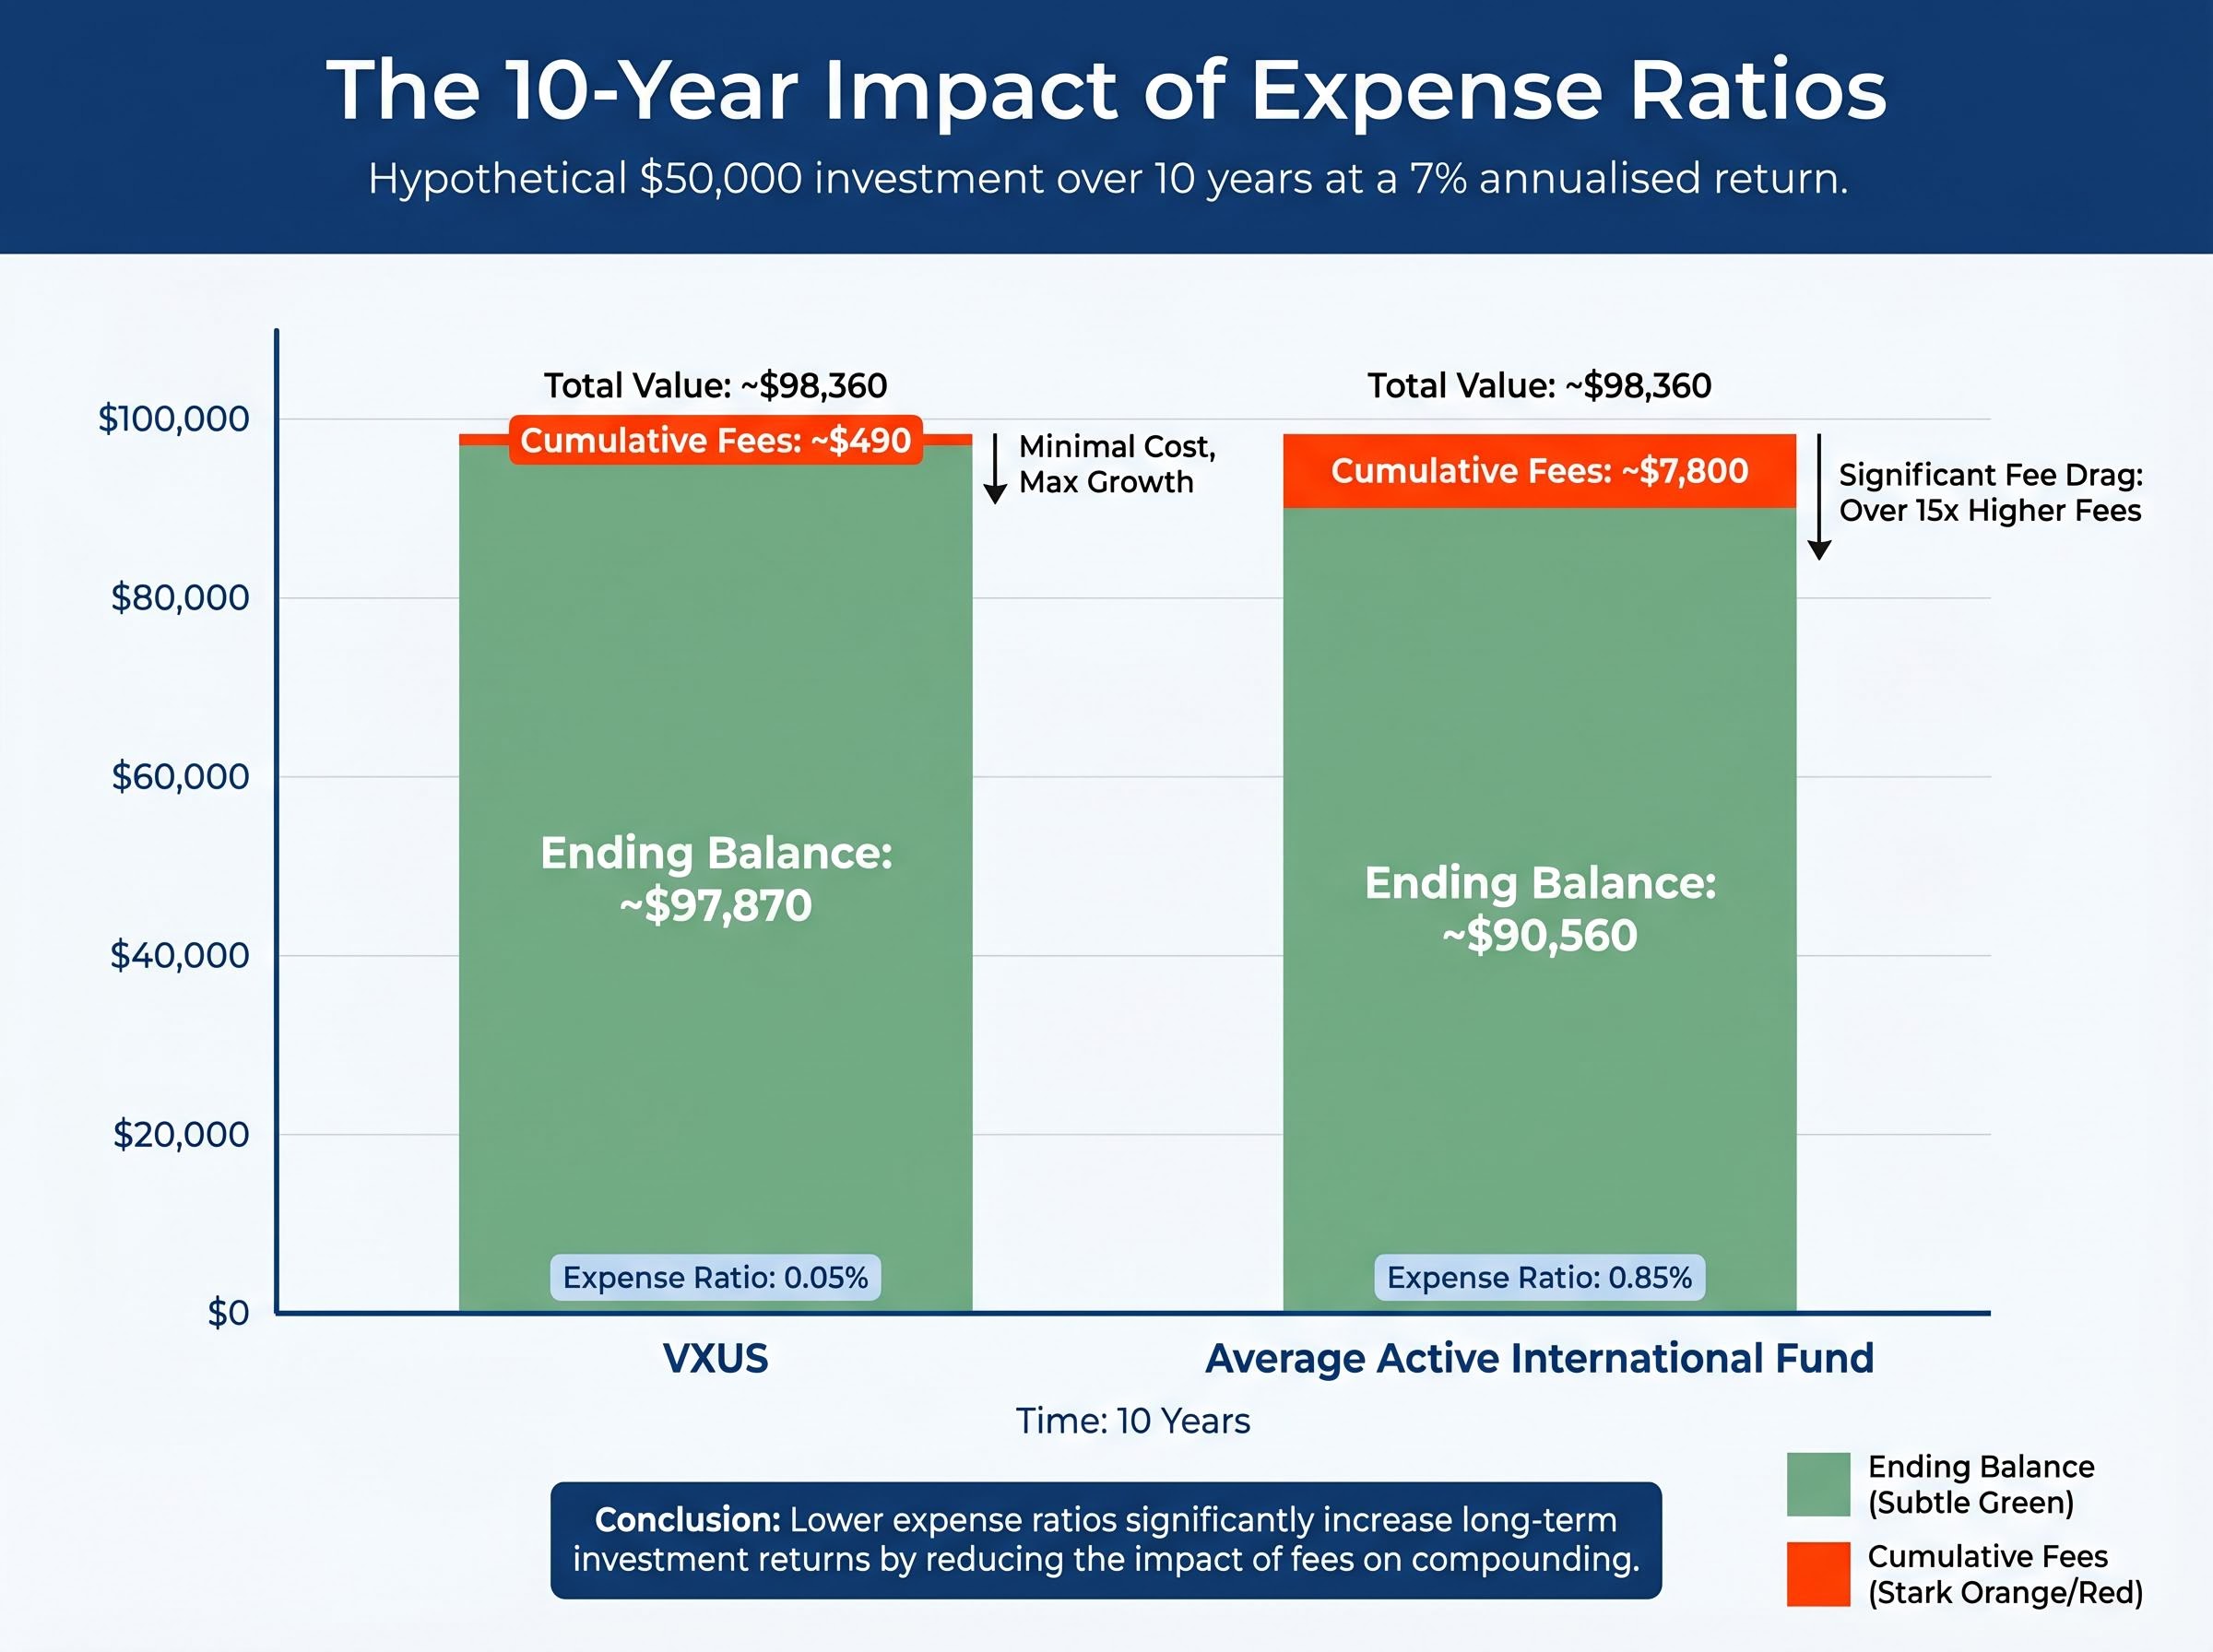
| Fund Type | Expense Ratio | Cumulative Fees (10 Years) | Ending Balance |
|---|---|---|---|
| VXUS | 0.05% | ~$490 | ~$97,870 |
| Average Active International Fund | 0.85% | ~$7,800 | ~$90,560 |
Every basis point not paid in fees stays invested and compounds alongside the underlying portfolio. Over two decades, that gap widens further.
Dividend yield: 2.99% as of April 2026, with the most recent quarterly distribution of $0.0795 per share declared on 18 March 2026 and paid on 24 March 2026. The next distribution is expected in June 2026.
The income component adds a layer of return that compounds alongside capital appreciation, supporting the fund’s appeal for retirement-focused and income-oriented portfolios.
Geographic diversification reduces portfolio risk by spreading exposure across economies that operate on different interest rate cycles, fiscal policies, currencies, and political conditions. Because these variables do not move in lockstep, international and domestic equities often respond differently to the same global events. The result is a portfolio whose overall volatility is lower than the sum of its parts.
One mechanism that amplifies international returns for U.S. holders is currency translation. VXUS holds assets denominated in euros, yen, won, and dozens of other currencies. When the U.S. dollar weakens against those currencies, the dollar value of those holdings rises, even if the underlying asset prices are flat in local terms. The U.S. Dollar Index (DXY) sat at approximately 99.33 on 27 April 2026, confirming sustained dollar weakness through early 2026 and acting as a structural tailwind for international equity returns.
The outperformance gap: approximately 4.12 percentage points. VXUS returned +9.46% year-to-date versus VTI’s +5.34% as of 24 April 2026.
| Metric | VXUS | VTI |
|---|---|---|
| YTD Return | +9.46% | +5.34% |
| 12-Month Trailing Return | +34.44% | +32.43% |
| Expense Ratio | 0.05% | 0.03% |
Analysts have framed this outperformance as part of a structural repricing cycle rather than short-term noise, reflecting a broader rotation away from U.S. mega-cap technology dominance. For investors who were told for years that international diversification was theoretically sound but practically unrewarding, the 2026 data provides a concrete counter-example. The Motley Fool has recommended a starting allocation of 5% of portfolio value for U.S. investors new to international diversification as an initial position.
The international stock rotation out of U.S. equity funds has been substantial in scale: $75 billion left U.S. equity strategies over the six months through February 2026, a figure that reflects institutional conviction rather than retail sentiment alone.
The performance data arrives first, and it tells a clear story: there is almost no difference.
| ETF | YTD Return | 12-Month Trailing Return |
|---|---|---|
| VXUS | 9.46% | 34.44% |
| IXUS | 9.49% | 34.77% |
| VEU | 9.44% | 34.18% |
The year-to-date performance differential sits within 0.05 percentage points. On a 12-month trailing basis, the spread widens to just 0.59 percentage points. Returns alone are an unreliable basis for choosing among the three.
The variables that actually differentiate these funds are structural:
FTSE Russell’s methodology for classifying South Korea as a developed market places that country’s equities inside the developed-market sleeve of the index that VXUS tracks, while MSCI retains South Korea in its emerging market classification, a divergence that produces a measurable difference in country-level exposure between VXUS and IXUS even when both funds appear to track broadly equivalent universes.
For most U.S. retail investors, the choice among these three funds is effectively a preference decision, with VXUS holding a structural edge in scale and liquidity.
As of 31 March 2026, VXUS’s regional allocation breaks down as follows:
| Region | Allocation |
|---|---|
| Europe | 37.50% |
| Pacific | 26.90% |
| Emerging Markets | 26.40% |
| North America (ex-U.S.) | 8.30% |
| Middle East | 0.90% |
Europe and Pacific together account for over 64% of the fund, placing the majority of VXUS’s weight in developed markets with deep capital markets and established regulatory frameworks. The 26.40% emerging markets allocation adds growth optionality, though it also introduces geopolitical and currency risk specific to those regions. This is a known characteristic of the fund rather than a hidden exposure.
VXUS holds assets denominated in euros, yen, won, and dozens of other currencies. When the U.S. dollar weakens against those currencies, the dollar-translated value of those holdings rises for American investors, even if the underlying assets are flat in local terms.
With the DXY at approximately 99.33 on 27 April 2026, the dollar has remained weak through the first four months of the year. For VXUS holders, this has acted as a structural return amplifier across all three major regional blocs.
Vanguard’s own 2026 research has suggested that international stocks could outperform U.S. equities over the next several years, citing valuation differentials as a primary driver. International equities continue to trade at materially cheaper multiples relative to U.S. equities, reinforcing the thesis that the rotation visible in 2026 year-to-date data may have further room to develop.
Investors wanting to understand the full structural case behind the rotation will find our full explainer on U.S. equity valuations and projected international returns, which examines independent projections from Vanguard, GMO, and Research Affiliates, compares forward return estimates across U.S. large-cap and international developed and emerging market categories, and quantifies the headwinds from current tariff policy and monetary conditions.
VXUS offers a single-trade allocation to 8,794 securities across virtually every non-U.S. public equity market, at a cost of 0.05% annually, with a 2.99% dividend yield and a 9.46% year-to-date return that has made the international diversification case with actual numbers rather than theory.
Two considerations warrant further investigation before committing capital. First, foreign tax withholding and qualified dividend treatment for U.S. holders can reduce the effective yield; Vanguard’s 2026 tax centre documentation provides specifics. Second, at $82.36, VXUS trades near the top of its 52-week range, and investors sensitive to entry timing should assess whether the current price reflects momentum they are comfortable buying into.
IRS Publication 514 on foreign tax credits for individual investors details the conditions under which U.S. holders of international ETFs may claim a credit or deduction for taxes withheld at the source country level, a calculation that directly affects the after-tax dividend yield VXUS holders actually receive.
Vanguard’s VXUS product page provides current sector weights and geographic breakdowns for investors seeking granular allocation data before making a final portfolio decision.
This article is for informational purposes only and should not be considered financial advice. Investors should conduct their own research and consult with financial professionals before making investment decisions. Past performance does not guarantee future results.
VXUS is Vanguard's Total International Stock ETF, holding 8,794 securities that cover virtually every publicly traded non-U.S. equity market, tracking the FTSE Global All Cap ex U.S. Index at a 0.05% expense ratio.
As of 24 April 2026, VXUS has returned 9.46% year-to-date versus 5.34% for VTI, which tracks the U.S. total market, a gap of approximately 4.12 percentage points driven by dollar weakness and rotation out of U.S. mega-cap technology.
VXUS provides broad international exposure across developed and emerging markets at one of the lowest available expense ratios (0.05%), with a 2.99% dividend yield and over $582 billion in assets, making it one of the most cost-effective and liquid options for U.S. investors seeking international diversification.
Because VXUS holds assets denominated in foreign currencies including euros, yen, and won, a weaker U.S. dollar increases the dollar-translated value of those holdings for American investors, acting as a structural return amplifier even when underlying local asset prices are flat.
The three funds produce nearly identical returns (within 0.05 percentage points year-to-date as of April 2026), but VXUS holds a structural advantage through its $582.3 billion in assets, providing tighter bid-ask spreads and greater liquidity for large or frequent transactions.


