
How Hormuz Closure at $104 Oil Is Reshaping Every Asset Class
5 hrs ago

Top economists are delivering an unusually blunt assessment as of late April 2026: the damage to this year’s economic outlook is already done. Mark Zandi, chief economist at Moody’s Analytics, and Mohamed El-Erian, former Pimco CEO, have both warned that a peace deal, even a swift one, would not reverse the growth and employment losses now locked into the 2026 calendar. The Iran conflict, roughly two months old, has closed the Strait of Hormuz, pushed Brent crude to approximately $107 per barrel, and lifted U.S. petrol prices to $3.89 per gallon nationally. Simultaneously, Kevin Warsh, Donald Trump’s nominee to lead the Federal Reserve, delivered a hawkish congressional testimony on 21 April that surprised markets and further tightened the rate outlook. These are not isolated shocks. They are compounding forces converging on the same pressure point, and this analysis maps exactly how the damage has accumulated, why the Fed is structurally constrained from responding, and what the forward path looks like for growth, employment, and rates through the remainder of 2026.
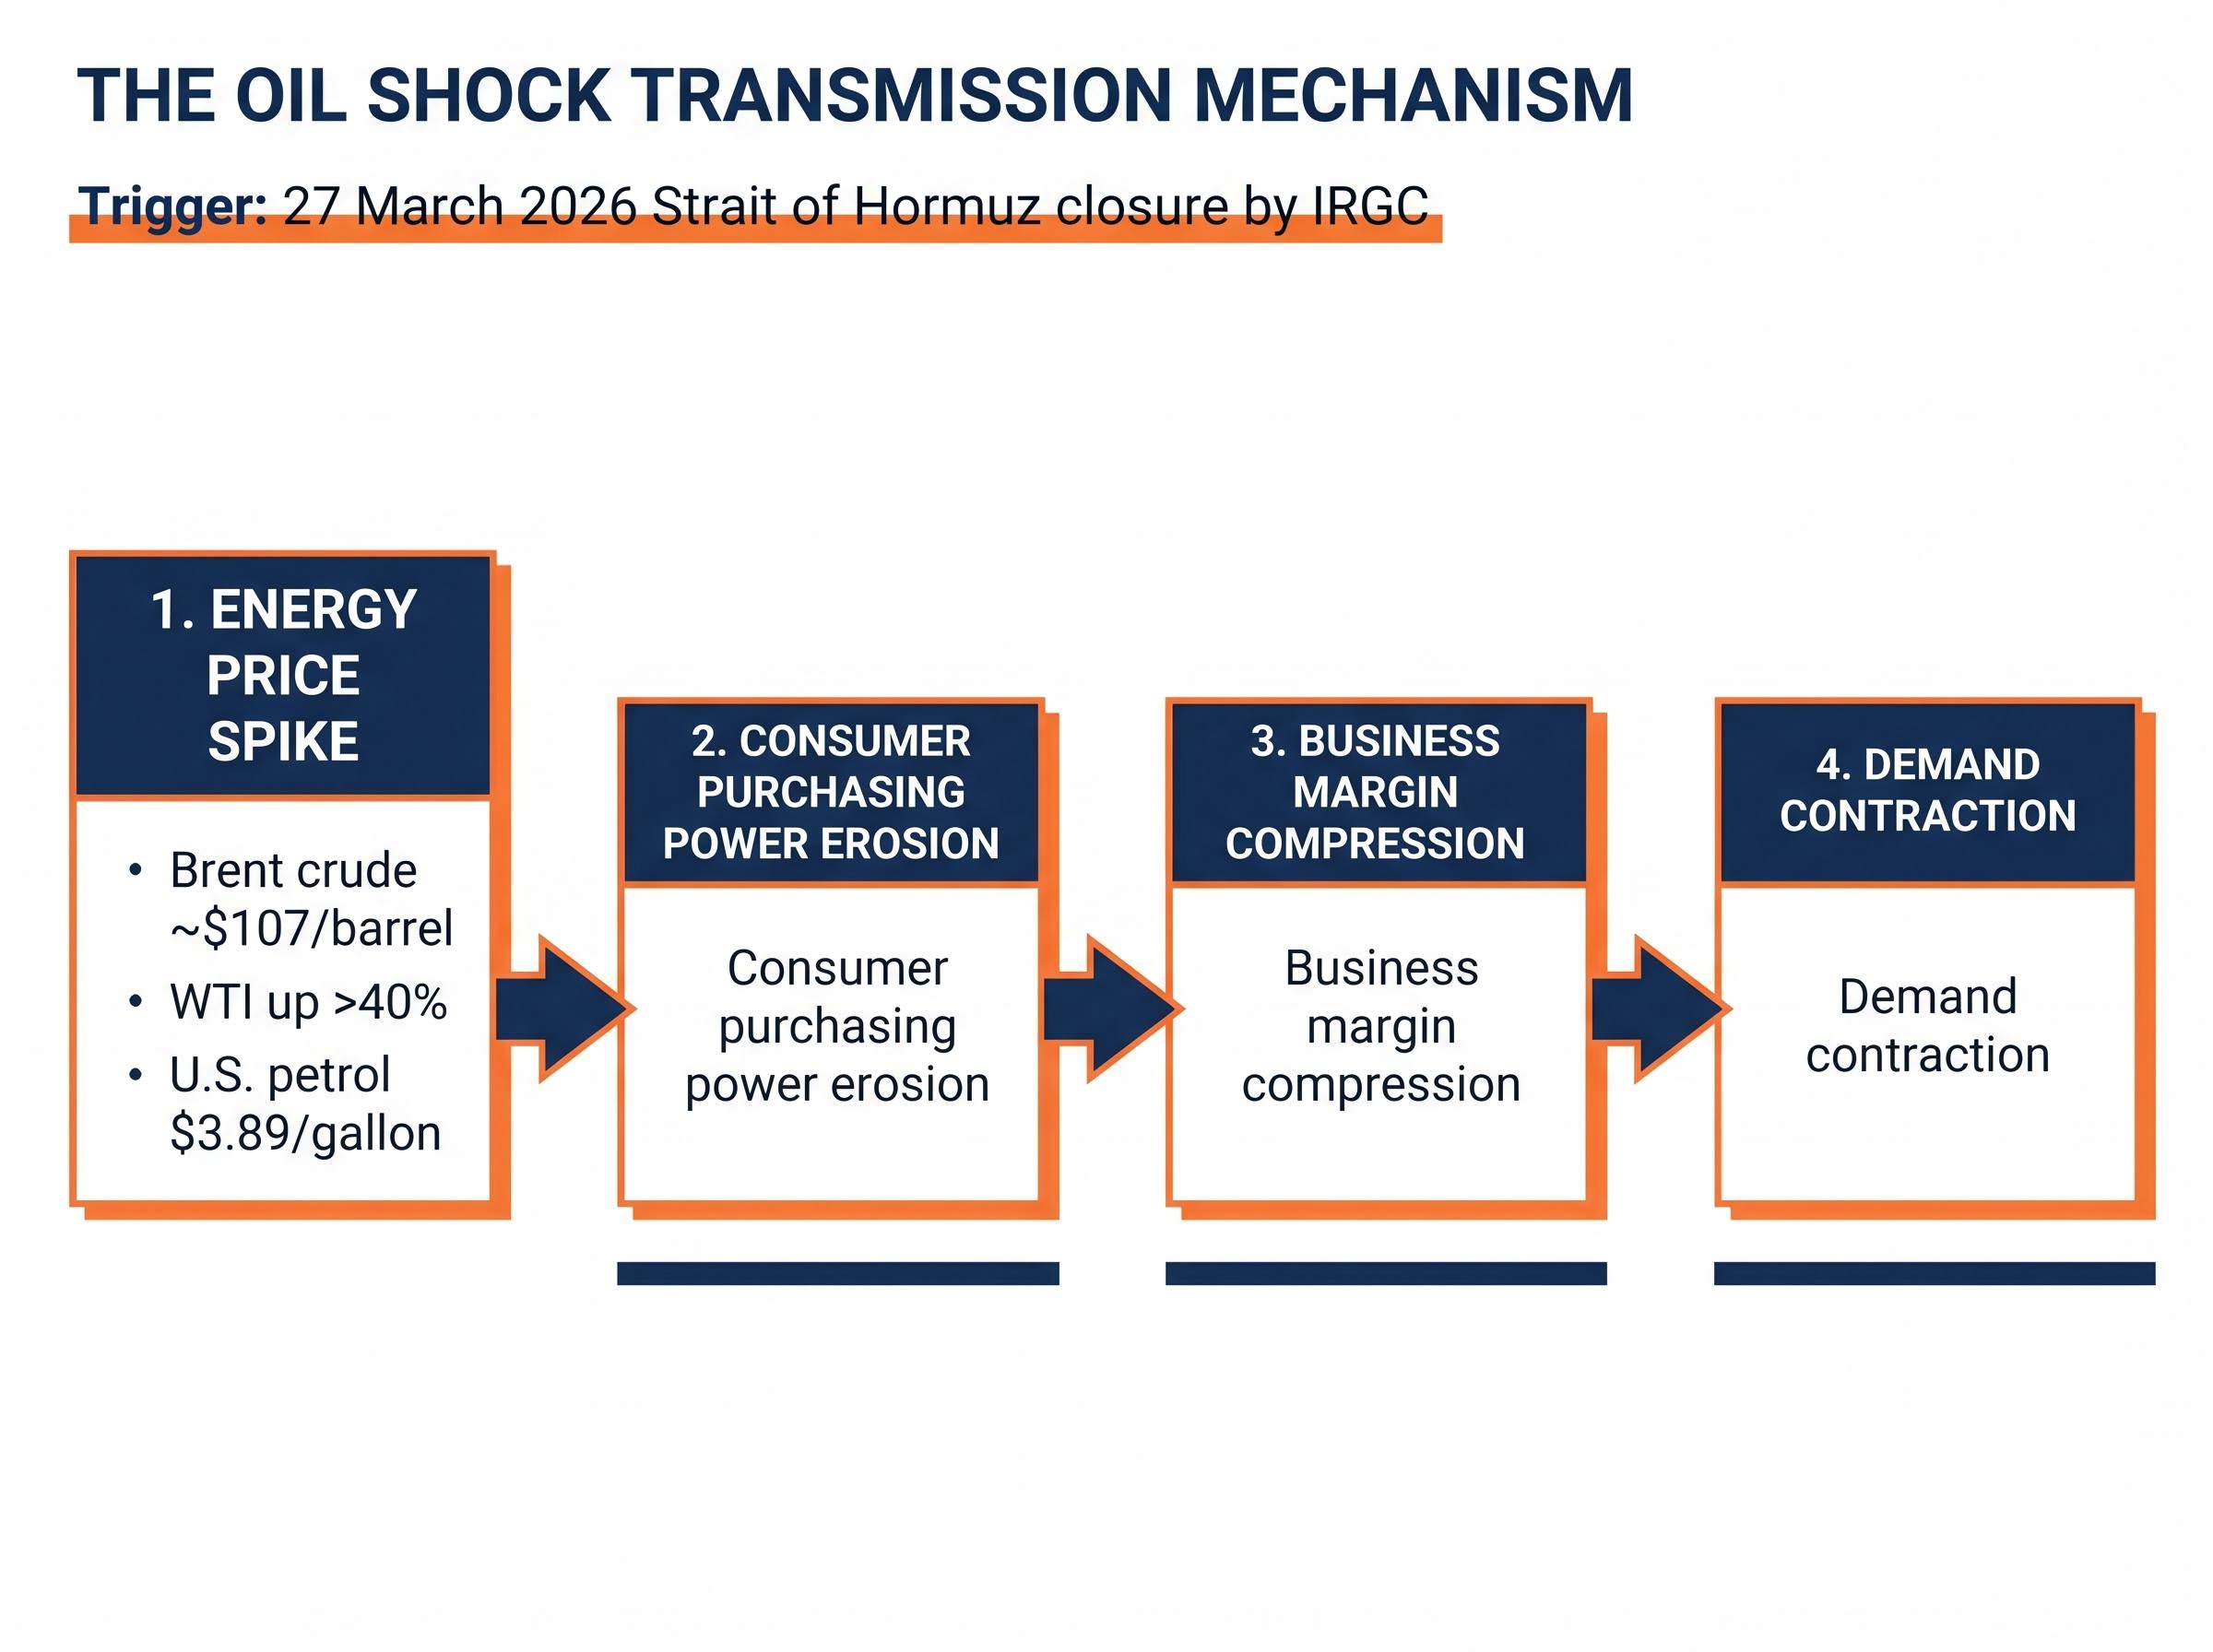
The Strait of Hormuz closure, formally enacted by the IRGC on 27 March 2026, set off a chain reaction that moves through the U.S. economy in a specific, sequential order. Understanding that sequence is what separates a temporary headline from a structural problem.
The Brent-WTI spread widening as a real-time escalation gauge has become one of the more actionable signals available to investors navigating the conflict, with the spread expanding to over $9 per barrel by late April, indicating that geopolitical risk is concentrated at the Middle Eastern chokepoint rather than in North American supply conditions.
This is not a standard commodity price cycle. Zandi has noted that oil prices will likely dip later in 2026 but remain above pre-war levels throughout the year. The reason is physical: damage to Middle East energy production infrastructure is expected to slow the ramp-back to pre-war global output levels of approximately 100 million barrels per day. Even if the conflict ended tomorrow, the supply constraint would persist for months. For anyone with a 6-12 month investment or financial planning horizon, the duration of infrastructure repair, not the duration of hostilities, is the variable that determines how long these headwinds last.
The economist consensus has moved to an uncomfortable position: the GDP growth and employment gains originally projected for 2026 have been effectively wiped out, regardless of how quickly the conflict resolves. Both Zandi and El-Erian have stated this explicitly, and the logic behind it is not speculative.
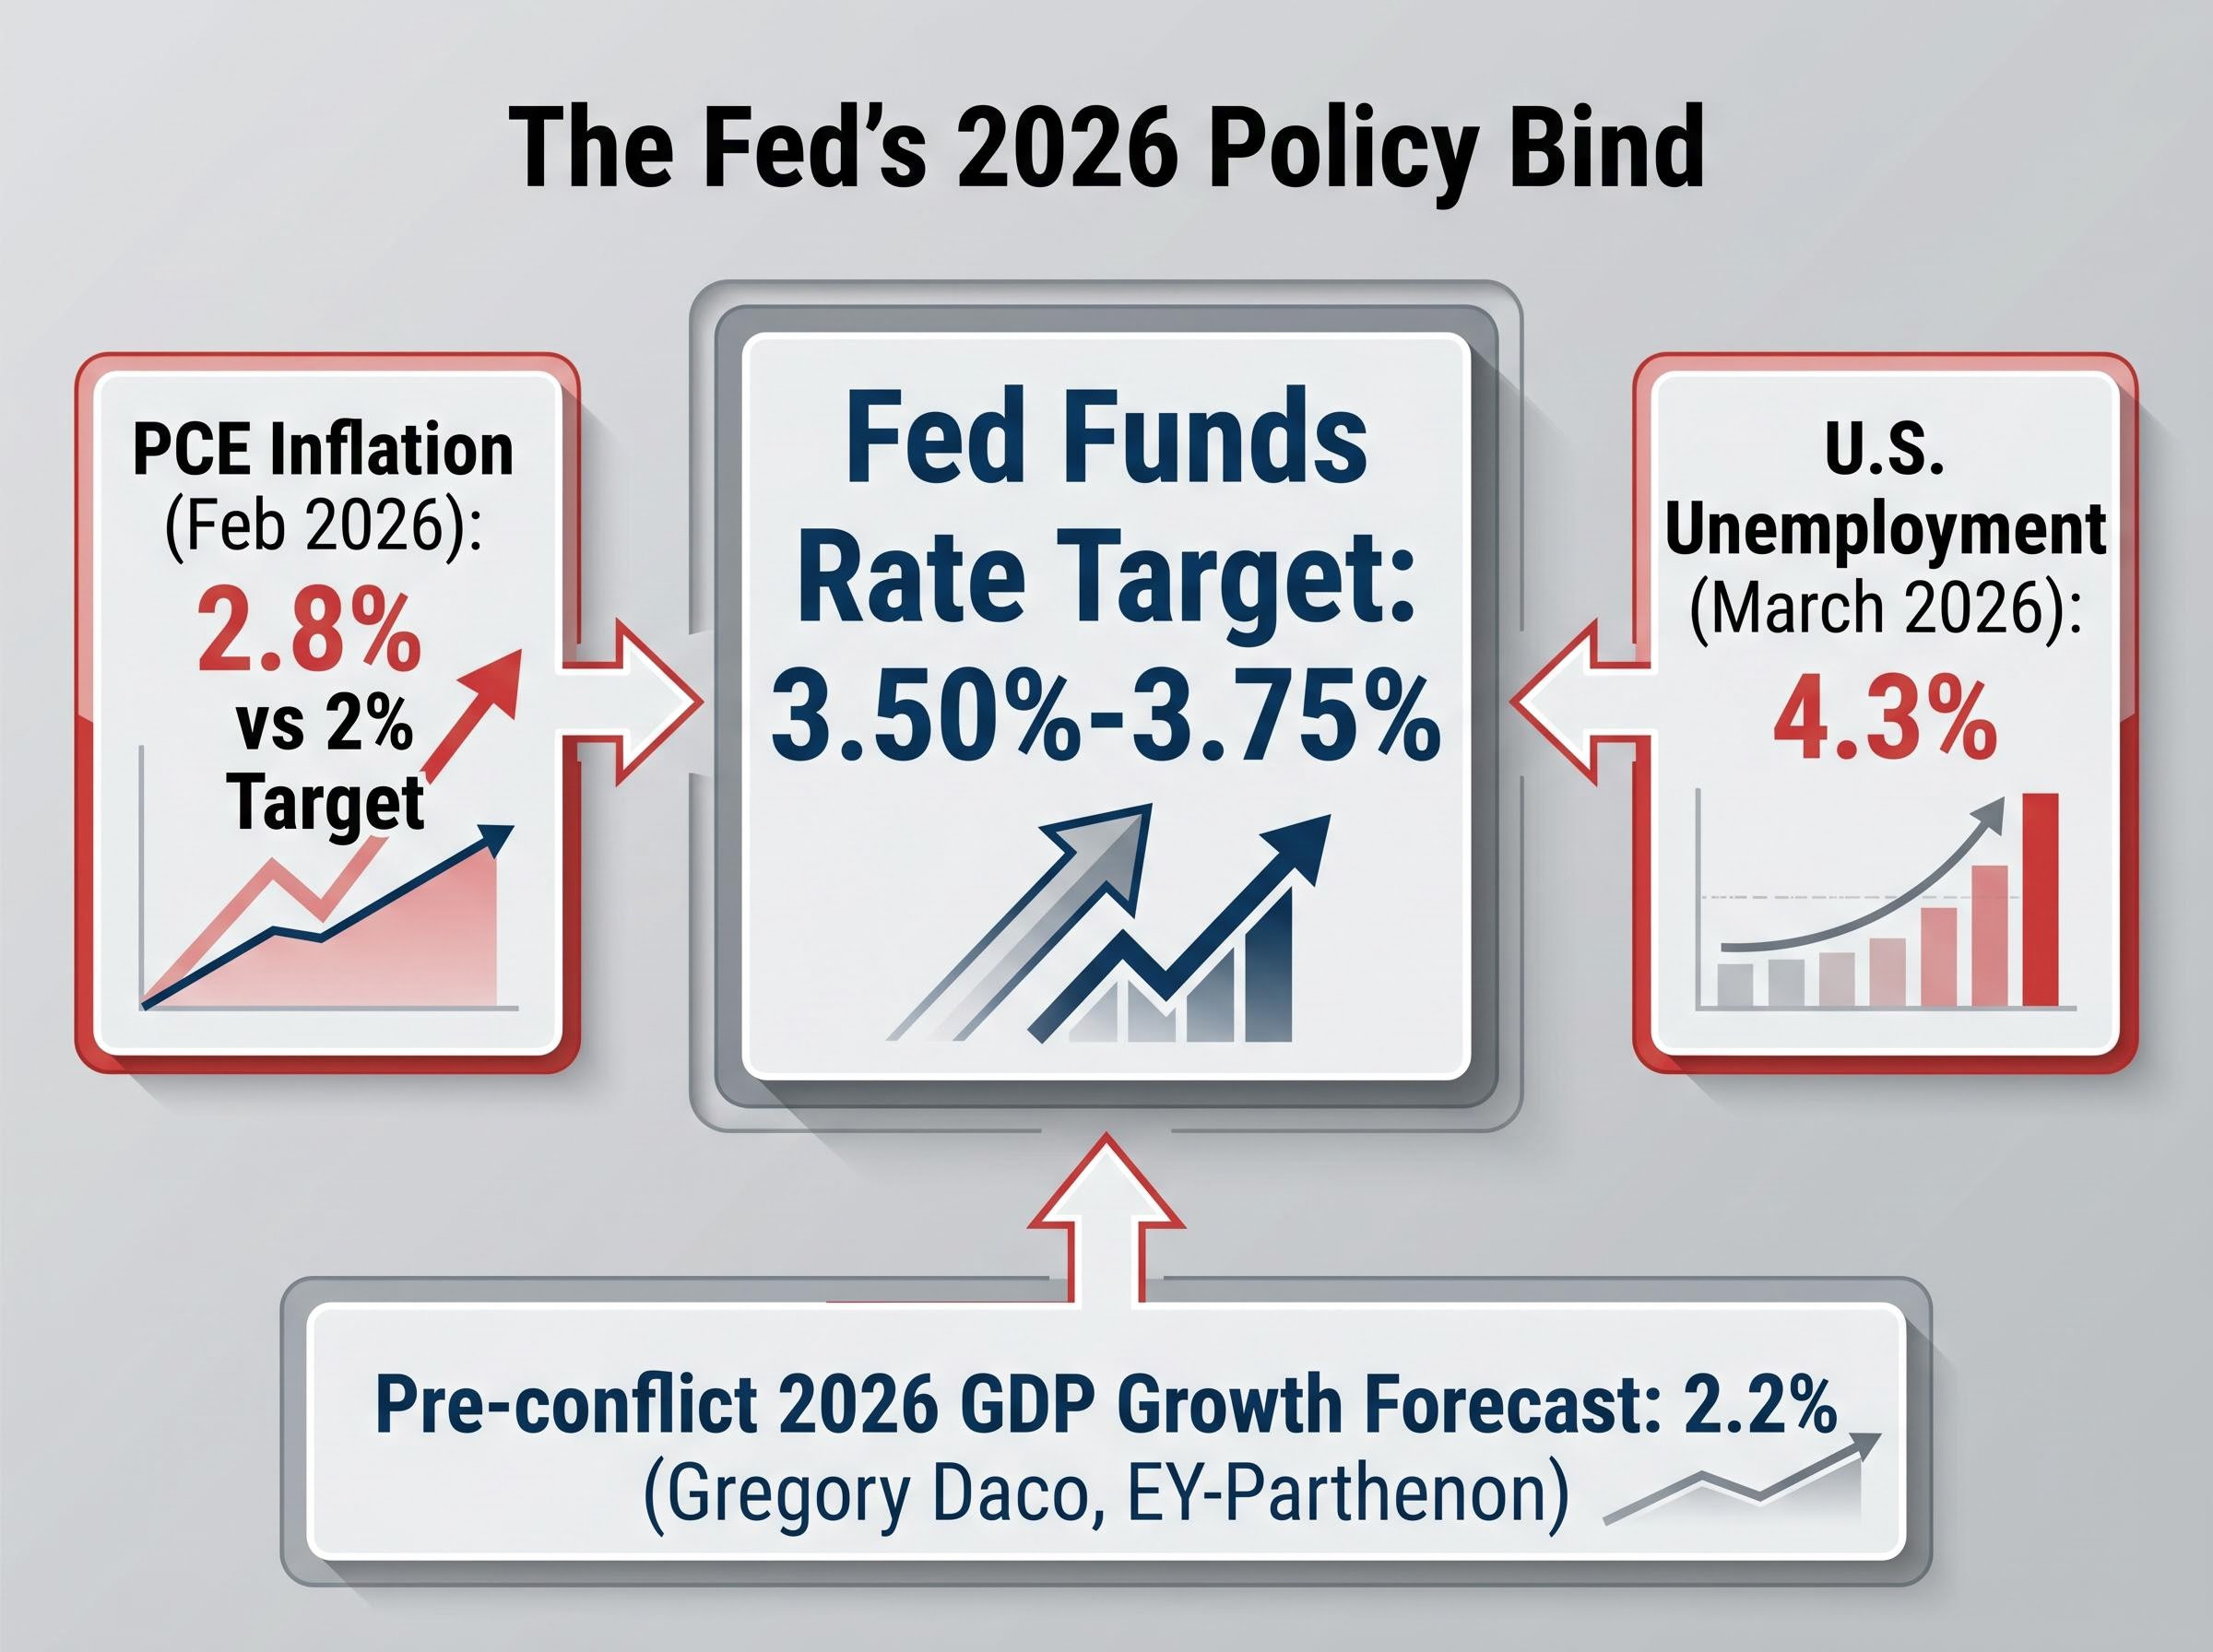
The damage is not merely a function of today’s oil price. It is the compounding result of demand deterioration and supply chain disruption already in motion. Businesses that delayed hiring in March and April will not accelerate it in June simply because crude falls $10. Consumers who curtailed spending have already altered their quarterly consumption patterns. Gregory Daco, chief economist at EY-Parthenon, had forecast 2026 U.S. GDP growth at 2.2% before the conflict; that figure is now widely regarded as optimistic.
Pentagon assessments of mine clearance and shipping insurer re-entry timelines, published as Iran’s reopening proposal circulated through Pakistani intermediaries on 27 April, confirm that even a diplomatic agreement reached today would leave commercial oil flow disrupted for weeks to months, not days, reinforcing why the conflict’s end date is the wrong variable for investors to track.
Mohamed El-Erian has framed the current environment as one in which central banks are no longer choosing between good and bad options but rather selecting among the least damaging errors available to them.
The U.S. unemployment rate stood at 4.3% in March 2026, and economists expect it to continue rising. The International Monetary Fund warned on 14 April 2026 that global recession risk would intensify if the conflict worsens. The question facing investors is no longer when conditions improve. It is how much further they deteriorate before stabilising.
The Federal Reserve’s most powerful countermeasure in a growth slowdown is rate cuts. That tool is currently unavailable. PCE inflation, the Fed’s preferred gauge, stood at 2.8% year-over-year in February 2026, well above the 2% target. Cutting rates into an inflationary energy shock would risk embedding higher prices into the broader economy, the precise outcome the Fed spent 2022-2024 fighting to prevent.
Holding rates at the current 3.50%-3.75% target range, however, means the central bank is offering no relief to an economy losing momentum. This is the structural paralysis at the heart of the 2026 outlook.
Then came the Warsh testimony. On 21 April 2026, Kevin Warsh appeared before the Senate Banking Committee and emphasised inflation control as the Fed’s primary mandate. Markets responded with a slight increase in Treasury yields. The signal was clear: the incoming Fed leadership is, if anything, less likely to pivot toward accommodation than the current one.
Tom Graff, chief investment officer at Facet, has argued that the Fed is effectively boxed in by high oil prices and that this constraint is not yet meaningfully reflected in equity valuations.
| Metric | Earlier 2026 Expectation | Current Expectation (27 April 2026) |
|---|---|---|
| Expected rate cuts | Up to three | One or potentially none |
| Investor consensus | Multiple cuts by year-end | Approximately two-thirds expect rates unchanged through year-end |
| Fed funds rate | Expected to decline toward 2.75%-3.00% | 3.50%-3.75% (held steady) |
El-Erian’s characterisation of central banks choosing among the least damaging available errors captures the bind precisely: there is no policy response that avoids pain, only choices about where the pain lands.
For anyone holding bonds, evaluating mortgage timing, or managing cash allocation, the practical implication is stark. Rate relief is not coming in 2026.
For readers wanting the full quantitative breakdown of how rate expectations shifted, our deep-dive into how $100 oil eliminated Fed rate cut expectations traces the probability moves in detail, including the 73% chance markets now assign to no cuts in 2026, the 40% probability of a hike by October, and the 10-year Treasury yield breaking above 4.5% even as equity markets rallied on ceasefire headlines.
The directional consensus among economists as of late April 2026 points in a single direction: weaker growth, rising unemployment, and inflation that remains stubbornly above target. A recession is not the base case, but the probability has risen materially since March.
Daco’s 2.2% GDP growth forecast for 2026, set before the conflict, now functions as a ceiling rather than a central estimate. The IMF’s 14 April warning made the conditions for a global recession explicit: a prolonged Strait of Hormuz closure or further conflict escalation. Both remain plausible as of late April, with no credible near-term resolution pathway identified by conflict analysts.
PCE inflation at 2.8% year-over-year (as of February 2026) is expected to remain above the Fed’s 2% target through the year, sustained by elevated energy costs. Unemployment, at 4.3% in March, is projected to continue rising as the demand contraction documented earlier in this analysis works through hiring decisions with a lag.
Three indicators will determine where the outlook moves from here:
Against this backdrop, equity markets have returned toward all-time highs. This divergence between market pricing and economist pessimism is itself a signal. Graff has flagged that Fed policy risk is not substantially reflected in current equity valuations. El-Erian’s commentary reinforces the same point from a different angle: if central banks are constrained from responding to a deteriorating economy, the assumption of a policy safety net that has underpinned equity valuations for years may no longer hold.
The split valuation signal from the Shiller P/E and forward P/E is one concrete expression of the divergence Graff and El-Erian have both flagged: the Shiller P/E reached 40.09 in April 2026, only the second time in 155 years it has been this elevated, while the forward P/E compressed to near its five-year average, making it genuinely difficult to read equity markets as either complacent or reasonably priced depending on which metric an investor prioritises.
The gap between what economists see and what equity markets price is not necessarily proof that one side is wrong. But for readers who now understand the transmission mechanisms, the Fed’s structural bind, and the irreversibility of lost output, it is a gap worth watching closely.
The 2026 economic outlook has been structurally altered by compounding shocks: an energy supply disruption that physical infrastructure damage will extend well beyond any ceasefire, a Federal Reserve paralysed between inflation and a slowing economy, and an incoming Fed chair whose testimony signals no relief ahead. Zandi and El-Erian have converged on the same assessment: the growth and employment gains projected for this year are not recoverable within the 2026 calendar. Central banks are selecting among least-bad options, not engineering a recovery.
The variables that matter most from here are not peace deal timing but PCE inflation trajectory, unemployment trends, and whether the Fed finds any room to manoeuvre before labour market deterioration forces its hand.
This article is for informational purposes only and should not be considered financial advice. Investors should conduct their own research and consult with financial professionals before making investment decisions. Past performance does not guarantee future results. Financial projections are subject to market conditions and various risk factors.
Leading economists including Mark Zandi of Moody's Analytics and Mohamed El-Erian have concluded that the GDP growth and employment gains originally projected for 2026 have been effectively wiped out, with a recession not the base case but materially more probable since March 2026.
Physical damage to Middle East energy infrastructure means global oil supply cannot quickly return to pre-war levels of around 100 million barrels per day, and businesses that already delayed hiring and consumers who already curtailed spending will not rapidly reverse those decisions even if crude prices fall.
The closure pushed Brent crude to approximately $107 per barrel and U.S. petrol prices to a national average of $3.89 per gallon, eroding household purchasing power and compressing business margins across transportation, manufacturing, and logistics sectors.
The Fed is holding its target range at 3.50%-3.75%, and cutting rates is not viable because PCE inflation stands at 2.8% year-over-year, well above the 2% target, meaning rate cuts risk embedding higher energy-driven prices into the broader economy.
The three indicators that will most determine where the 2026 economic outlook moves are the PCE inflation trajectory, monthly unemployment readings, and any credible signals of Strait of Hormuz resolution or infrastructure repair timelines.


