
How Hormuz Closure at $104 Oil Is Reshaping Every Asset Class
5 hrs ago

The Vanguard Total Stock Market ETF delivered a cumulative total return of 287% over the decade to 23 April 2026, compounding across more than 3,500 stocks while charging investors 0.03% per year. That record is not in dispute. What is worth scrutinising is how much of that return was driven by a handful of mega-cap technology names, and whether the next decade’s winners will look anything like the last decade’s.
The Magnificent Seven (Nvidia, Apple, Microsoft, Amazon, Alphabet, Meta, Tesla) have dominated US equity returns for much of the past ten years, and their combined weight inside even “broad” index funds has grown to levels that challenge conventional diversification logic. For retail investors deciding whether to hold a concentrated large-cap technology position or route capital through VTI, the structural differences between these approaches deserve honest scrutiny. This analysis unpacks the case for VTI over concentrated Magnificent Seven exposure, examines where the fund’s diversification advantages are real versus overstated, and uses Amazon’s strategic position as a concrete lens for understanding the opportunity cost of capital concentration.
VTI’s return profile across multiple timeframes, as of March 31, 2026, establishes a clear baseline:
287% cumulative total return over ten years, delivered through a single passive vehicle holding approximately 3,500 US equities.
The negligible gap between market price and net asset value (NAV) returns confirms tight trading efficiency at scale. Total fund net assets stood at $2.0 trillion as of March 31, 2026, making VTI the largest broad-market equity ETF available to global investors.
Vanguard’s official VTI fund profile confirms the fund’s 0.03% expense ratio, its tracking of the CRSP US Total Market Index, and the $2.0 trillion in net assets that make it the largest broad-market equity ETF available to retail investors globally.
Those figures are substantial. They also arrived during a period defined by sustained mega-cap technology dominance, an AI-fuelled investment cycle, and a macro environment that rewarded the largest companies disproportionately. The question embedded in the scorecard is straightforward: how much of VTI’s decade belonged to the index’s breadth, and how much belonged to the same seven names an investor could have held directly?
VTI tracks the CRSP US Total Market Index, which spans approximately 3,500 stocks across large-, mid-, small-, and micro-cap segments. The number sounds like broad diversification, and in one sense it is. Every publicly listed US equity of meaningful size is represented.
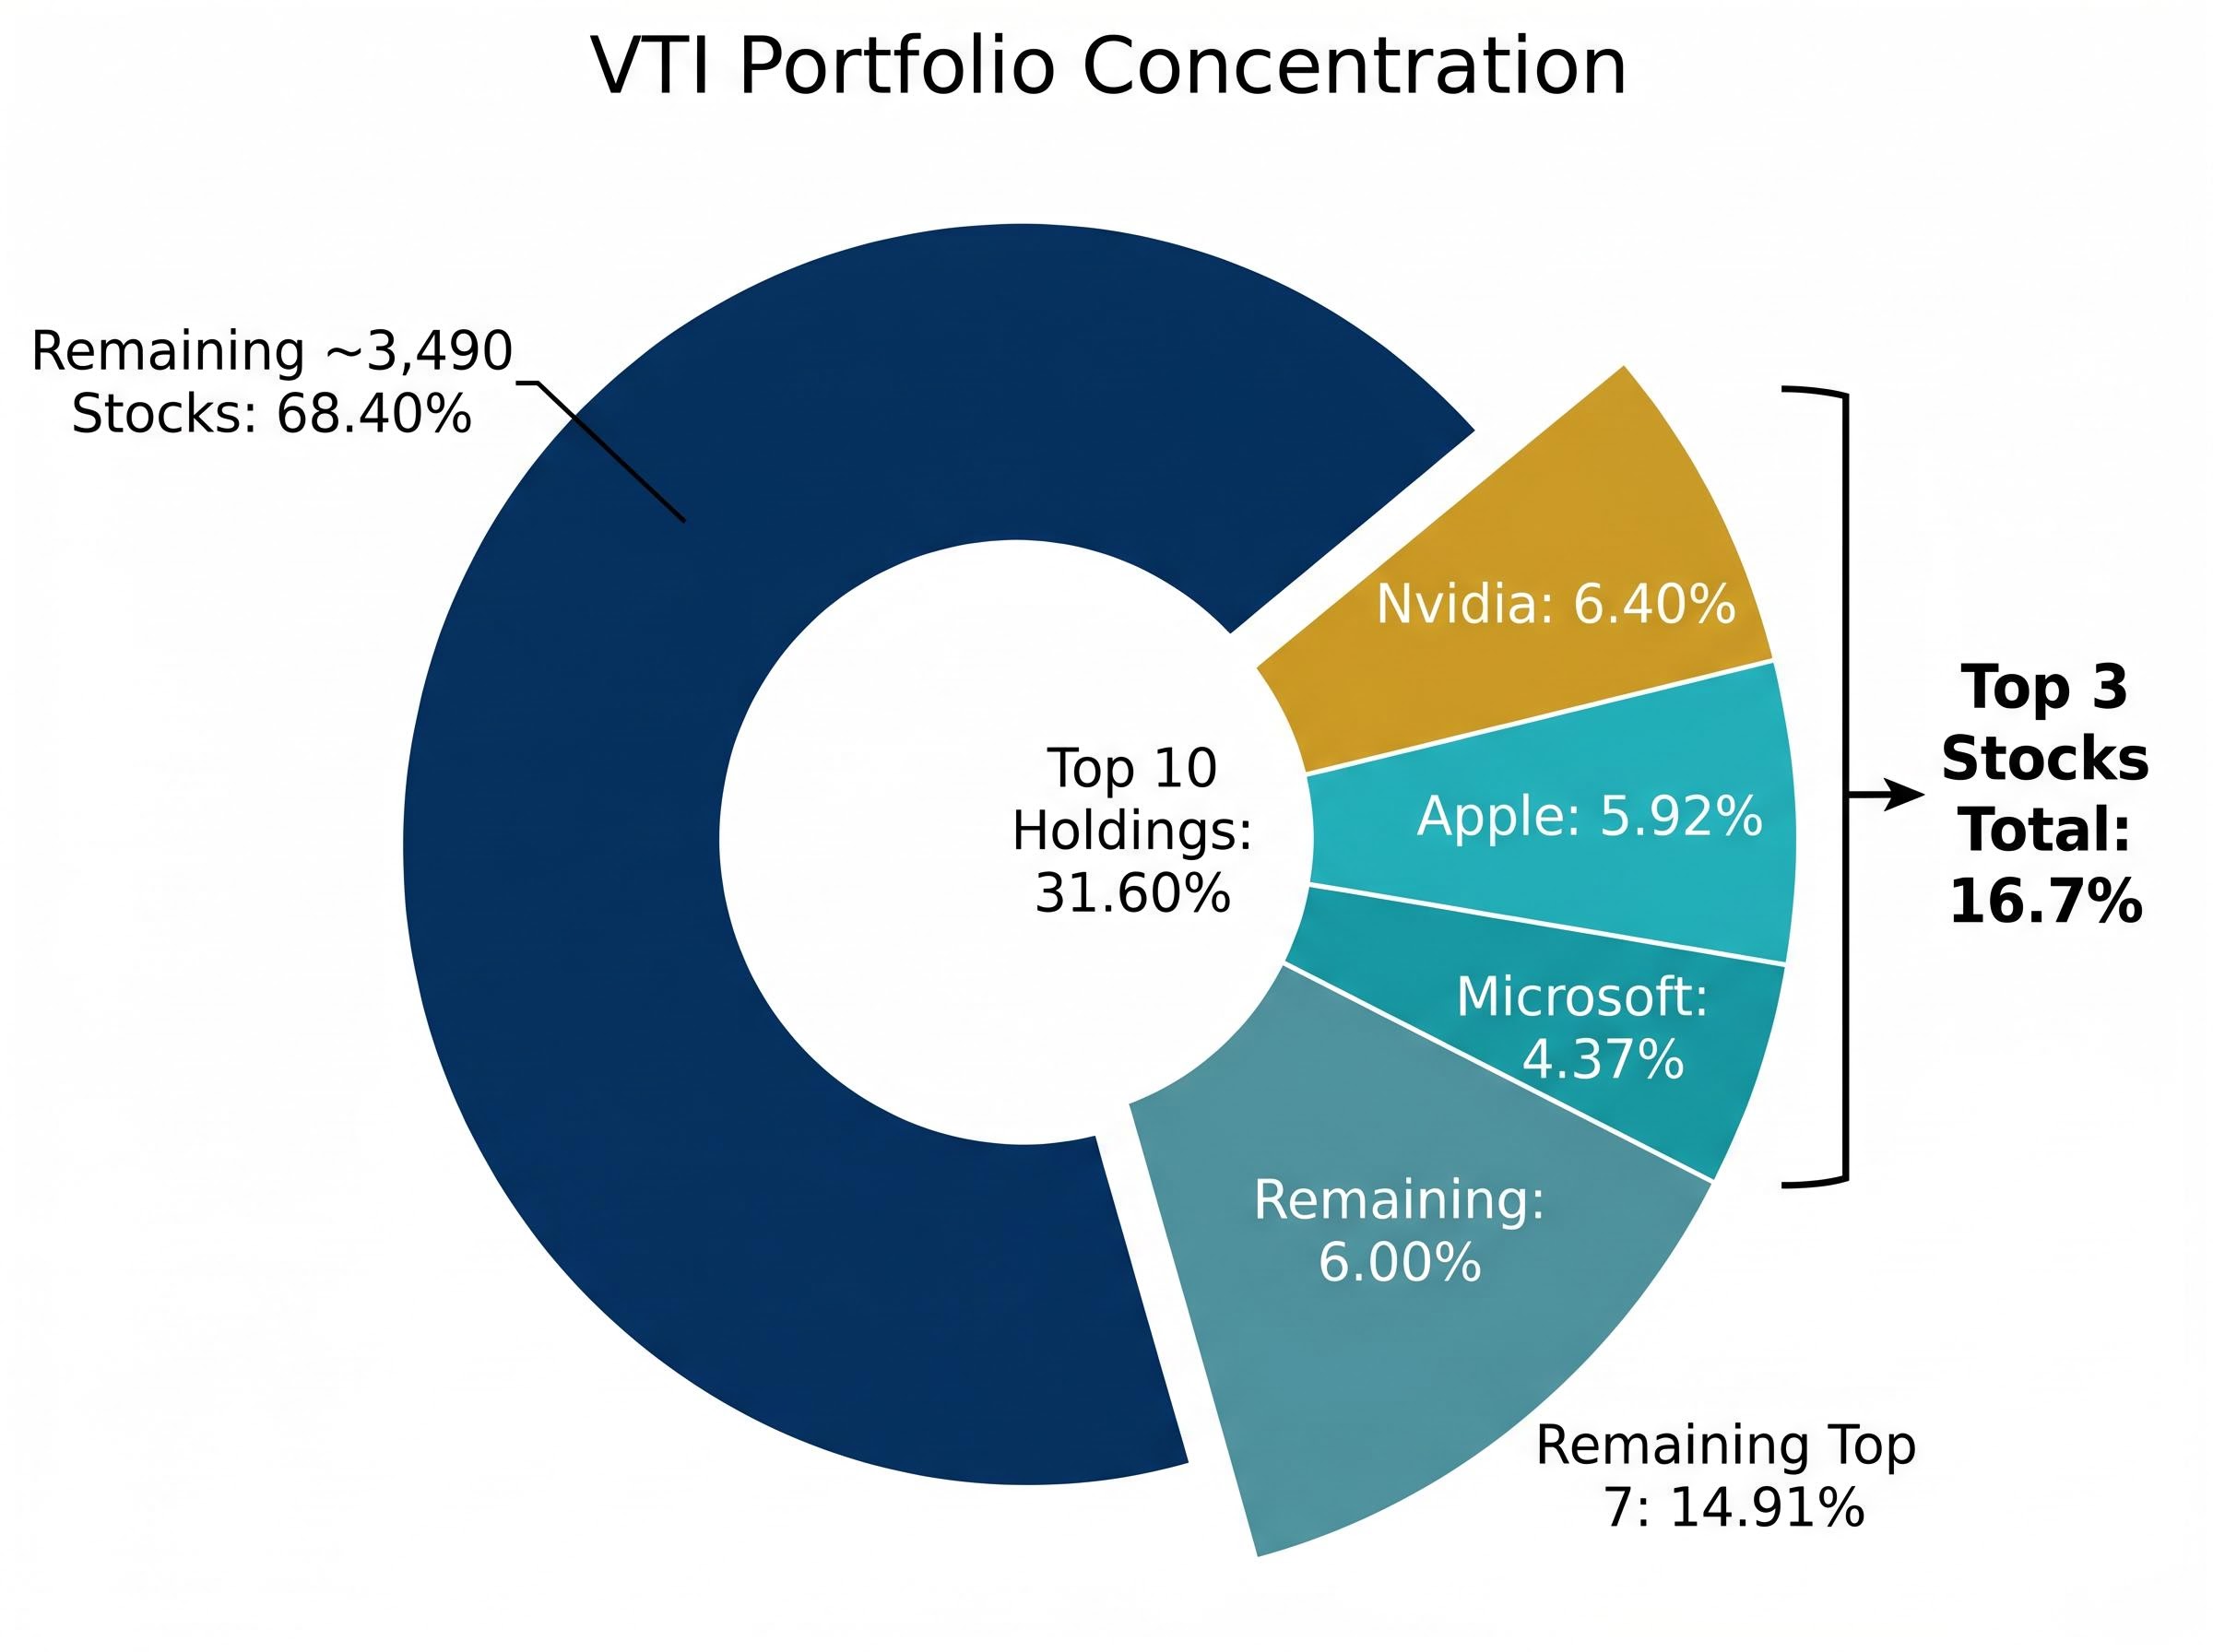
The mechanism matters, though. VTI is market-cap weighted, meaning each stock’s allocation reflects its total market value relative to the index. The result is that the largest companies receive the largest positions, and the smallest companies contribute almost nothing to the fund’s daily returns. Technology accounts for 36.3% of total holdings, the single largest sector allocation. The top three names alone, Nvidia, Apple, and Microsoft, collectively represent 16.7% of the entire fund.
| Holding | Portfolio Weight (%) |
|---|---|
| Nvidia (NVDA) | 6.40% |
| Apple (AAPL) | 5.92% |
| Microsoft (MSFT) | 4.37% |
| Amazon (AMZN) | 3.20% |
| Alphabet Class A (GOOGL) | 2.66% |
| Broadcom (AVGO) | 2.33% |
| Alphabet Class C (GOOG) | 2.11% |
| Meta Platforms (META) | 1.99% |
| Tesla (TSLA) | 1.66% |
| Berkshire Hathaway (BRK.B) | 1.36% |
The top 10 holdings combined account for 31.60% of VTI’s portfolio. Broad in name; concentrated in practice.
One structural response to cap-weighting concentration is equal weight alternatives to cap-weighted indexes, such as the Invesco RSP, which distributes exposure evenly across constituents and thereby reduces reliance on technology mega-caps; Société Générale’s Chief US Equity Strategist has argued this construction will outperform the cap-weighted S&P 500 through early 2027 as hyperscaler free cash flow turns negative.
The structural differentiation between VTI and a pure S&P 500 vehicle such as VOO lies in the roughly 2,500 additional holdings outside the large-cap universe. These include mid-cap industrials, small-cap biotechs, and micro-cap companies that never appear in S&P 500-tracking funds. If mid- or small-cap stocks outperform large-caps during the next decade, whether through a valuation rotation, sector leadership shift, or simply mean reversion, VTI’s broader construction is positioned to capture that upside automatically. A pure large-cap vehicle would not.
The bull case for the Magnificent Seven is grounded in specifics, not sentiment. Three structural conditions have driven their outperformance:
Nvidia alone gained approximately 39% in 2025 and added a further 6% year-to-date in early 2026, with its market capitalisation surpassing $5 trillion. It now sits as VTI’s single largest holding at 6.40%.
The question is whether these conditions represent a permanent feature of US equity markets or a cycle that eventually rotates. Historically, dominant sector concentrations have rarely sustained outperformance over full decade-length periods. Technology led in the late 1990s, then underperformed for most of the 2000s. Financials led in the mid-2000s, then collapsed. This is not a prediction; it is a structural pattern worth weighing.
Morningstar has noted that while VTI’s market-cap weighting creates concentration in richly valued companies, no clear empirical link has been established between this concentration and underperformance. Low turnover and low fees further offset concentration-related risks.
Kritzman and Turkington’s research on market-cap weighting and concentration risk, published via SSRN in 2025, challenges the intuition that high index concentration necessarily undermines diversification, finding that low turnover and cost efficiency can offset the valuation drag that concentrated weightings introduce over time.
Even inside VTI, the top 10 holdings at 31.60% mean the fund is not immune to a Magnificent Seven correction. It is, however, significantly less exposed than a pure large-cap technology position, and the remaining 68.40% of the portfolio provides a structural buffer that concentrated holdings cannot replicate.
The concentration risk argument becomes more tangible when examined through a single company. Amazon, VTI’s fourth-largest holding at 3.20%, illustrates the kind of strategic complexity that broad diversification is designed to dilute.
Analyst Adam Spatacco, writing for the Motley Fool, has argued that Amazon’s simultaneous expansion across cloud computing, digital advertising, logistics, robotics, and satellite internet may create compounding operational distractions. The concern is not that these ventures will fail in absolute terms, but that capital efficiency could decline relative to more focused competitors pursuing narrower strategic bets.
Nvidia provides the contrasting case. Its concentrated focus on AI infrastructure has delivered stronger near-term value generation, with shares trading at $208.24 (reflecting a 4.3% single-session gain at time of analysis) against Amazon’s $263.93.
Analysts who favour selective stock picking within the Magnificent Seven rather than broad group exposure point to wide valuation divergence inside the cohort: Alphabet at 17x forward earnings sits in fundamentally different territory from Tesla at 145x, suggesting that treating the seven as a monolithic basket carries its own form of mispositioning risk.
| Metric | Amazon (AMZN) | Nvidia (NVDA) |
|---|---|---|
| Market capitalisation | ~$2.8 trillion | ~$5+ trillion |
| Share price (April 2026) | $263.93 | $208.24 |
| VTI portfolio weight | 3.20% | 6.40% |
| Strategic focus | Multi-front expansion | Concentrated AI infrastructure |
Whether Amazon’s breadth or Nvidia’s focus delivers superior returns over the next decade is precisely the kind of single-company uncertainty that a position in VTI structurally removes from the investor’s decision set. At 3.20%, VTI holds meaningful Amazon exposure without full dependency on its capital allocation choices.
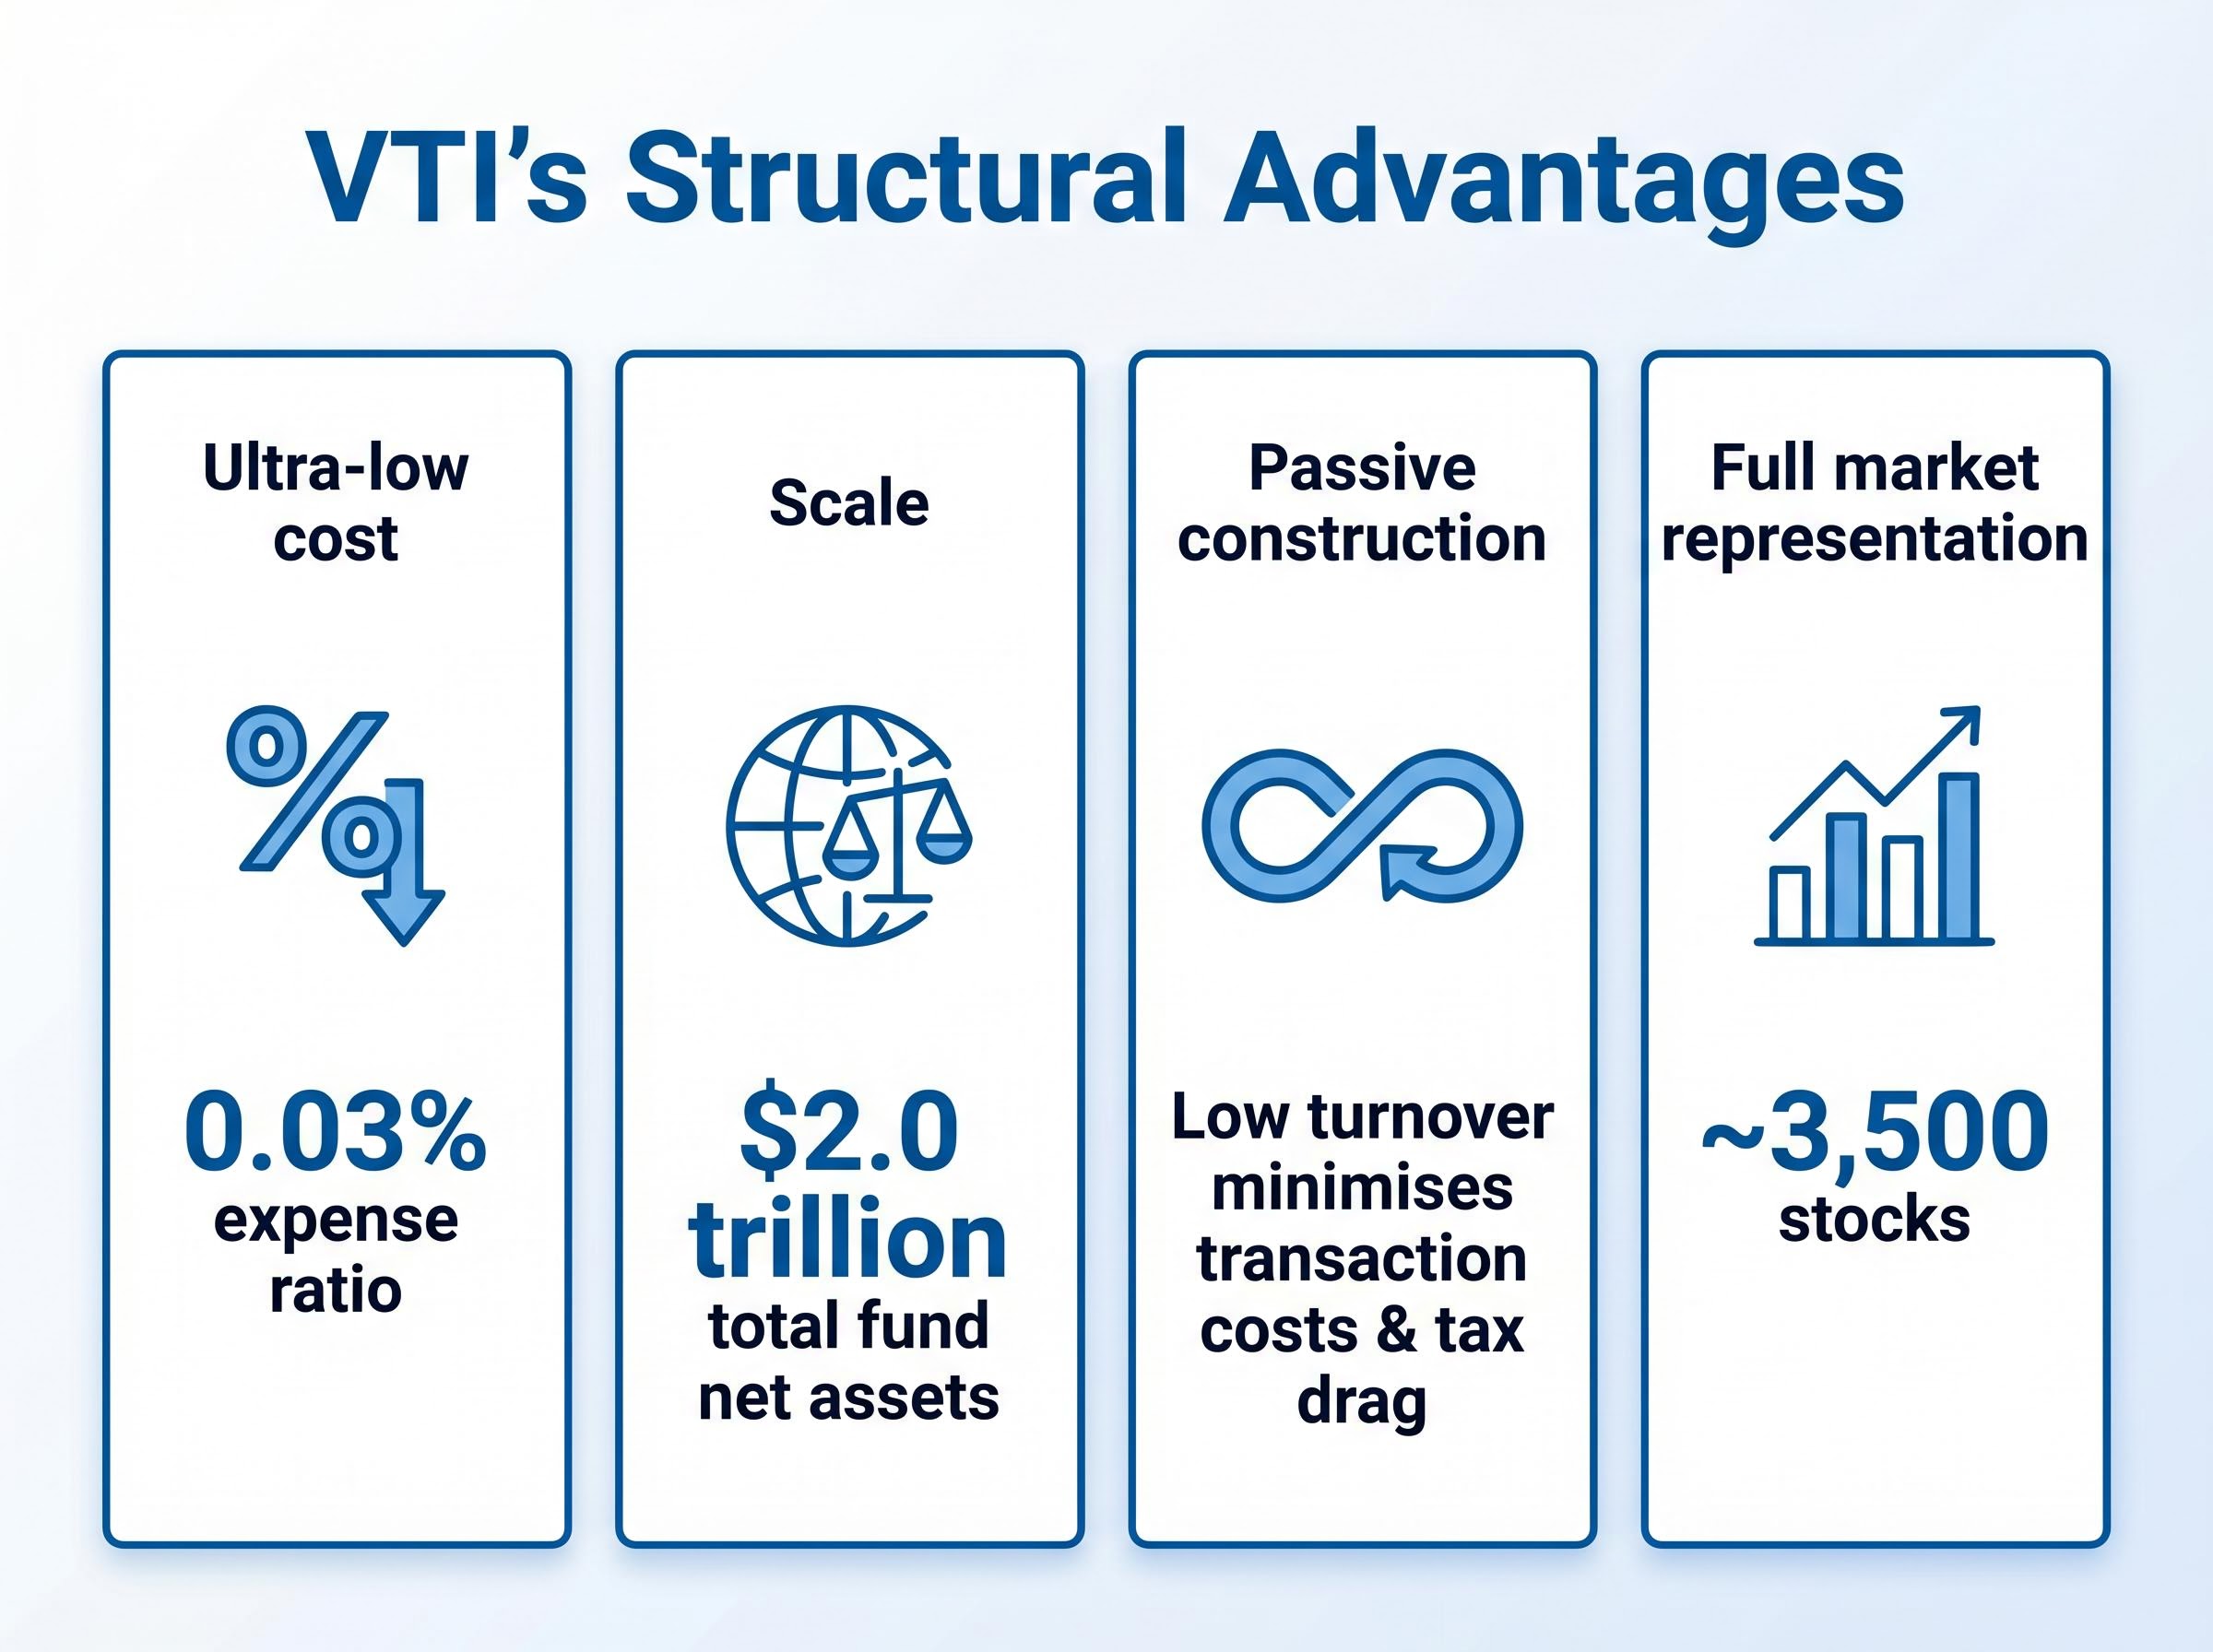
The positive case for VTI rests on four structural advantages that persist regardless of which companies or sectors lead the next cycle:
VTI does not require investors to predict which companies lead the next decade. It requires only that the US equity market as a whole continues to create value.
VTI’s passive construction removes individual stock selection decisions from the investor’s hands, but disciplined rebalancing through market volatility remains a behavioural challenge that passive structure alone does not solve; investors who sell broad market ETFs into drawdowns convert temporary paper losses into permanent realised losses and face the compounding cost of re-entering at higher prices.
The competitor landscape confirms VTI’s position but also provides alternatives worth noting. ITOT (iShares) and SCHB (Schwab) have historically matched VTI’s 0.03% expense ratio. Fidelity’s FZROX charges 0.00%, though it is not exchange-traded and is available only to Fidelity account holders.
| ETF Ticker | Issuer | Expense Ratio |
|---|---|---|
| VTI | Vanguard | 0.03% |
| ITOT | iShares (BlackRock) | 0.03%* |
| SCHB | Schwab | 0.03%* |
| FZROX | Fidelity | 0.00%* |
*Competitor expense ratios are based on historical data and should be verified on issuer websites before investing.
For retail investors with a genuine 10-year horizon who are not confident picking the next decade’s winning sector, VTI’s combination of cost, breadth, scale, and passive discipline is meaningful and durable regardless of which macro scenario unfolds.
VTI’s 287% cumulative 10-year return was delivered through genuine broad diversification across 3,500 stocks, but market-cap weighting means the fund has meaningfully benefited from Magnificent Seven dominance and remains exposed to any reversal of that trend.
The trade-off is clear. Concentrated Magnificent Seven positions require investors to be right about which specific platforms sustain dominance. VTI requires only that the US equity market broadly continues to compound, removing the need to predict sector leadership.
Amazon illustrates the point directly: whether capital-intensive multi-front strategies outperform focused AI infrastructure plays over 10 years is exactly the kind of single-company uncertainty that broad market exposure removes from the investor’s decision set.
Neither approach is guaranteed. VTI’s structural advantages, 0.03% cost, full market coverage, and passive discipline, make it a defensible default for investors who prioritise resilience over concentrated upside. Past performance does not guarantee future results, and financial projections remain subject to changing market conditions.
This article is for informational purposes only and should not be considered financial advice. Investors should conduct their own research and consult with financial professionals before making investment decisions.
VTI is a passive exchange-traded fund that tracks the CRSP US Total Market Index, holding approximately 3,500 US stocks across large-, mid-, small-, and micro-cap segments at a 0.03% annual expense ratio. It uses market-cap weighting, meaning larger companies receive proportionally larger allocations in the fund.
VTI delivered a cumulative total return of 287% over the decade to 23 April 2026, equating to an annualised return of 13.67% to 13.68%, with total fund net assets reaching $2.0 trillion as of March 31, 2026.
Technology accounts for 36.3% of VTI's total holdings, and the top three positions alone, Nvidia, Apple, and Microsoft, represent 16.7% of the entire fund, with the top 10 holdings combined making up 31.60% of the portfolio.
VTI removes the need to predict which specific mega-cap platforms sustain dominance, providing exposure to all seven while buffering single-company risk through the remaining 68.40% of the portfolio; however, concentrated Magnificent Seven positions could outperform if those names continue to lead the market.
ITOT from iShares and SCHB from Schwab historically match VTI's 0.03% expense ratio, while Fidelity's FZROX charges 0.00%, though FZROX is not exchange-traded and is only available to Fidelity account holders.


