RBC Sets S&P 500 Target at 7,750 Using a Single Model
37 mins ago

Westpac shares are trading around A$38.94 as of mid-session on 8 May 2026, falling harder than the broader ASX 200, and two distinct forces are colliding to explain the move. The bank’s ex-dividend date landed on the same morning as a fresh wave of geopolitical uncertainty tied to US-Iran tensions and Strait of Hormuz supply risk. For retail investors watching the Westpac share price slide, the question is straightforward: how much of today’s drop is mechanical, how much is macro-driven, and does either signal a problem with the underlying business? What follows separates the two drivers, explains the mechanics behind each, and places today’s move within the context of a bank that reported broadly stable earnings just three days ago.
Westpac is underperforming the index by a clear margin in Thursday’s session. The gap is wide enough to prompt the question, but narrow enough that two identifiable forces can explain it without reaching for a company-specific problem.
The key data points as of mid-session:
The financial sector’s underperformance confirms this is not a Westpac-only story. It is a sector-wide event. What makes it worth unpacking is that WBC entered today’s session with momentum: the stock had gained approximately 2.34% across the three prior trading sessions, making the reversal feel sharper than the raw numbers alone suggest.
Two forces are responsible. One is structural and predictable. The other arrived overnight.
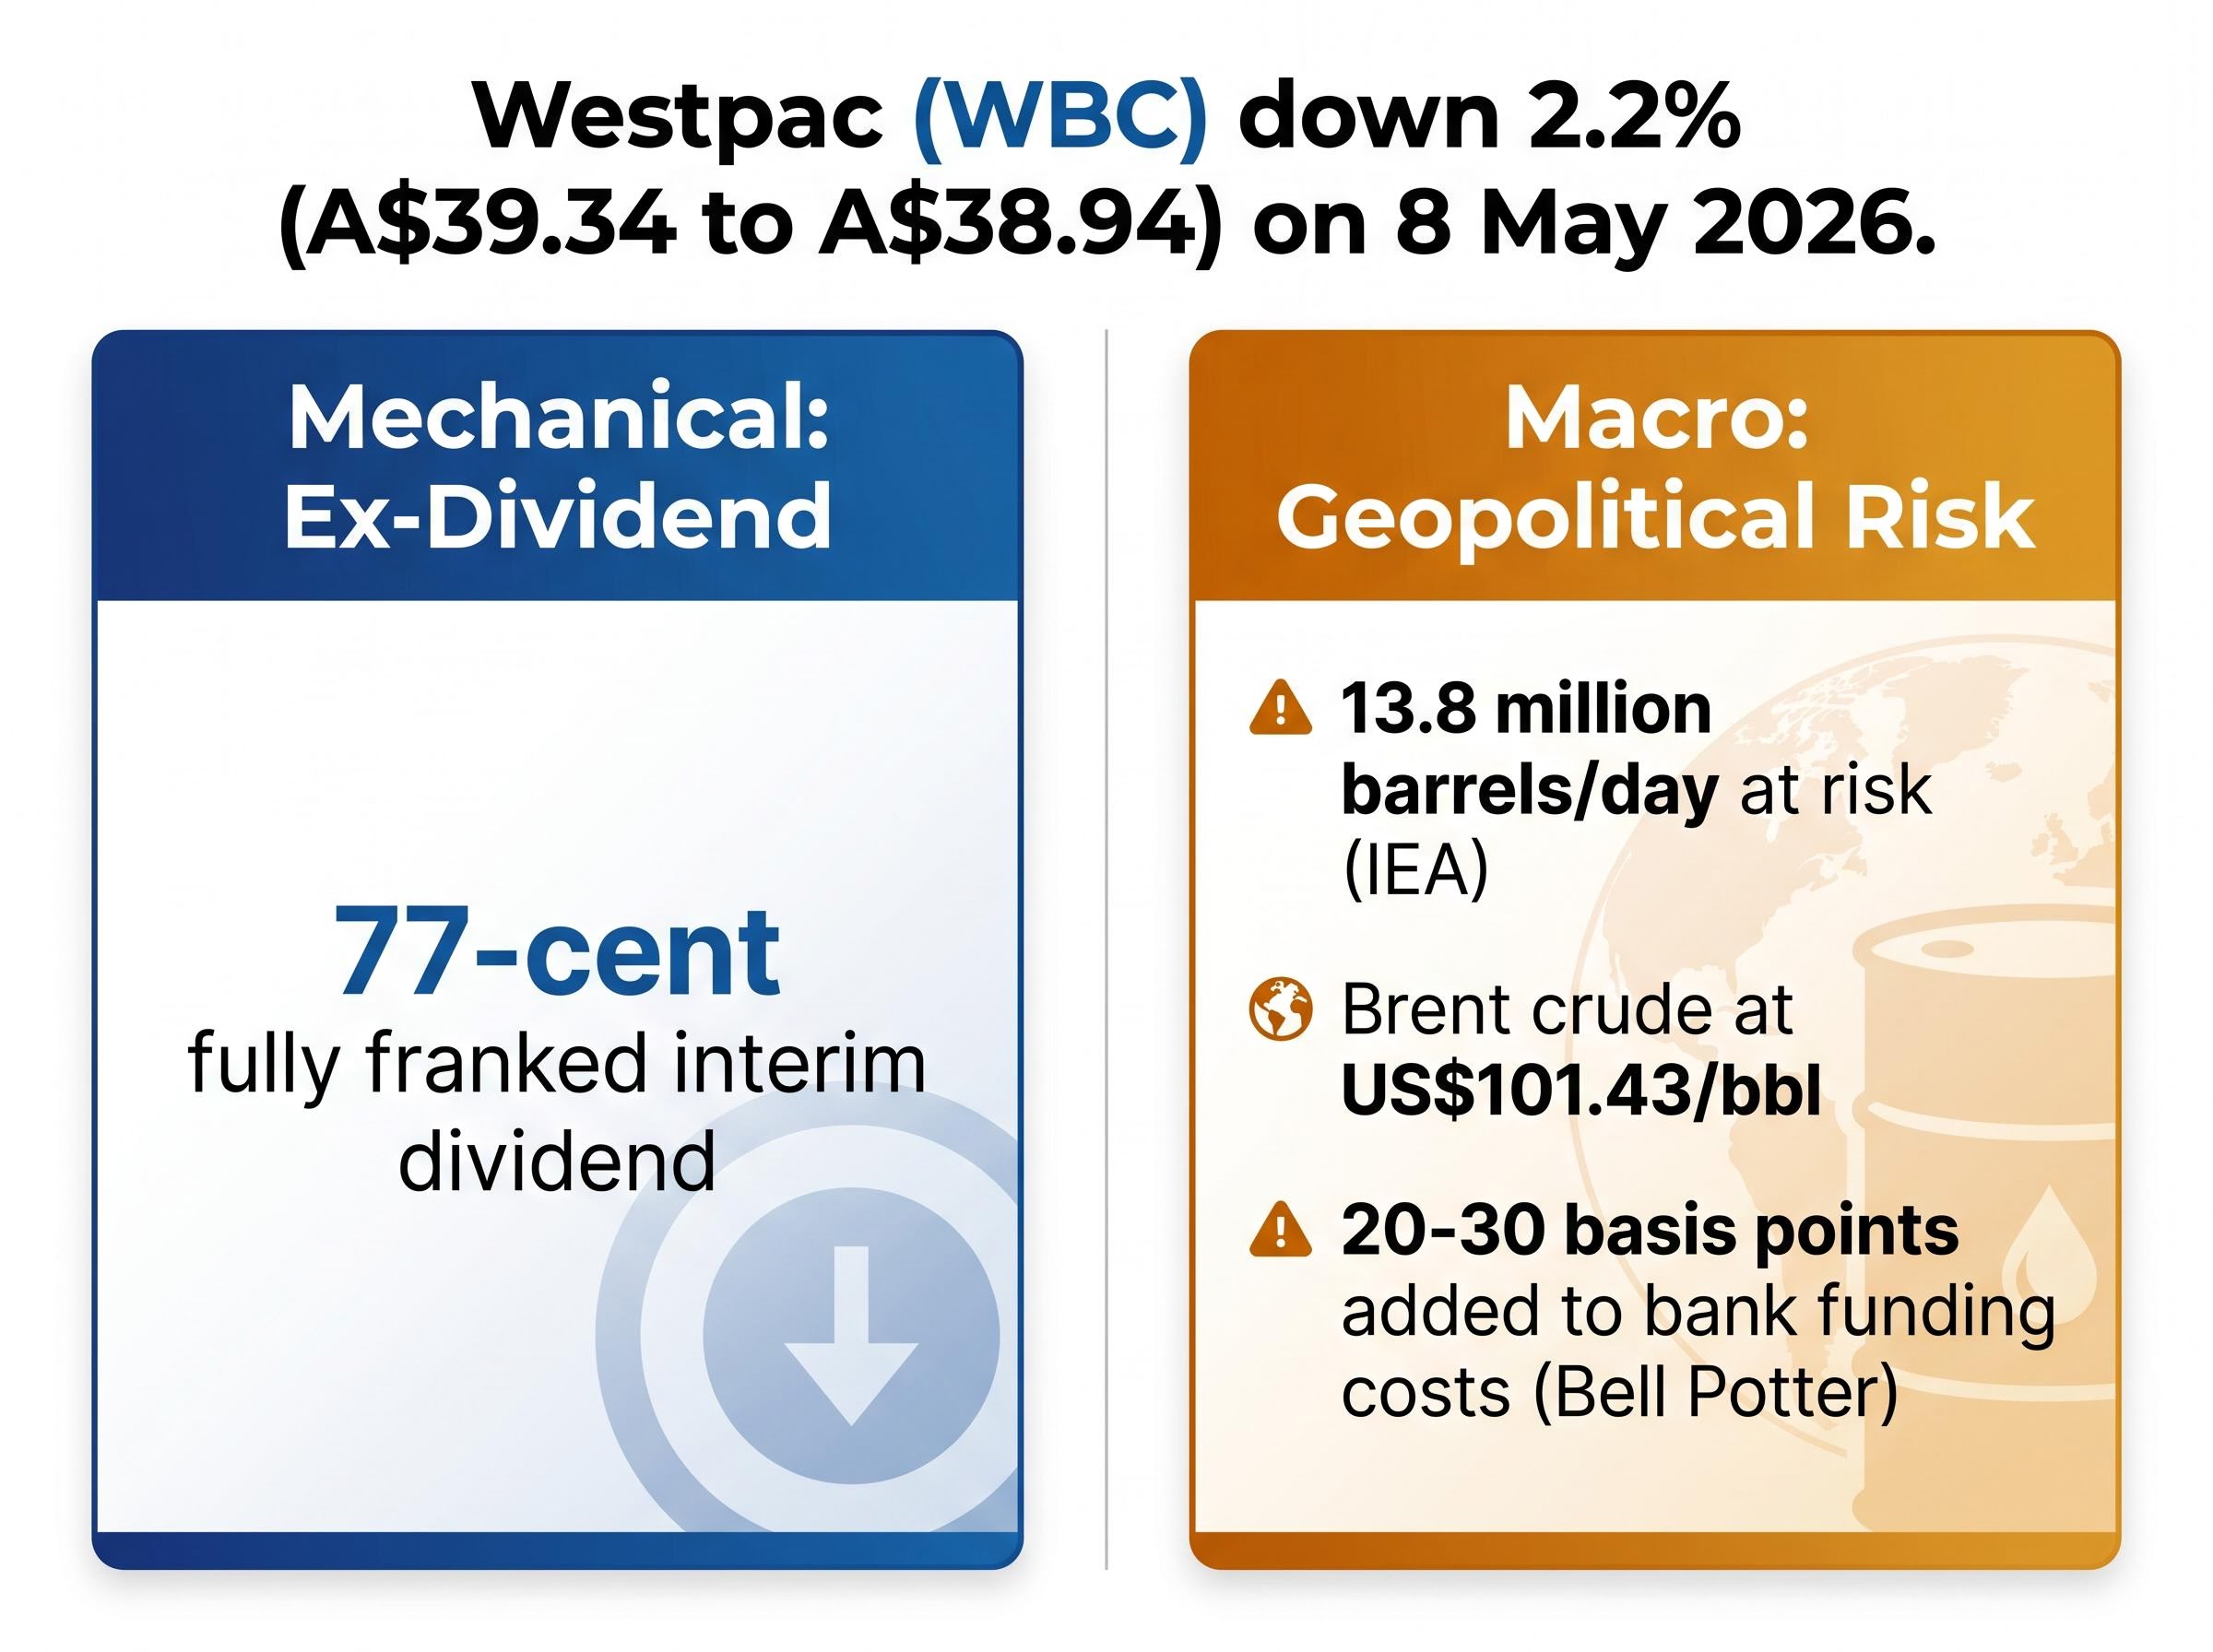
The first driver is mechanical. 8 May 2026 is Westpac’s ex-dividend date for its 77-cent fully franked interim dividend. Buyers who purchase shares on or after this date do not receive the upcoming payment. The share price adjusts downward to reflect that the entitlement has been stripped out.
For investors who missed today’s cutoff, ex-dividend date mechanics extend beyond the calendar date: the T+2 settlement cycle means shares must be purchased at least two trading days before the ex-dividend date to appear on the share register, and the 45-day holding rule applies separately for investors seeking to claim the associated franking credits.
This is not a sign of weakness. It is a structural feature of how dividend-paying shares are priced. The 77 cents represents a direct transfer of value from the share price to the dividend payment, not a loss of value. Westpac’s dividend payout ratio for the half stands at 77.1%, and the interim dividend is down 1.3% versus the prior year’s interim payment, a modest reduction rather than a material cut.
Westpac interim dividend: 77 cents per share, fully franked. Payment date: 26 June 2026.
At current prices, the post-ex-dividend yield on WBC sits at approximately 4.1%. For yield-focused investors who purchased before the ex-dividend date, the next structural anchor is the payment itself.
Fully franked means Westpac has already paid Australian corporate tax on the profit behind the dividend. Eligible shareholders, particularly those in lower tax brackets or holding shares through superannuation funds, can claim franking credits against their personal tax liability. The practical effect is that the after-tax yield is higher than the headline 4.1% figure for many Australian holders, a distinction that matters when comparing bank dividends to other income sources.
The grossed-up dividend yield matters more than the headline cash figure for many Australian holders: at the 30% corporate tax rate, the standard formula converts a 77-cent fully franked payment into approximately $1.10 of total pre-tax value per share for eligible low-tax investors and SMSFs in pension phase.
The ex-dividend adjustment accounts for much of today’s decline, but not all of it. The gap between WBC’s fall and the mechanical 77-cent adjustment points to a second force: overnight developments in US-Iran tensions that hit risk-sensitive assets across the ASX.
A fragile ceasefire between the US and Iran is broadly holding, but Strait of Hormuz incidents between 5 and 7 May kept risk elevated heading into Thursday’s session. The US confirmed sanctions targeting Iran-China oil trade around 1 May 2026, and the market is pricing the possibility that supply disruptions could persist or escalate.
The Hormuz triple lock, combining US naval blockade operations, Iranian toll enforcement on commercial vessels, and the near-total withdrawal of war-risk insurance coverage, has effectively closed the strait to standard commercial traffic even during periods when physical passage was technically possible, which explains why Brent crude remains elevated despite intermittent ceasefire signals.
The IEA’s April 2026 Oil Market Report estimates approximately 13.8 million barrels per day at risk through a Strait of Hormuz disruption, a figure that underscores why energy markets remain on edge.
| Factor | Data Point | Implication for ASX Banks |
|---|---|---|
| Brent crude | US$101.43/bbl, up ~1.37% intraday on 8 May | Elevated energy costs feed into broader inflation and funding cost pressures |
| IEA supply disruption estimate | ~13.8 million barrels/day at risk | Sustained disruption could weigh on economic growth outlooks and loan quality |
| Bell Potter funding cost estimate | 20-30 basis points added to bank funding costs | Direct margin pressure if oil price disruption persists |
Australian bank stocks are not oil companies, but elevated energy costs feed into funding cost pressures that affect margins. Bell Potter commentary flagged that oil price disruption and elevated energy costs could add 20-30 basis points to bank funding costs, a headwind that helps explain why financials are the weakest ASX sector today.
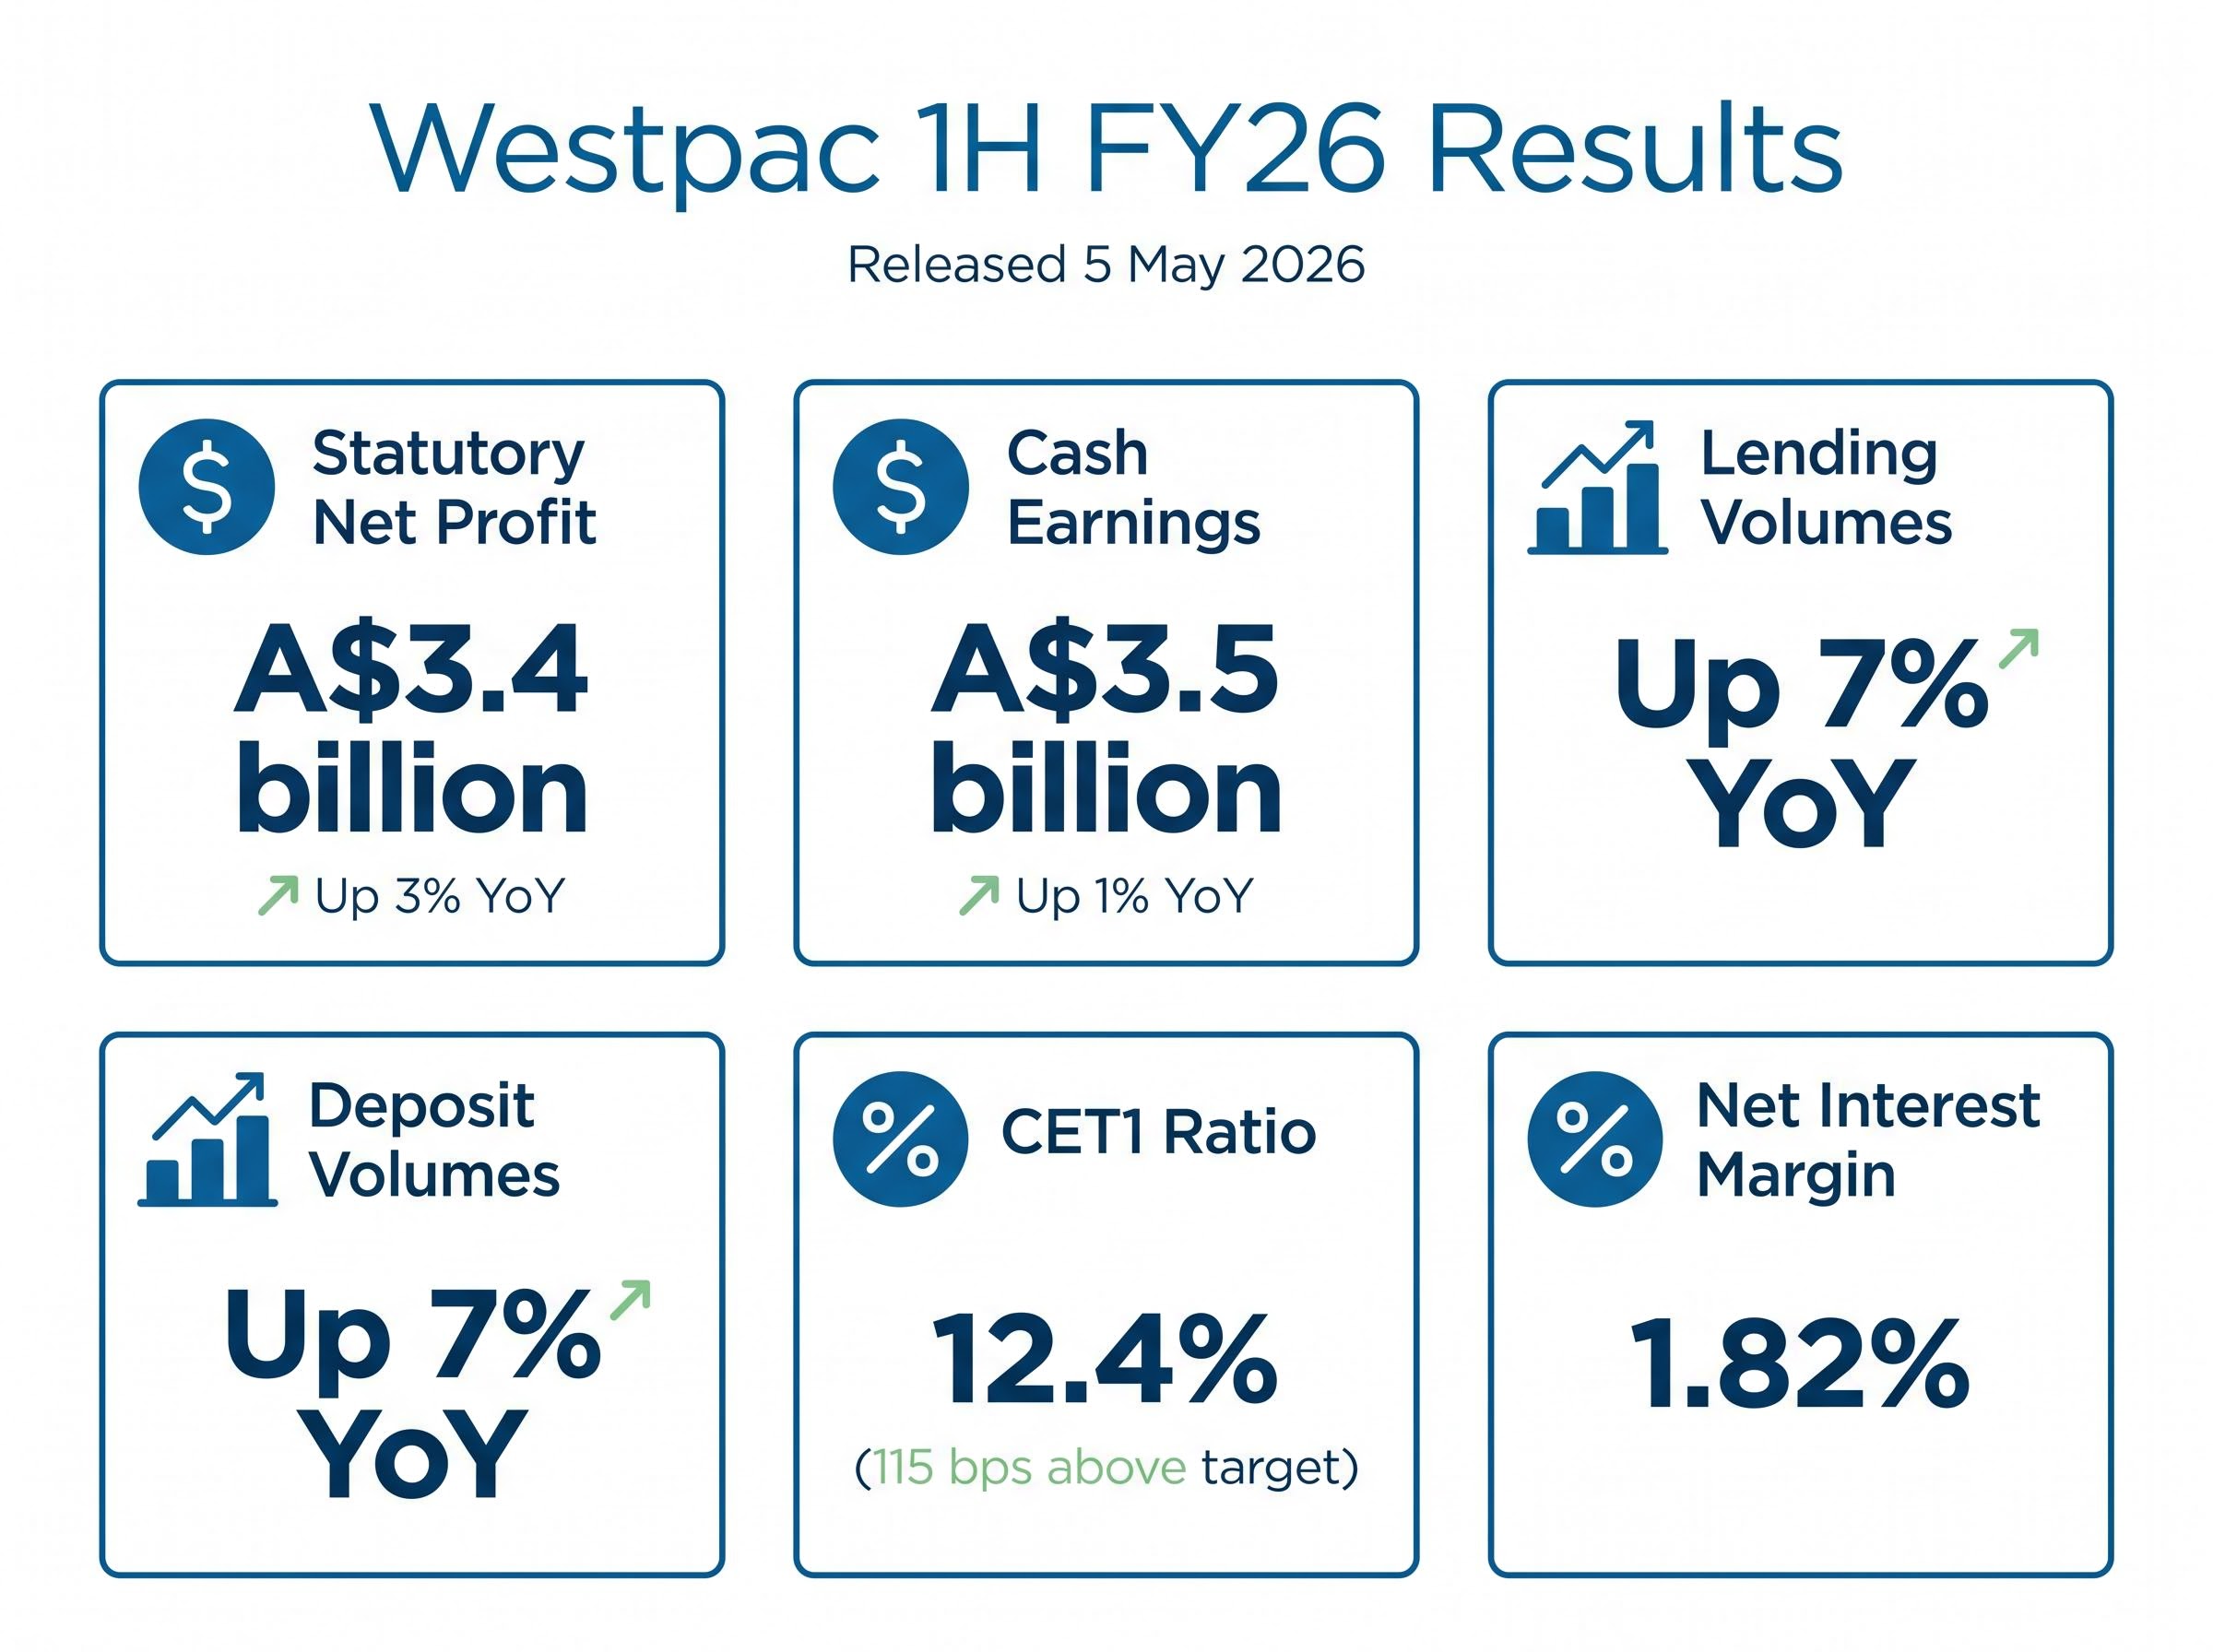
Three days before the share price drop, Westpac disclosed a set of half-year results that told a different story. The 1H FY26 result, released on 5 May 2026, was solid rather than spectacular: growth in key metrics, a comfortable capital position, and a management team framing the bank as well-positioned for uncertainty.
| Metric | 1H FY26 | Comparison Period | Change |
|---|---|---|---|
| Statutory net profit | A$3.4 billion | 1H FY25 | Up 3% |
| Cash earnings | A$3.5 billion | 1H FY25 | Up 1% |
| Lending volumes | Up 7% YoY | 1H FY25 | Broad-based growth |
| Deposit volumes | Up 7% YoY | 1H FY25 | Broad-based growth |
| CET1 capital ratio | 12.4% | Internal target: 11.25% | 115 bps above target |
The net interest margin came in at 1.82% for the half. Statutory net profit was down 5% versus 2H FY25, a sequential decline, but up year-on-year. CEO Anthony Miller framed the result around resilience and disciplined balance sheet management, positioning the bank for a period of global uncertainty. The CET1 ratio of 12.4%, sitting 115 basis points above the bank’s own internal target, is the metric most relevant to risk-conscious investors assessing capital adequacy.
For investors wanting to assess whether today’s share price level represents a genuine entry point, our full explainer on Westpac’s 1H FY26 result examines the consensus miss in detail, the 16% business lending surge, the surplus capital position, and CEO Anthony Miller’s explicit flagging of Middle East and Iran risks as second-half headwinds to net interest margin.
APRA’s APS 110 Capital Adequacy standard sets the minimum CET1 ratio requirement for authorised deposit-taking institutions and defines the capital conservation buffer that sits above it, making Westpac’s 12.4% CET1 ratio, which clears the regulatory floor by a meaningful margin, a key indicator of balance sheet resilience rather than a marketing figure.
Westpac’s decline is not an outlier. Every major bank is weaker on Thursday, confirming that the sell-off is sector-driven rather than company-specific.
| Bank | Prior Close (7 May) | Intraday Level (8 May) | Approximate Move |
|---|---|---|---|
| Westpac (WBC) | A$39.34 | A$38.94 | Down ~2.2% (includes ex-div) |
| CBA | ~A$177.50-A$180.24 | A$175.97 | Down ~1.81% |
| ANZ | A$37.51 | A$36.93 | Down ~1.5% |
| NAB | ~A$40.03 | ~A$39.39-A$40.36 | Range-bound, weaker |
All figures reflect intraday data as of approximately 13:37 AEST on 8 May 2026; official closing prices are not yet available.
CBA’s decline of approximately 1.81% is notable because Commonwealth Bank is not ex-dividend today, yet it is still falling harder than the ASX 200. That pattern validates the geopolitical and sentiment reading rather than any Westpac-specific concern. Macquarie has framed WBC as a “buy the dip” opportunity with a price target of approximately A$40, citing the CET1 ratio of 12.4% and 4% loan growth as the core of the bull case. For balance, Simply Wall St’s fair value model estimates WBC at A$34.87, flagging the stock as approximately 7.9% overvalued at certain price levels.
Two scenarios sit in front of investors watching this move, and they carry different timeframes and different levels of certainty.
Over the prior 12 months, Westpac shares have gained approximately 24%. For 2026 calendar year to date, the stock is down approximately 3%.
That 24% gain provides a proportionality frame. Today’s 2.2% decline is meaningful in isolation but sits within a period of strong outperformance. The post-ex-dividend yield of approximately 4.1%, Macquarie’s A$40 price target, and the dividend payment date of 26 June represent the near-term reference points for investors weighing their next move.
This article is for informational purposes only and should not be considered financial advice. Investors should conduct their own research and consult with financial professionals before making investment decisions.
Today’s Westpac decline is readable once the two drivers are separated. The 77-cent ex-dividend adjustment is structural, predictable, and accounts for the bulk of the move. The geopolitical layer, anchored by the IEA’s estimate of 13.8 million barrels per day at risk through the Strait of Hormuz, is unpredictable but well-documented, and it explains why the drop exceeded the mechanical adjustment and why every big four bank is weaker today.
The sector-wide pattern removes the concern that Westpac-specific risk is driving the move. Financials are the weakest ASX sector, not because of any single bank, but because geopolitical uncertainty is repricing risk across the board.
The market’s next tests on this story:
Past performance does not guarantee future results. Financial projections are subject to market conditions and various risk factors.
An ex-dividend date is the cutoff after which new buyers are no longer entitled to the upcoming dividend payment. The share price typically falls by approximately the dividend amount on this date because the value of that payment has been transferred out of the stock and into the hands of eligible shareholders.
Westpac declared a 77-cent fully franked interim dividend for the first half of FY26, with a payment date of 26 June 2026. The ex-dividend date was 8 May 2026, meaning investors needed to hold shares before that date to qualify for the payment.
Fully franked means Westpac has already paid Australian corporate tax on the profits behind the dividend, and eligible shareholders can claim those franking credits to offset their personal tax liability. For investors in lower tax brackets or SMSFs in pension phase, the after-tax yield is meaningfully higher than the headline cash yield.
All four major banks, Westpac, CBA, ANZ, and NAB, are weaker on 8 May 2026 because the ASX Financials sector is the worst-performing sector on the day, driven by US-Iran tensions and Strait of Hormuz supply risk. Bell Potter estimated that elevated energy costs and oil price disruption could add 20-30 basis points to bank funding costs.
Westpac's 1H FY26 results, released on 5 May 2026, showed statutory net profit of A$3.4 billion (up 3% year on year), lending and deposit volumes each up 7%, and a CET1 capital ratio of 12.4%, which sits 115 basis points above the bank's own internal target.