Morgan Stanley Rules Out Fed Hikes, Names Two Numbers to Watch
17 mins ago

Vanguard has released estimated mid-year distributions for all 16 of its ASX-listed ETFs, and the ex-dividend date falls on 1 July 2026. If you hold units by close of trade on 30 June 2026, you qualify. If you do not, you wait until the next cycle.
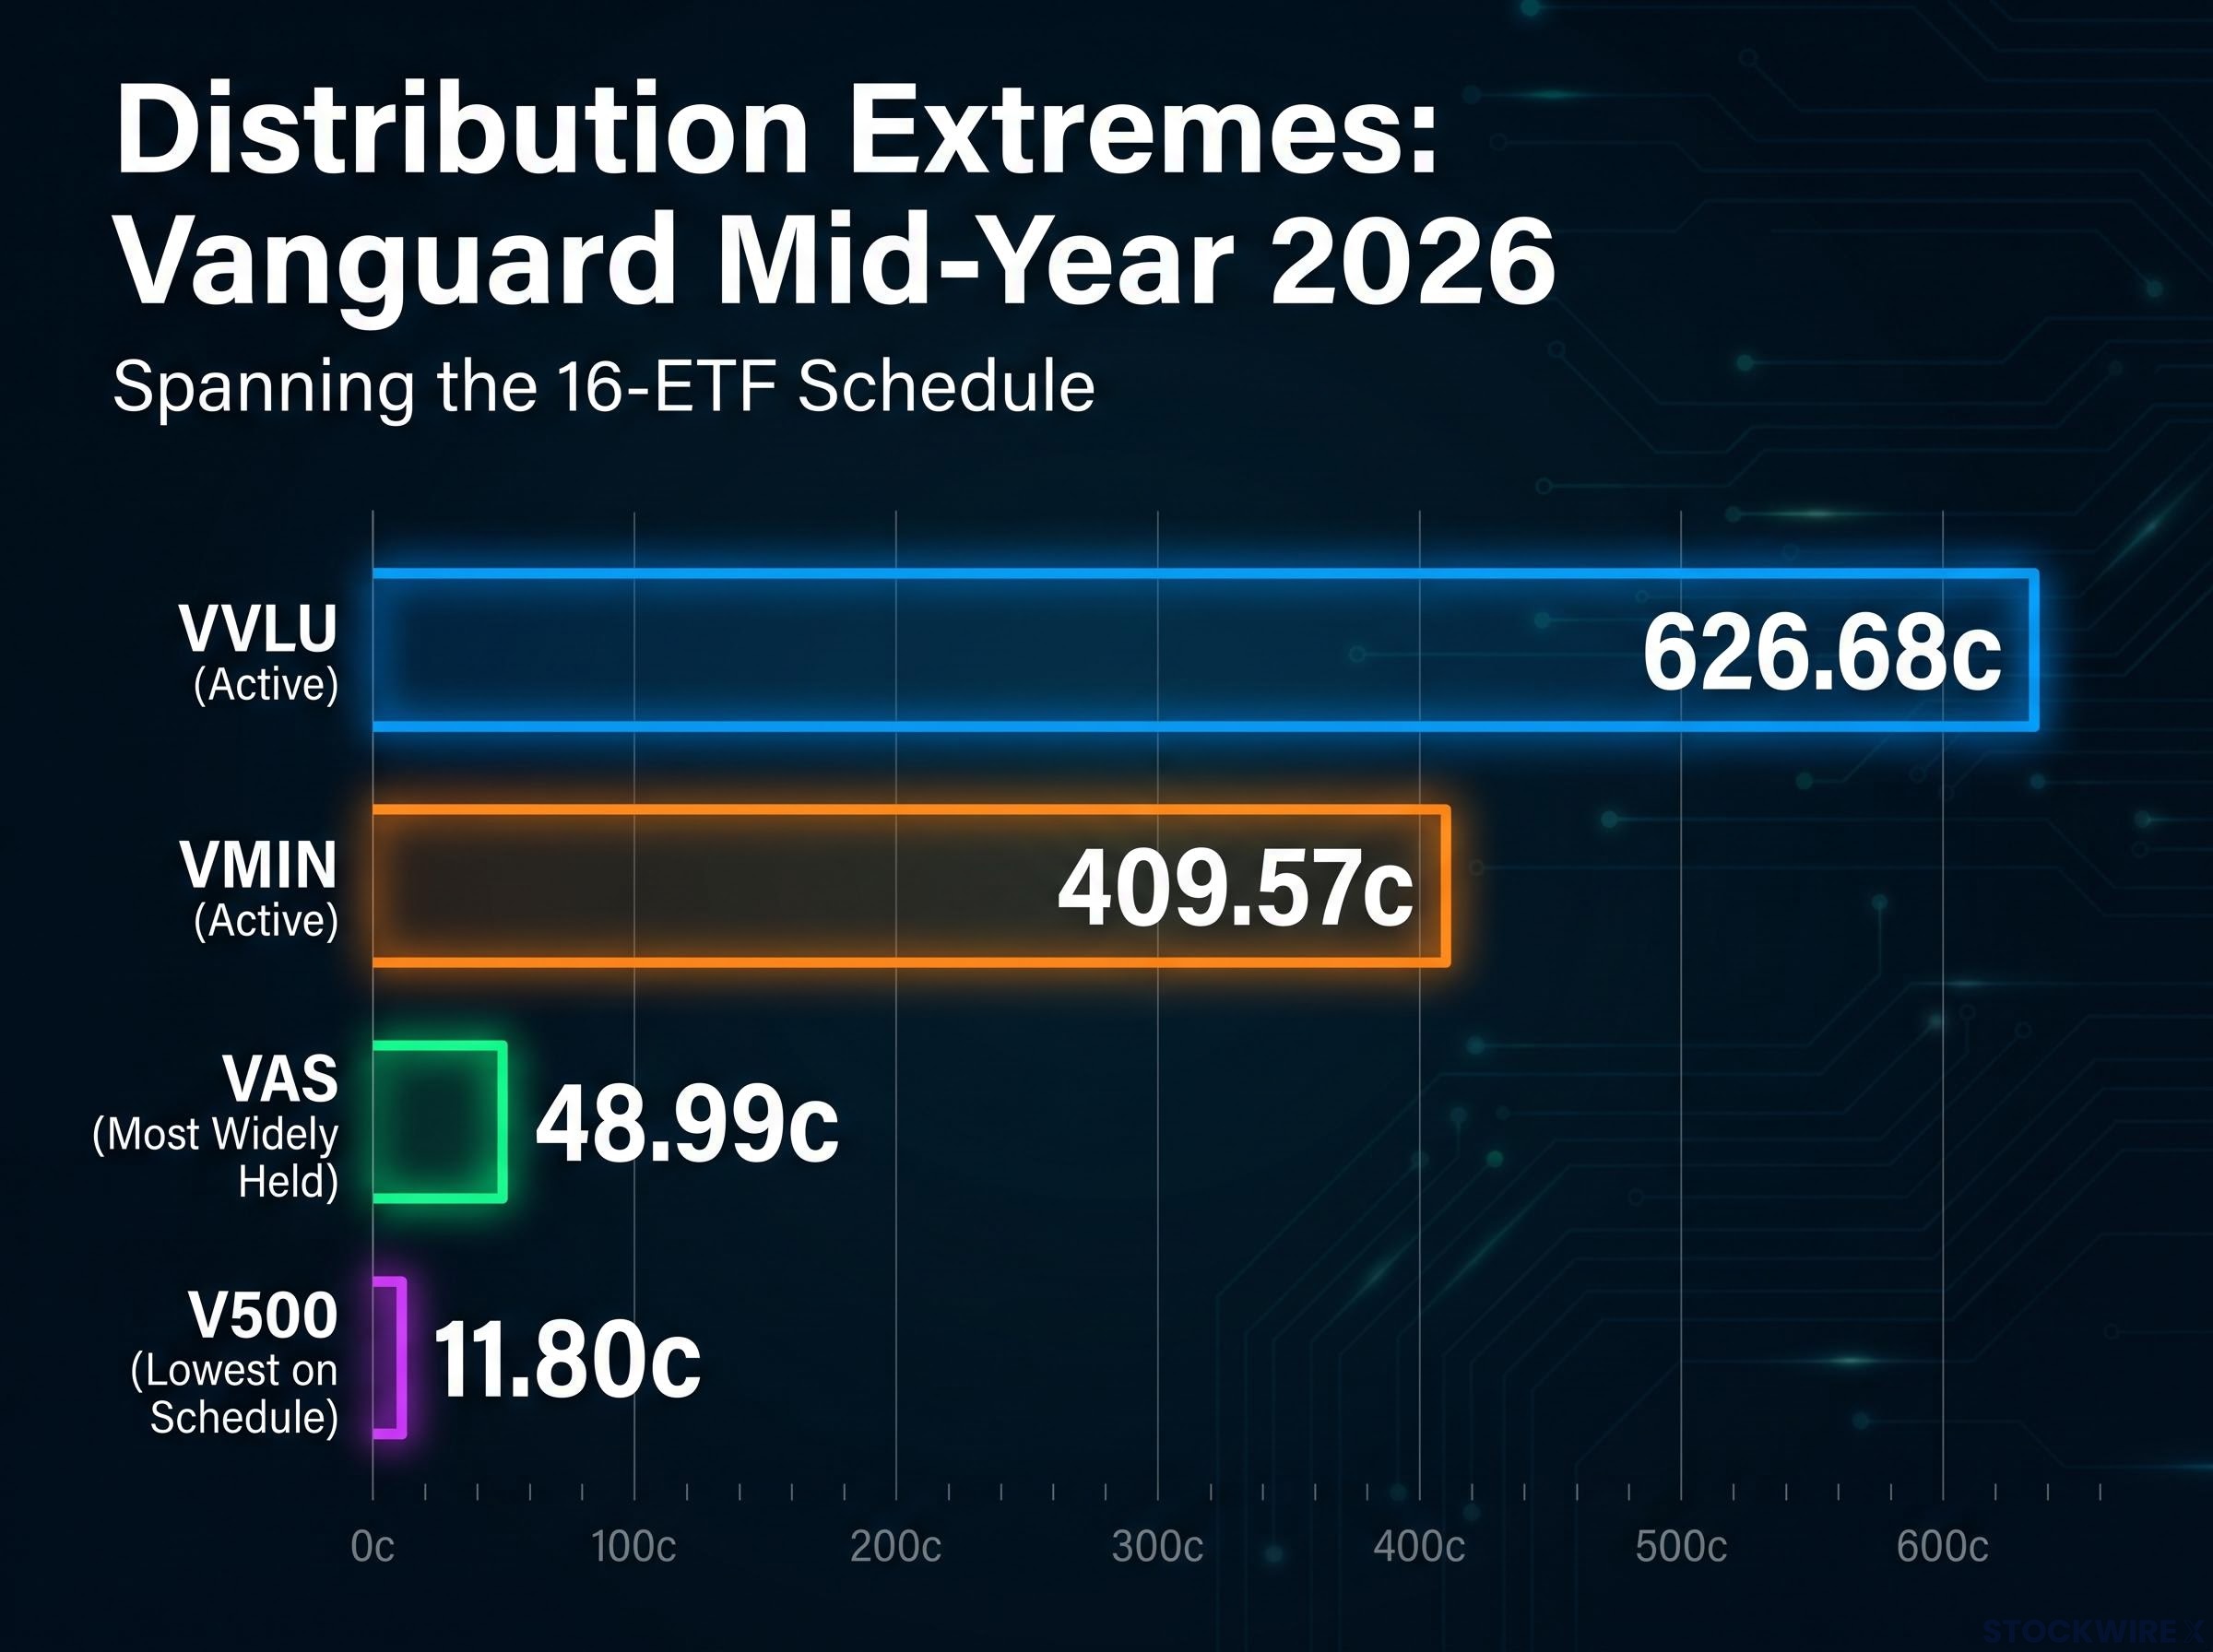
This is one of the largest single-day income events on the Australian ETF calendar. For self-directed investors, retirees, and SMSF members holding Vanguard products, these figures determine the cash arriving in brokerage accounts on 16 July 2026. The estimated payouts range from 11.80 cents per unit (V500) to 626.68 cents per unit (VVLU), spanning Australian equities, international shares, fixed income, property, and actively managed funds.
Here is every estimated payout figure, organised by asset class, plus a clear method for translating those cents-per-unit numbers into the actual cash hitting your account later this month.
Three dates define this distribution cycle:
The ASX operates on T+2 settlement, meaning any trade takes two business days to settle. To be registered as a unitholder on the ex-dividend date, your purchase must be completed and settled by close of trade on 30 June 2026. Any units bought on 1 July 2026 or later will not qualify for this distribution.
ASX T+2 settlement means the two business days between trade execution and legal transfer of ownership are not a formality; they are the mechanism that determines whether a unitholder appears on the register before the ex-dividend date and therefore qualifies for the distribution.
Settlement cutoff: Units must be purchased and settled by close of trade on 30 June 2026 to be eligible for the mid-year distribution. Under ASX T+2 rules, buying on the ex-dividend date or after means waiting until the next quarterly cycle.
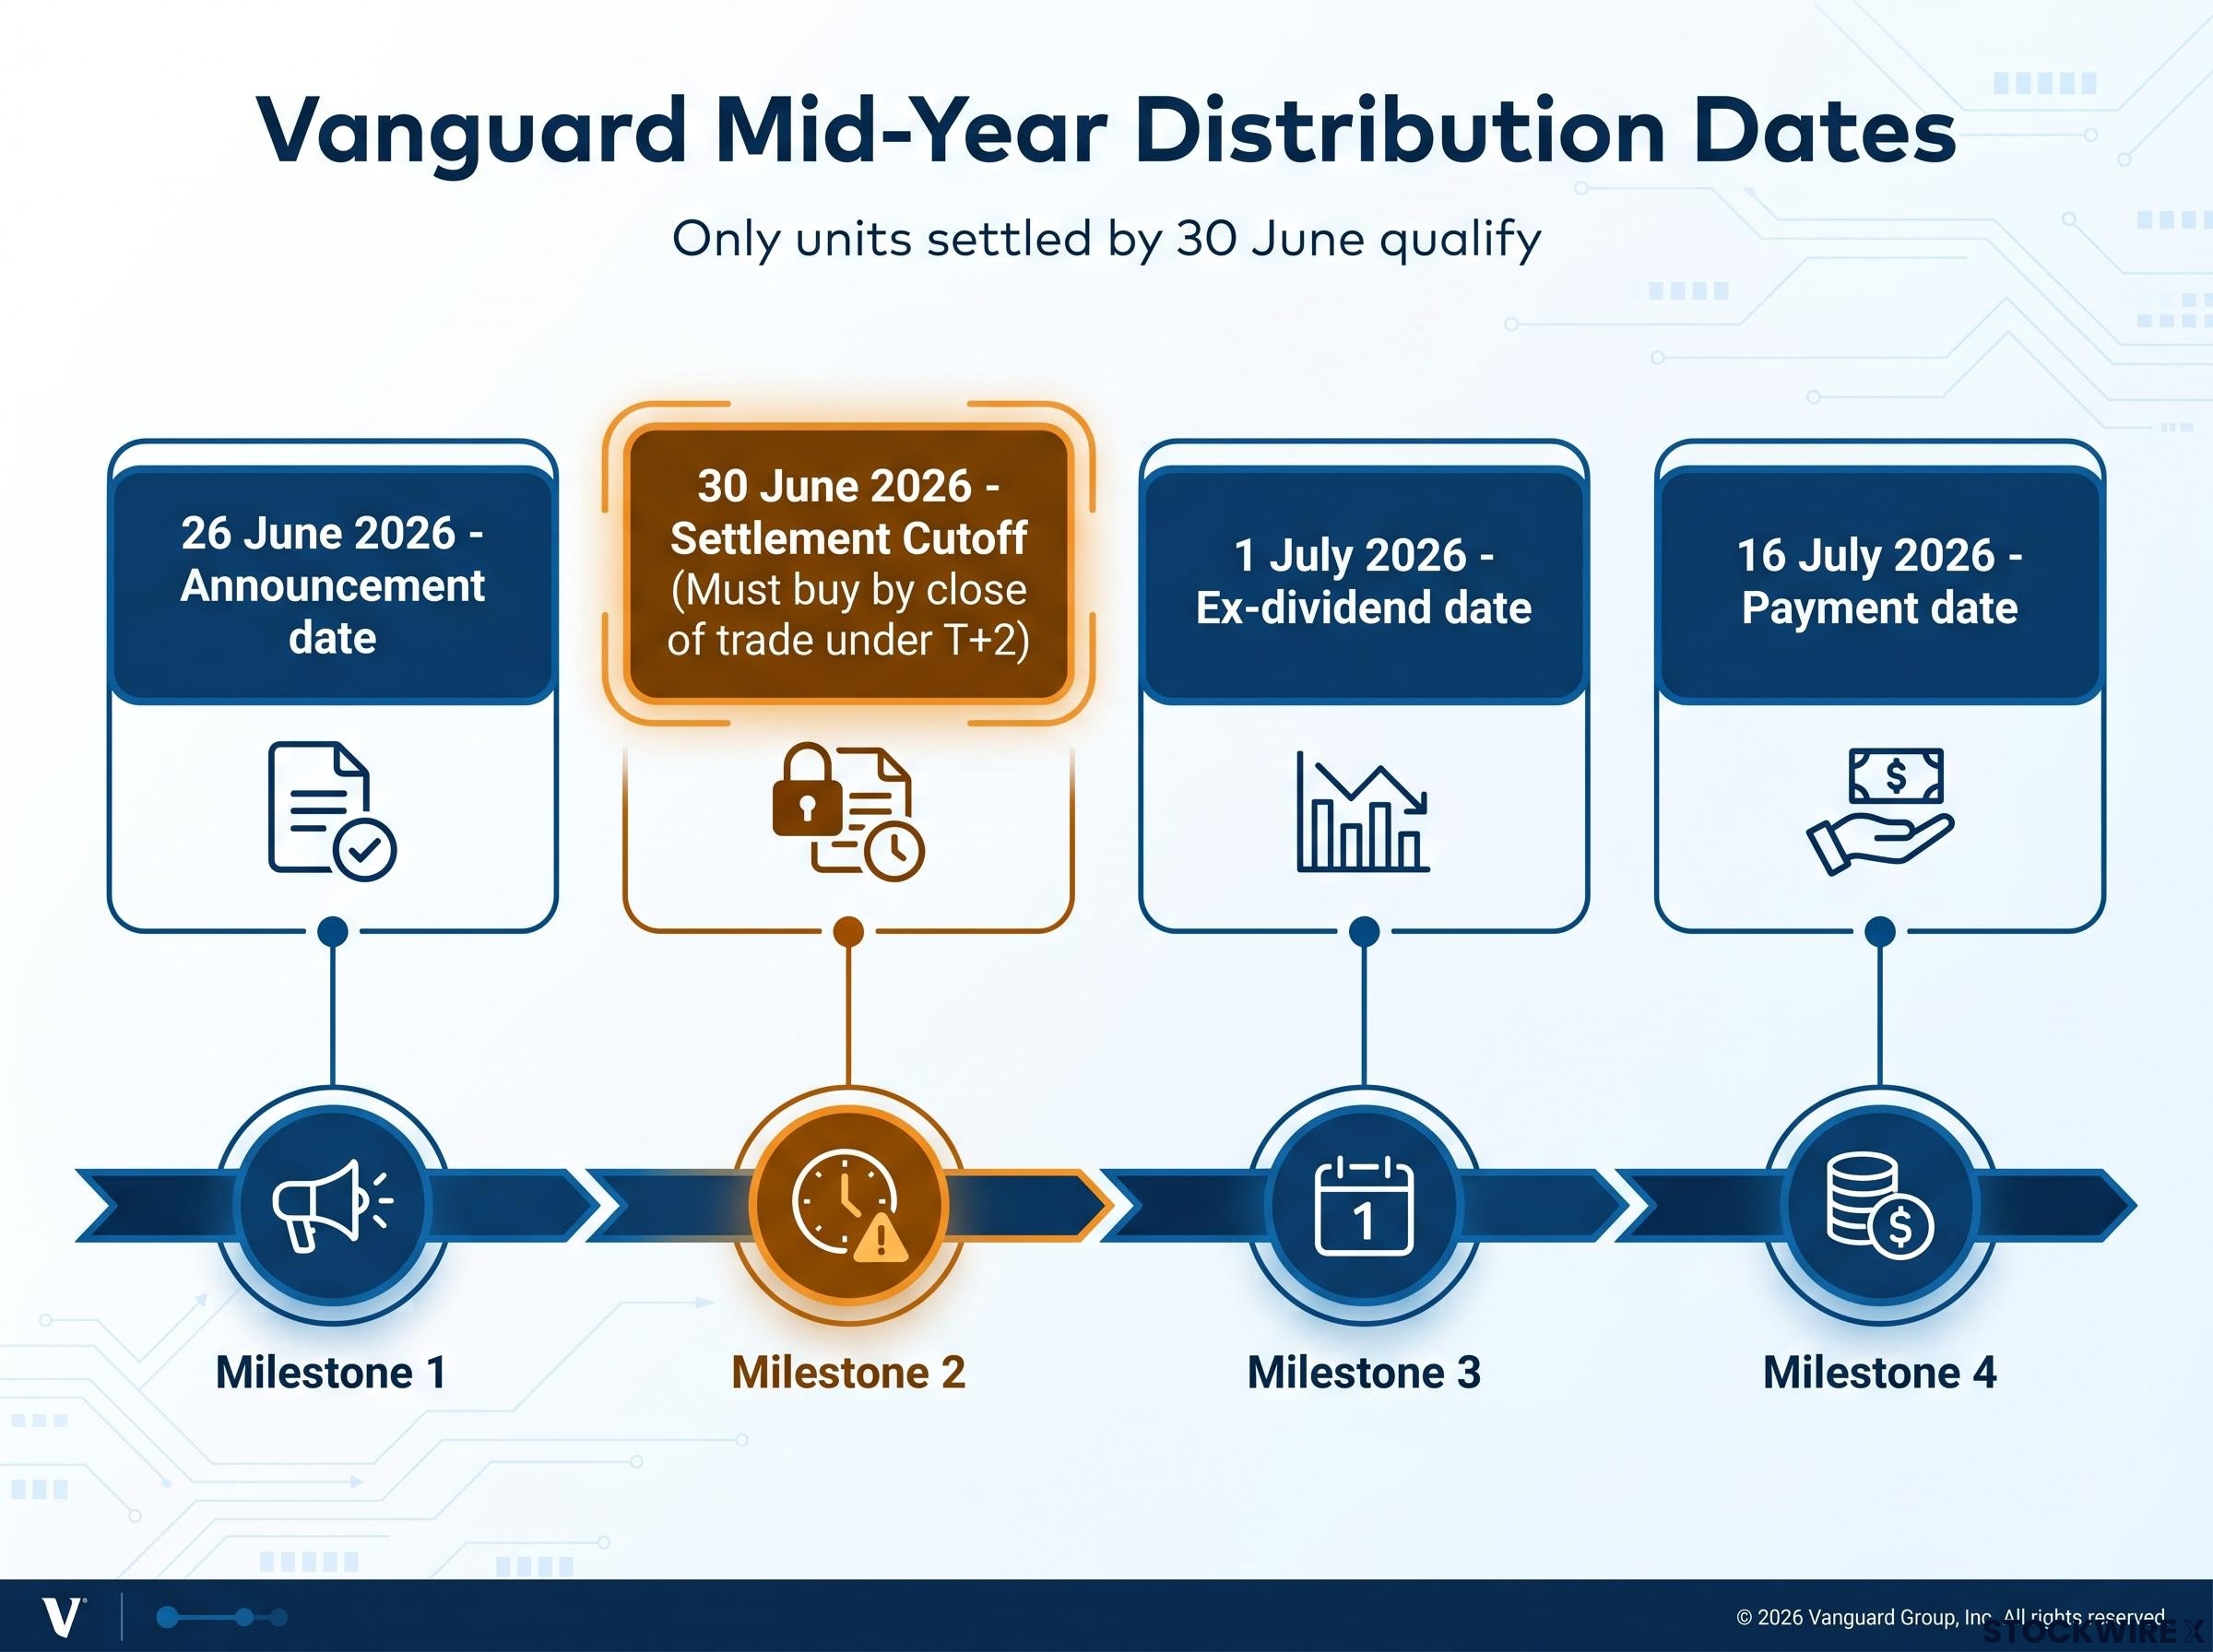
For investors who have been sitting on a decision to add to a Vanguard ETF position, today (26 June 2026) is effectively the last practical window to act if capturing this distribution matters.
All figures announced are estimates and may be subject to minor adjustment before the 16 July 2026 payment date.
The most common misread in ETF distribution announcements is treating a bigger cents-per-unit number as a better income outcome. It is not that simple. A high per-unit figure can reflect a higher unit price rather than a more generous income rate.
The comparison that matters is the distribution yield: the payout relative to what you paid for the unit.
Dividend trap mechanics on the ASX are partly sustained by this same per-unit confusion: a falling unit price mechanically lifts the distribution yield, making a deteriorating position appear to be generating better income precisely as its capital base erodes.
Distribution yield = Distribution per unit ÷ Current unit price
Without this context, you might look at VVLU paying 626.68 cents and VAS paying 48.99 cents and conclude that VVLU is a dramatically better income investment. It may or may not be. The unit price changes the picture entirely.
To calculate the actual cash you will receive, two steps:
This framework applies to every figure in the tables below. Keep it in mind as the numbers get larger.
The domestic equity ETFs span the full capitalisation range, and their per-unit figures reflect that structure.
| ETF Code | ETF Name | Benchmark | Est. Distribution |
|---|---|---|---|
| VAS | Vanguard Australian Shares Index ETF | S&P/ASX 300 Index | 48.99c |
| VHY | Vanguard Australian Shares High Yield ETF | FTSE Australia High Dividend Yield Index | 40.82c |
| VSO | Vanguard MSCI Australian Small Companies Index ETF | MSCI Australian Shares Small Cap Index | 219.83c |
| VLC | Vanguard MSCI Australian Large Companies Index ETF | MSCI Australian Shares Large Cap Index | 26.81c |
| VETH | Vanguard Ethically Conscious Australian Shares ETF | FTSE Australia 300 Choice Index | 34.38c |
VSO leads all domestic equity ETFs at 219.83 cents per unit, but that figure reflects its small-cap mandate and correspondingly lower unit prices, not a yield advantage over the rest of the group.
VHY is explicitly designed to target higher-yielding Australian equities, yet its per-unit distribution this cycle is lower than VAS. That feels counterintuitive until you remember that per-unit comparisons across ETFs with different unit price structures are not meaningful without running the yield formula above.
VAS remains the most widely held ETF on the ASX. Its 48.99 cents will translate directly into cash flow for a very large number of Australian investors.
| ETF Code | ETF Name | Benchmark | Est. Distribution |
|---|---|---|---|
| VAF | Vanguard Australian Fixed Interest Index ETF | Bloomberg AusBond Composite 0+ Yr Index | 53.42c |
| VAP | Vanguard Australian Property Securities Index ETF | S&P/ASX 300 A-REIT Index | 146.84c |
VAP’s 146.84 cents reflects the income-distribution structure of Australian Real Estate Investment Trusts (A-REITs), which are entities that own or finance income-producing property and are required to distribute the majority of their taxable income to unitholders.
The international lineup covers developed markets, small caps, Europe, the US large-cap index, and diversified global growth.
| ETF Code | ETF Name | Benchmark | Est. Distribution |
|---|---|---|---|
| VGS | Vanguard MSCI Index International Shares ETF | MSCI World ex-Australia (~1,500 stocks) | 80.11c |
| VGAD | Vanguard MSCI Index International Shares (Hedged) ETF | MSCI World ex-Australia (AUD hedged) | 234.31c |
| VISM | Vanguard MSCI International Small Companies Index ETF | MSCI World ex-Australia Small Cap Index | 323.31c |
| V500 | Vanguard S&P 500 US Shares Index ETF | S&P 500 Index | 11.80c |
| VEQ | Vanguard FTSE Europe Shares ETF | FTSE Developed Europe All Cap Index | 97.91c |
| VDHG | Vanguard Diversified High Growth Index ETF | ~16,000 Australian and international equities | 121.86c |
| VESG | Vanguard Ethically Conscious International Shares Index ETF | FTSE Developed ex Australia Choice Index | 64.45c |
The most common question here involves the gap between VGAD and VGS.
VGAD pays 234.31 cents versus VGS at 80.11 cents. The difference reflects currency hedging effects on distribution composition, not a yield advantage of one structure over the other. If you hold both for currency diversification, the three-fold gap in per-unit payouts does not mean VGAD is generating three times the income on a yield basis.
V500 sits at the bottom of the entire 16-ETF schedule at 11.80 cents per unit. That reflects the low dividend yield environment of large-cap US equities and the fund’s unit price structure. VGS, which holds diversified developed-market shares from outside Australia and is among the most widely owned international ETFs on the ASX, pays 80.11 cents and serves as the benchmark data point for a significant portion of Australian ETF investors.
International share exposure through ASX-listed ETFs like VGS, VGAD, and VISM handles foreign withholding tax and currency conversion at the fund level, which simplifies the tax reporting burden that would otherwise arise from holding the underlying foreign securities directly in a brokerage account.
VVLU pays 626.68 cents per unit. VMIN pays 409.57 cents per unit. These are the two highest figures in the entire Vanguard mid-year distribution schedule, and they are not index ETFs.
| ETF Code | ETF Name | Structure | Est. Distribution |
|---|---|---|---|
| VVLU | Vanguard Global Value Equity Active ETF | Actively managed (FTSE Developed All Cap / Russell 3000 universe) | 626.68c |
| VMIN | Vanguard Global Minimum Volatility Active ETF | Actively managed (~200 global equities) | 409.57c |
At 626.68 cents per unit, VVLU tops the entire Vanguard mid-year distribution schedule, paying out more than any other ETF in this cycle.
Both funds are actively managed. VVLU draws its investment universe primarily from the FTSE Developed All Cap Index and the Russell 3000 Index, seeking out global equities trading at valuations below their assessed worth. VMIN constructs a portfolio of around 200 global equities, aiming to produce a smoother return profile than the FTSE Global All Cap Index (AUD Hedged).
Their high per-unit figures reflect their investment structure and unit pricing. If you are attracted to either fund on the basis of those headline numbers, calculate the implied yield at current unit prices before drawing any conclusions about income efficiency relative to Vanguard’s index ETFs.
Four steps, in order:
ETF tax obligations in Australia extend well beyond noting the total distribution received; each component, whether franked dividends, foreign income, or capital gains distributions, carries its own reporting requirement and cost base treatment under ATO managed investment trust rules.
This article is for informational purposes only and should not be considered financial advice. Investors should conduct their own research and consult with financial professionals before making investment decisions.
The full Vanguard mid-year distribution schedule, ranked from highest to lowest estimated payout:
| ETF Code | ETF Name | Est. Distribution (cents per unit) |
|---|---|---|
| VVLU | Vanguard Global Value Equity Active ETF | 626.68c |
| VMIN | Vanguard Global Minimum Volatility Active ETF | 409.57c |
| VISM | Vanguard MSCI International Small Companies Index ETF | 323.31c |
| VGAD | Vanguard MSCI Index International Shares (Hedged) ETF | 234.31c |
| VSO | Vanguard MSCI Australian Small Companies Index ETF | 219.83c |
| VAP | Vanguard Australian Property Securities Index ETF | 146.84c |
| VDHG | Vanguard Diversified High Growth Index ETF | 121.86c |
| VEQ | Vanguard FTSE Europe Shares ETF | 97.91c |
| VGS | Vanguard MSCI Index International Shares ETF | 80.11c |
| VESG | Vanguard Ethically Conscious International Shares Index ETF | 64.45c |
| VAF | Vanguard Australian Fixed Interest Index ETF | 53.42c |
| VAS | Vanguard Australian Shares Index ETF | 48.99c |
| VHY | Vanguard Australian Shares High Yield ETF | 40.82c |
| VETH | Vanguard Ethically Conscious Australian Shares ETF | 34.38c |
| VLC | Vanguard MSCI Australian Large Companies Index ETF | 26.81c |
| V500 | Vanguard S&P 500 US Shares Index ETF | 11.80c |
All figures are estimates as at 26 June 2026 and are subject to confirmation before the 16 July 2026 payment date. Confirm final amounts via Vanguard’s website or your broker.
—
The ex-dividend date for Vanguard's mid-year ASX ETF distributions is 1 July 2026. To qualify, investors must hold units settled by close of trade on 30 June 2026 under ASX T+2 settlement rules.
Multiply the estimated cents-per-unit figure by the number of units you hold, then divide by 100. That gives you the approximate AUD amount landing in your brokerage account on the 16 July 2026 payment date.
VVLU's 626.68 cents per unit reflects its unit price structure and active management mandate, not a superior income yield. Comparing per-unit figures across ETFs with different unit prices is misleading; the distribution yield (distribution per unit divided by current unit price) is the correct comparison.
VVLU (Vanguard Global Value Equity Active ETF) pays the highest estimated distribution at 626.68 cents per unit, followed by VMIN (Vanguard Global Minimum Volatility Active ETF) at 409.57 cents per unit.
Vanguard ETF distributions can include multiple components such as franked dividends, foreign income, and capital gains distributions, each with different tax treatment and ATO reporting requirements. Investors with large holdings or complex situations should consult a tax adviser before the 16 July 2026 payment date.