
OpenAI Files for IPO but Targets 2027 for $1 Trillion Debut
6 hrs ago

Morgan Stanley has drawn a line in the sand: no Fed rate hikes through the end of 2026, full stop. But the bank’s Chief U.S. Economist has also named the exact two numbers that would force a rethink.
The June 2026 FOMC meeting has crystallised a tension that matters for every rate-sensitive position in your portfolio. The Fed’s own projections, locked in before a sharp oil price drop, point to conditions that Morgan Stanley believes no longer reflect current economic reality. That gap between the central bank’s internal models and Wall Street’s live analysis is not academic: nine FOMC members still have rate hike projections on the books, built on assumptions that have since shifted.
Here is Morgan Stanley’s full call, where it diverges from the Fed’s own numbers, and the precise thresholds that would flip the bank’s no-hike baseline into something more unsettling for rate-sensitive investors. The numbers you are already seeing in monthly data reports are the ones that matter most, and this framework tells you exactly how to read them.
Michael Gapen, Chief U.S. Economist at Morgan Stanley, published a client note on 26 June 2026, the day after the FOMC meeting, and the message was unequivocal: the Fed holds rates steady through the full end of 2026, with the first potential easing not arriving until the first half of 2027.
What is notable is that the bank’s conviction has actually firmed since the meeting, not softened. Three developments underpin that confidence:
The “higher for longer, then gradual cuts” trajectory is broadly shared across Wall Street. Morgan Stanley’s specific contribution is to define the conditions precisely, giving investors concrete criteria rather than a vague consensus view.
That firming of conviction tells you something directly: recent macro developments have moved in the direction of rate stability, not against it. The current environment gives rate-sensitive portfolios more runway than the FOMC’s own dot plot might suggest.
The disagreement between Morgan Stanley and the Fed is not about economics. It is about sequencing.
The June 2026 dot plot revision from 3.4% to 3.8% for year-end placed at least one 25 basis point hike into the Fed’s own baseline, creating the divergence between the central bank’s internal projections and Morgan Stanley’s no-hike call that sits at the centre of this debate.
Nine FOMC participants submitted rate hike projections that appear to have been drawn up before the U.S.-Iran agreement prompted a sharp slide in oil prices. Those projections may be anchored to an inflation picture that has already changed. Cheaper energy directly reduces headline inflation and, over time, bleeds into core readings as lower fuel, transport, and input costs pass through.
The numbers make the gap concrete. Morgan Stanley puts Q4 2026 headline PCE (Personal Consumption Expenditures, the broadest measure of consumer price changes) at 3.2% and core PCE at 3.0%, figures the bank characterises as substantially lower than the FOMC median projection.
| Metric | Morgan Stanley forecast | FOMC characterisation |
|---|---|---|
| Q4 2026 headline PCE | 3.2% | Considerably higher than Morgan Stanley’s estimate |
| Q4 2026 core PCE | 3.0% | Well above Morgan Stanley’s estimate |
| Near-term monthly core | At or below 0.2% | Not specified at monthly granularity |
Gapen’s projections point to monthly core PCE and CPI readings running no higher than 0.2% in the period ahead, consistent with steady disinflation rather than re-acceleration. The May 2026 core CPI print from the Bureau of Labor Statistics (BLS) landed at exactly +0.2% month-over-month and +2.9% year-over-year.
The FOMC’s dot plot may be anchored to oil price assumptions that have since moved materially. Nine members’ hike projections could be built on a foundation that incoming data is already eroding.
That May print running at exactly 0.2% is validating the bank’s case in real time. The data so far says the Fed’s own projections are working from a pessimistic starting point, and if Morgan Stanley is right, the market pricing implied by those nine hike-leaning dot plot participants is built on a foundation that may crumble as fresher data arrives.
Before the threshold lands, the mechanism matters. Core PCE and core CPI both measure consumer price changes, but they strip out food and energy prices to give a cleaner signal of underlying inflation momentum. Food and energy prices are volatile; they spike on weather events, geopolitical shocks, and supply disruptions. Stripping them out lets the Fed see whether broader price pressures are building or fading.
The April 2026 CPI print reached 3.8% headline on the back of a 28.4% annual surge in fuel costs, yet equity markets barely reacted because the core reading of 2.3% outside commodity-linked categories signalled that second-round effects had not yet propagated into the broader price basket.
The Fed’s preferred measure is core PCE, but core CPI is released earlier each month and is widely watched as a leading indicator. Both matter. Here is the logic chain that explains why 0.3% carries the weight Morgan Stanley assigns to it:
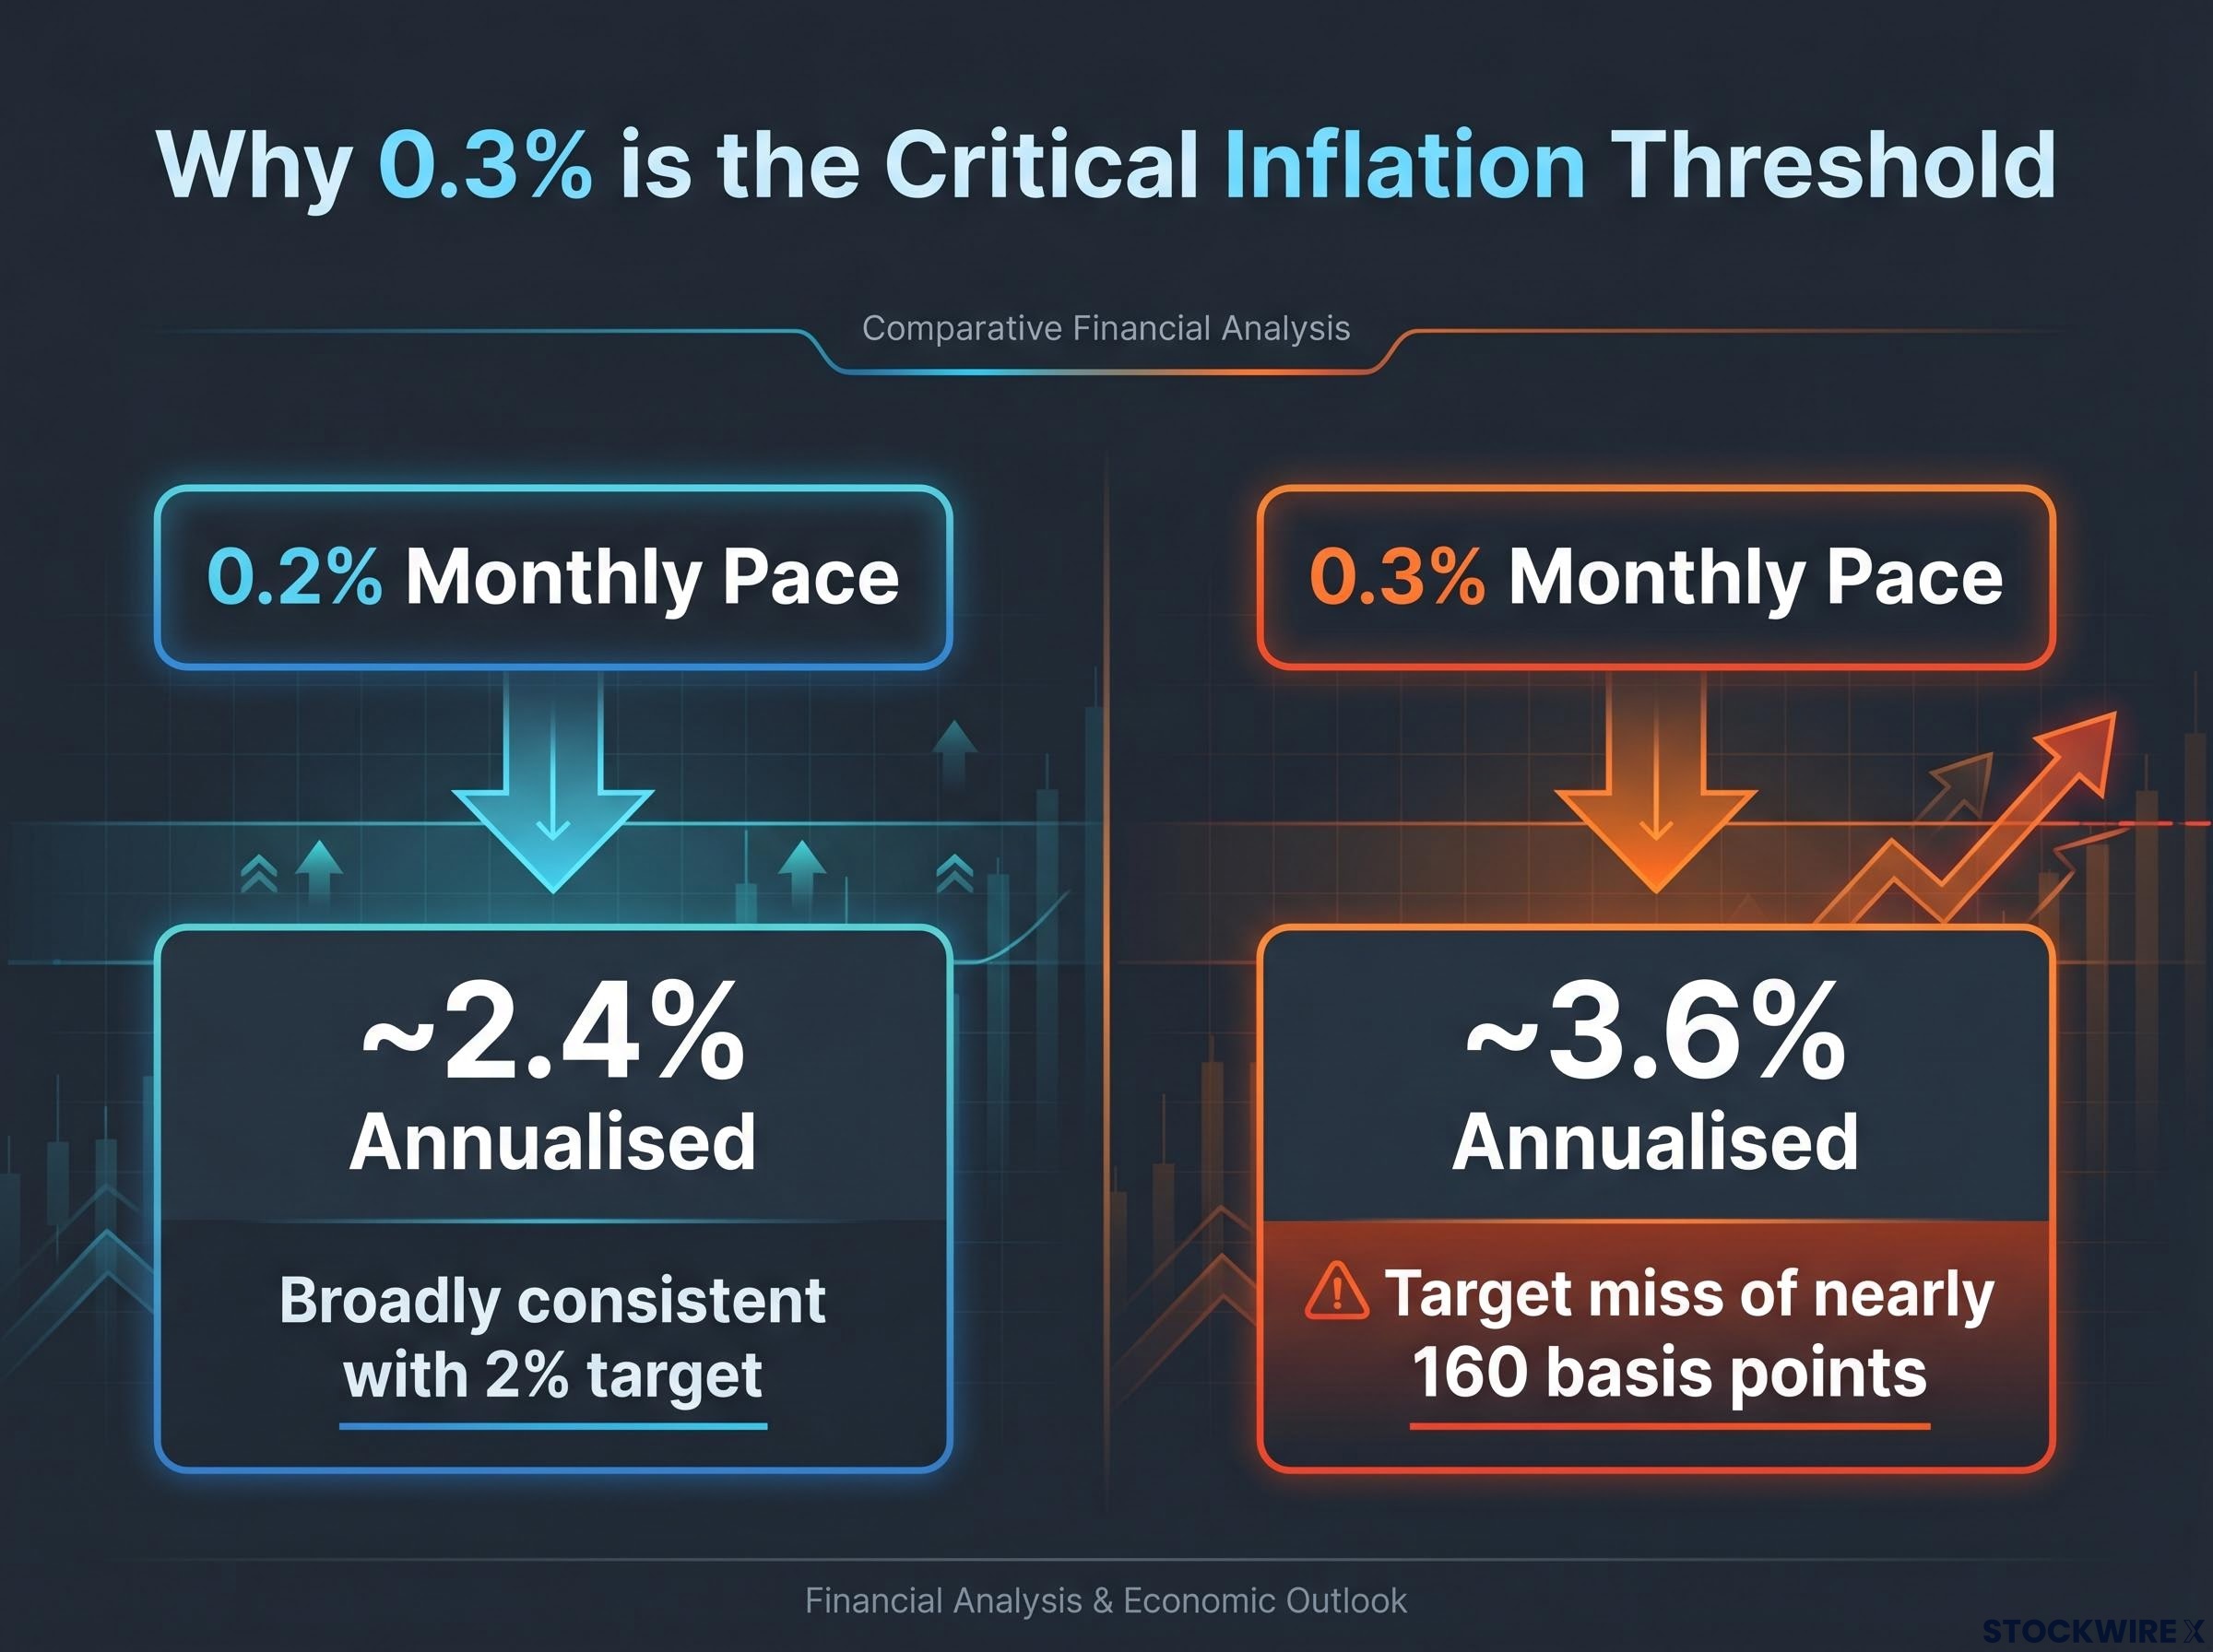
That arithmetic tells you precisely why 0.3% is not an arbitrary line. At that pace, the Fed faces a target miss of nearly 160 basis points on an annualised basis, a gap that makes a hold position politically and institutionally untenable.
Any single monthly reading above 0.3% would move markets on the day. Bond yields would spike, rate-sensitive equities would sell off, and Fed commentary would shift in tone. But a single print would not itself constitute Morgan Stanley’s hike trigger.
The bank’s threshold requires an ongoing pattern, not a one-off event. Geopolitical shocks, such as a renewed Middle East conflict driving oil sharply higher, could produce that sustained pattern through second-round effects: higher transport costs feeding into goods prices, higher energy bills feeding into services costs, and the entire core inflation basket drifting upward month after month. That is the scenario Gapen is watching for, and it is the scenario that would change everything.
The May 2026 core CPI at 0.2% month-over-month sits below the alarm threshold. For now, the signal is clear: disinflation remains on track.
The second condition is less likely under the base case but structurally important. According to Morgan Stanley, an unemployment rate dipping under 4.0% would indicate that the labour market is running too hot, prompting the bank to reassess its policy outlook.
The payroll maths show how far current momentum is from that line:
At 50,000-60,000 jobs per month, payroll growth is not on a trajectory to push unemployment below 4.0% through summer 2026.
The payroll maths tell you that the labour market would need to shift materially from its current trajectory to activate this trigger. That makes it the lower-probability risk of the two, but the one with the faster policy transmission timeline if it does materialise. A sudden hiring surge would feed directly into wage growth and consumer spending, creating the demand-side pressure that the Fed monitors most closely.
Monthly nonfarm payroll releases and the unemployment rate figure are two of the most market-moving data releases on the economic calendar. Knowing that 4.0% is the line for Fed policy reassessment gives you a clear frame for interpreting each jobs report through year-end.
The May 2026 jobs report delivered 172,000 nonfarm payrolls, nearly double the 85,000 consensus, yet the unemployment rate held at 4.3% and average hourly earnings rose just 0.3% month-over-month, a profile that showed labour market resilience without the wage acceleration that would threaten Morgan Stanley’s no-hike baseline.
The central scenario through year-end 2026 is rate stability, with risk skewed toward a longer hold rather than early cuts or surprise hikes. Morgan Stanley’s analysis translates broad “higher for longer” consensus into concrete, actionable monitoring criteria.
| Trigger | Threshold | Current status (late June 2026) |
|---|---|---|
| Core inflation | 0.3% month-over-month, sustained | 0.2% (May 2026), below threshold |
| Unemployment rate | Below 4.0% | Not below 4.0% |
Two data releases are the ones to watch each month:
Both triggers would need to be met in a sustained way, not on a single data release, giving markets time to adjust before any policy shift would be imminent. The fact that Morgan Stanley has defined these thresholds in concrete, measurable terms means you do not need to guess when the policy calculus changes. The data will announce it, and these are the two numbers that will do so first.
Rate expectations are the single most powerful input to asset valuations across equities, bonds, and real estate. A clear framework for when those expectations might shift is not an abstract exercise; it is the basis for positioning decisions made today.
Morgan Stanley’s verdict is concise: rates on hold through 2026, potential easing in the first half of 2027, no hike unless core inflation sustains at 0.3% month-over-month or unemployment drops below 4.0%.
Current data sits comfortably below both trigger levels. May 2026 core CPI printed at 0.2% month-over-month. Unemployment has not breached the 4.0% threshold. The conditions for a shift are defined and measurable, but they are not close to being met.
The immediate checkpoints against which this framework should be tested are:
The value of Morgan Stanley’s analysis is not just the baseline call. It is the translation of Fed policy uncertainty into two specific, measurable numbers that turn every monthly data release into a checkpoint you can evaluate with precision rather than anxiety.
Warsh’s forward guidance elimination makes the Fed’s communication posture considerably harder to read than under previous chairs; with no explicit rate path signalled in the statement, the analytical value of concrete threshold frameworks like Morgan Stanley’s becomes proportionally higher for investors trying to anticipate policy shifts.
This article is for informational purposes only and should not be considered financial advice. Investors should conduct their own research and consult with financial professionals before making investment decisions. These statements reflect Morgan Stanley’s current projections and are subject to change based on market developments and incoming economic data.
Morgan Stanley expects the Fed to hold rates steady through the full end of 2026, with the first potential easing not arriving until the first half of 2027. Chief U.S. Economist Michael Gapen published this call on 26 June 2026, the day after the FOMC meeting, and the bank's conviction has firmed since then rather than softened.
Morgan Stanley has set the trigger at sustained monthly core CPI or core PCE readings at or above 0.3% month-over-month. A single print above that level would move markets, but the bank's threshold requires a consecutive pattern, not a one-off reading, before the no-hike baseline would be reassessed.
A 0.3% monthly pace annualises to roughly 3.6%, a level at which the Fed cannot credibly argue inflation is returning to its 2% target and would face a gap of nearly 160 basis points against that goal. By contrast, the 0.2% monthly pace seen in May 2026 annualises to approximately 2.4%, consistent with a path back toward the Fed's target.
Morgan Stanley has identified an unemployment rate falling below 4.0% as the second trigger for reassessing its no-hike baseline. As of late June 2026, unemployment has not breached that level, and the current payroll pace of roughly 50,000-60,000 jobs per month is not on a trajectory to push it below that threshold through summer 2026.
Morgan Stanley puts Q4 2026 headline PCE at 3.2% and core PCE at 3.0%, figures the bank characterises as substantially lower than the FOMC median projection. The Fed's June 2026 dot plot revision to 3.8% for year-end implies at least one 25 basis point rate hike, and nine FOMC members' hike projections appear to have been drawn up before the U.S.-Iran agreement drove oil prices sharply lower.