The dollar slipped on Friday, and the headlines framed it as a retreat. Yet the US Dollar Index (DXY), which measures the greenback against six major currencies, sits around 102.02, just shy of its 2026 high of 102.54. The 10-year Treasury yield has eased only about 12 basis points from 5.35%, its highest level since April 2002. For anyone forming a USD outlook, the question is simple: is this a turn, or just a pause?
Three forces converged this week. Long-term yields backed away from their peak. Oil gave back its spike after President Donald Trump pledged not to attack Iran before the 3 November midterm elections. Traders also began squaring their books ahead of the September Consumer Price Index (CPI) release on Wednesday, 14 October.
Reading the pullback correctly matters. Treat a pause as a reversal and you risk unwinding dollar exposure through international equities, imports or FX positions at the wrong moment.
Here is how to judge for yourself whether the softness is tactical or structural, and what Wednesday’s inflation print could change.
Why did the dollar slip while it still sits near a 17-month high?
Friday’s move was small. According to FXStreet, the DXY fell roughly 0.1% in the Asian session to about 102.02, after heavy selling late Thursday when the index failed to push past this year’s peak.
Widen the lens and the dip shrinks further. Earlier in the month, The Straits Times reported the index at a 17-month high and on track for a 1% weekly gain. The path through the past week looks more like a sideways grind than a slide:
- 2 October: 102.08 (The Straits Times)
- 7 October: 101.94, after a 0.27% slide (Reuters)
- 8 October: 102.23 in early Asian trade (Reuters)
- 9 October: about 102.02 (FXStreet)
The Reuters and FXStreet figures reflect different dates and times, not conflicting data. Both leave the 102.54 high intact as resistance.
The index itself follows ICE’s USDX methodology, which fixes the basket at six currencies with a heavy euro weighting, so moves in the DXY often reflect European conditions as much as US strength.
The breadth of Friday’s softness was wide but shallow. The greenback lost most ground against the commodity-linked Australian and New Zealand dollars and edged higher against the yen.
| Currency | Approximate change vs USD (Friday) |
|---|---|
| Euro (EUR) | -0.12% |
| Pound (GBP) | -0.08% |
| Yen (JPY) | +0.08% |
| Canadian dollar (CAD) | -0.08% |
| Australian dollar (AUD) | -0.24% |
| New Zealand dollar (NZD) | -0.24% |
| Swiss franc (CHF) | -0.21% |
The cleanest link to the dollar’s softness is the bond market. The 10-year yield eased from 5.35% to about 5.23%, trimming the return advantage that has drawn capital into US assets.
A 0.1% dip with the index within about 0.5% of its yearly high tells you this is a pause inside a yield-driven trend. It is not yet evidence that the trend has broken.
When big ASX news breaks, our subscribers know first
How do Iran headlines and oil feed into yields and the dollar?
If yields explain the dollar’s softness, the next question is what moved yields. The answer runs through the oil market, and the sequence unfolded over roughly 48 hours:
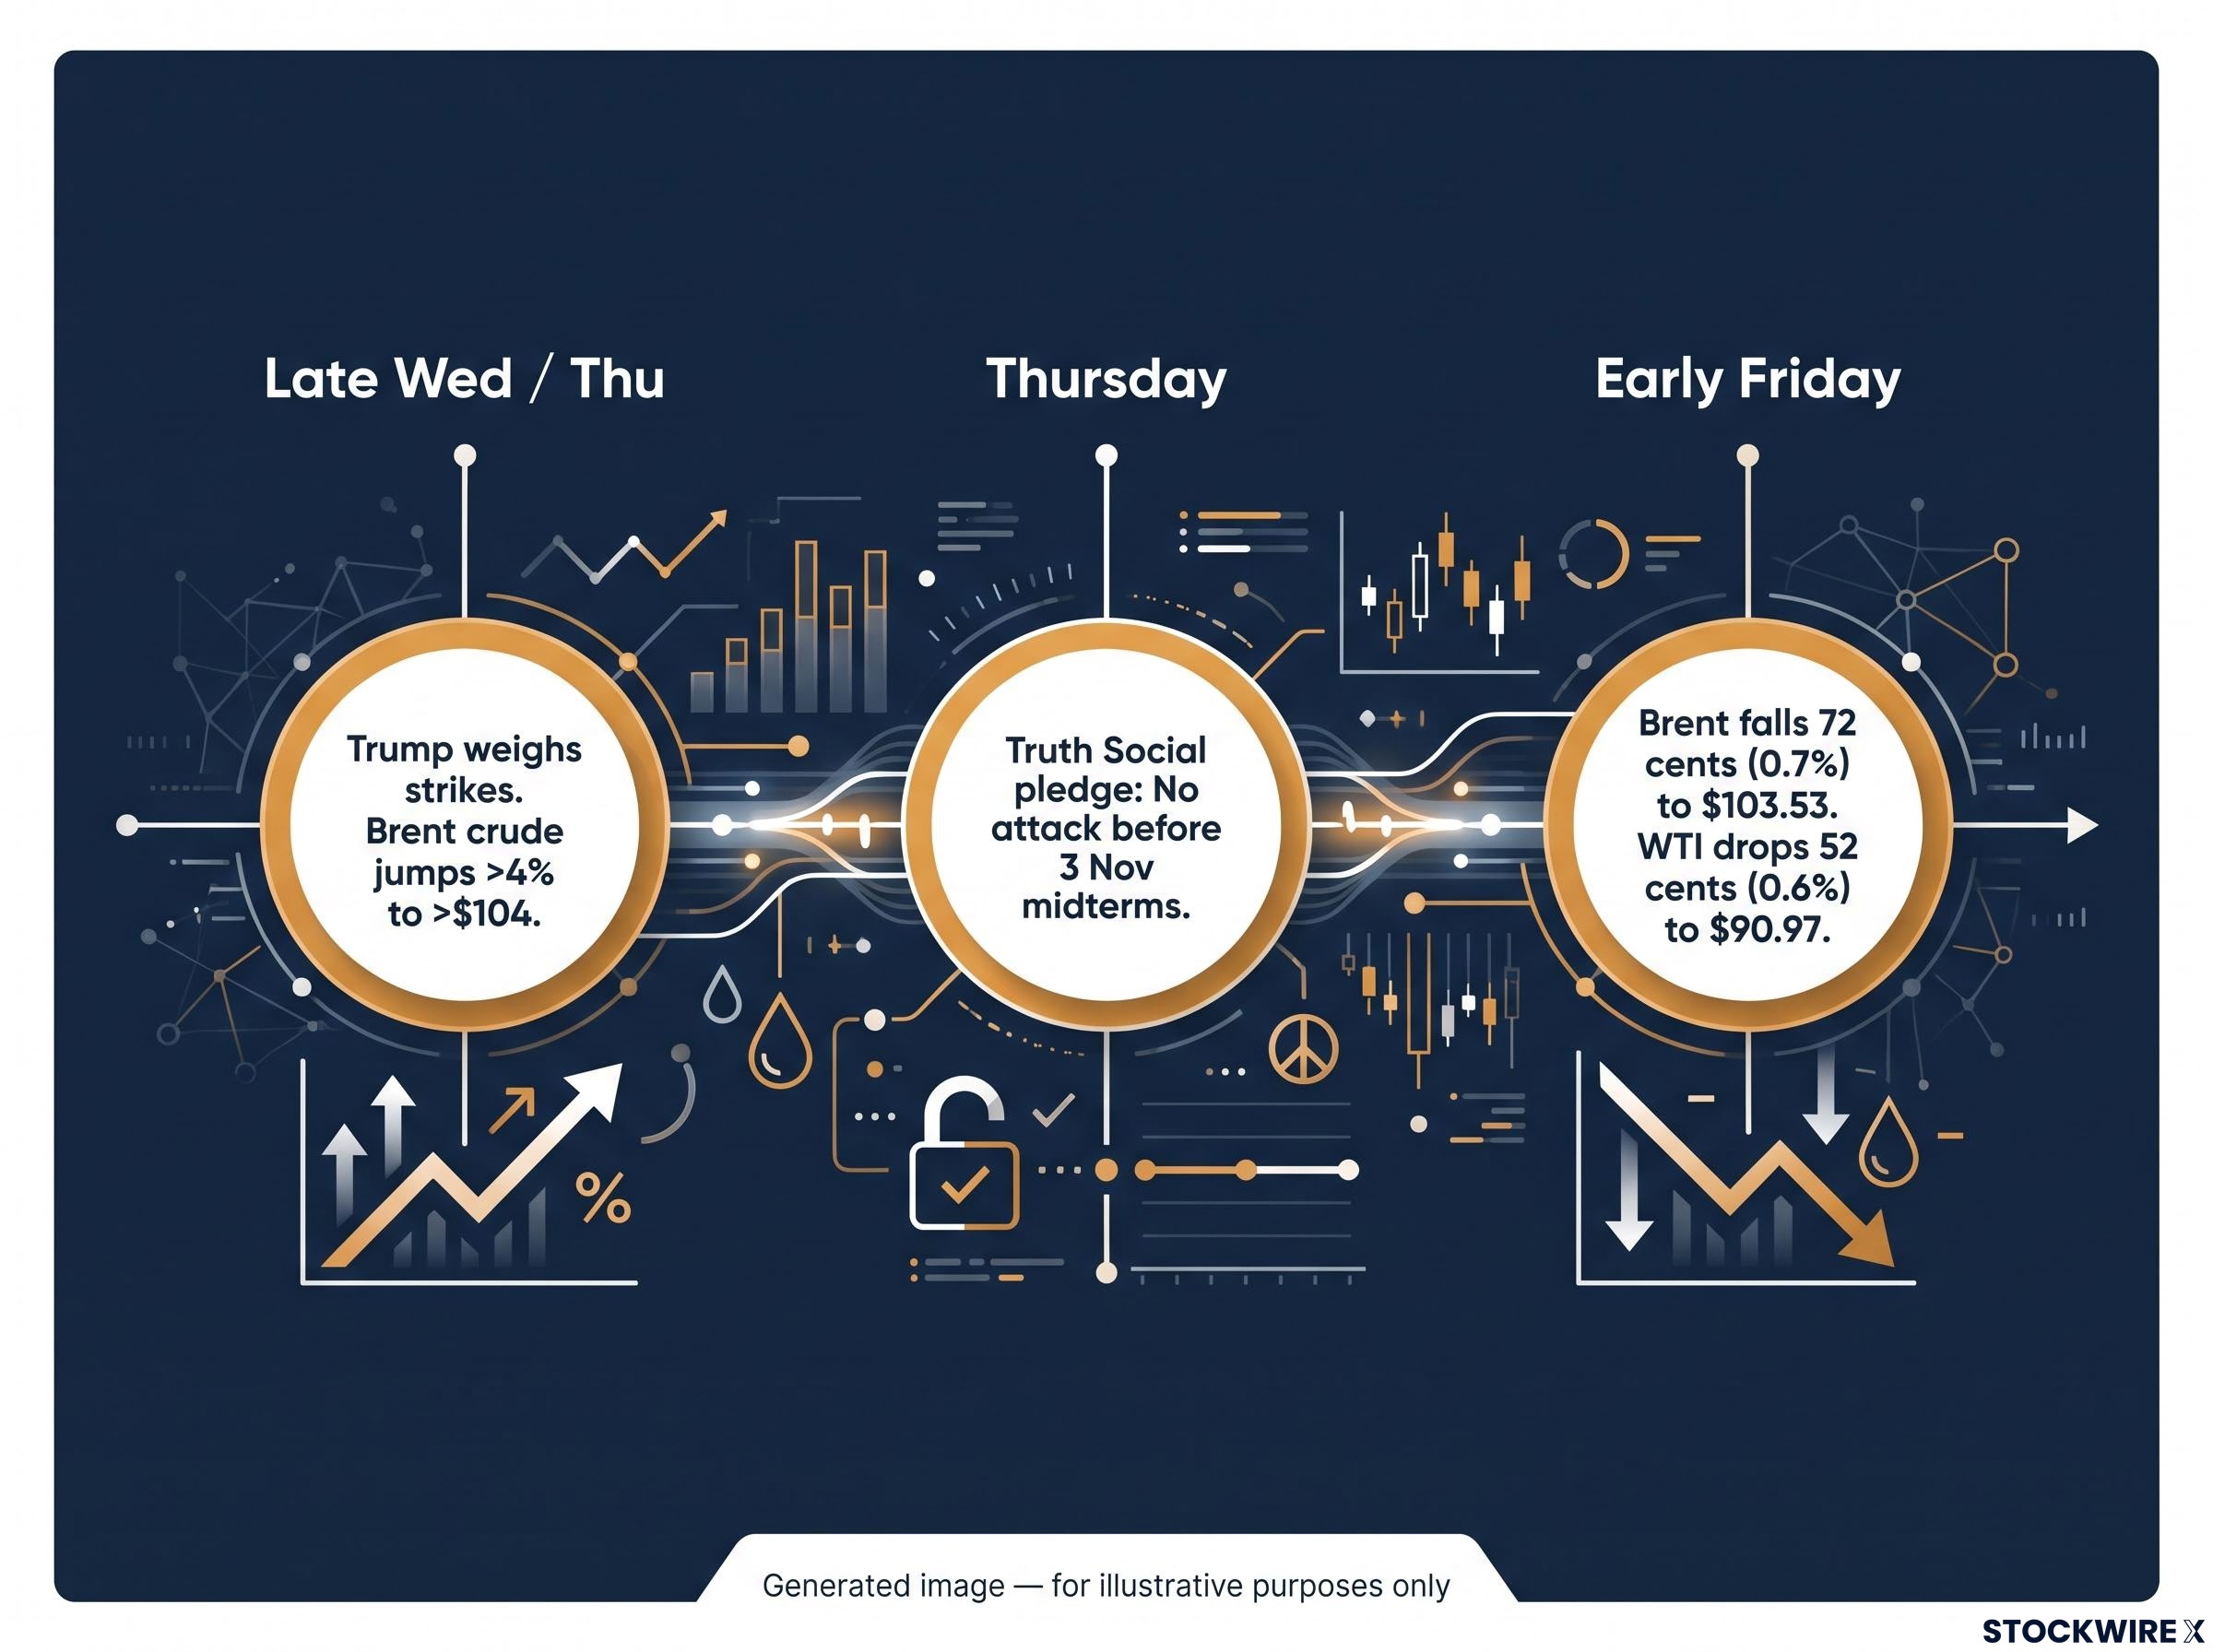
- Late Wednesday into Thursday: Trump told reporters his administration was weighing renewed strikes on Tehran before the election. According to CNBC, Brent crude jumped more than 4% to above $104 a barrel.
- Thursday: Trump reversed course on Truth Social, citing “productive discussions” with Iran and ruling out an attack before the midterms.
- Early Friday: Brent fell 72 cents (0.7%) to $103.53 by 0220 GMT, while West Texas Intermediate (WTI) dropped 52 cents (0.6%) to $90.97.
Trump’s Truth Social pledge “We will not be attacking Iran at any time prior to the midterm elections to be held in the United States on November 3rd.”
The backdrop matters. The pledge arrived amid talks to end the war with Iran and a continuing US blockade of Iranian ports, which has kept fuel prices elevated in recent months. Reuters also tied the dollar’s recent strength to a “global bond rout”, with the index easing as European yields retreated from their highs.
Two channels, two directions
The first channel runs through inflation. Lower oil cools near-term inflation expectations, which reduces the urgency for further Federal Reserve rate hikes. That weighs on long-term yields and, in turn, on the dollar. The Brent spike above $104 had worked the other way, reinforcing hike expectations.
The second channel is safe-haven demand. When the perceived risk of a US strike falls, the risk premium in oil and the dollar fades, inviting profit-taking on long-dollar positions sitting near multi-month highs.
A thin geopolitical risk premium helps explain why Brent can jump on a headline and surrender the gains within hours, since lasting moves require a real, prolonged loss of physical supply rather than rhetoric alone.
Both channels pushed the same way on Friday. They will not always. The pledge covers only the period before 3 November, so the oil risk is two-way rather than resolved. Because one headline can swing Brent by several dollars and shift rate expectations, you should treat Iran news as a live input to dollar direction, not background noise.
What does Wednesday’s CPI need to show to keep the dollar bid?
Oil sets the mood; inflation data sets the price. The September CPI report from the Bureau of Labor Statistics lands on Wednesday, 14 October 2026, at 8:30 a.m. ET, and it is the main scheduled driver for the dollar’s next move.
The market has already made a bet. CME FedWatch, which converts futures prices into implied odds of Fed decisions, shows at least one rate hike priced in for the rest of 2026. That assumption is doing much of the work in keeping yields and the dollar elevated.
It is also fragile. An earlier core CPI print, which strips out volatile food and energy prices, topped the median estimate of +0.2% month on month, and Bloomberg reported it bolstered the case for a hike. One number repriced the Fed within a session.
| Scenario | Likely effect on Fed pricing | Likely effect on yields | Likely effect on USD |
|---|---|---|---|
| Hot CPI | Hike odds firm or rise | Push higher | Supportive, possible test of highs |
| In-line CPI | Largely unchanged | Limited reaction | Little decisive movement |
| Soft CPI | Hike case weakens | Pull back further | Invites more profit-taking |
Since a hike is already in the price, an in-line print may change little. Only a clear surprise in either direction is likely to move the dollar decisively.
Because a hike is already priced in, the CPI surprise framework matters more than the headline number: futures-implied odds cap the upside on a hot print and amplify the reaction to a soft one.
The data gap to flag
The research behind this analysis could not locate a published consensus for September CPI, nor specific FedWatch probabilities. Rather than guess, check the consensus yourself before the release; the surprise relative to that number is what drives the reaction.
How do Fed policy tools move the dollar, and what does the DXY chart say now?
To see why CPI carries so much weight, start with the mechanism. No currency changes hands more often than the dollar, which sits on one side of over 88% of global FX trades, roughly $6.6 trillion daily based on 2022 figures. Its value responds most directly to Fed policy.
The dollar’s global dominance is why Fed policy shifts travel so quickly through every asset class, since the currency’s reserve and trading roles keep demand for dollar assets structurally deep even when the index pauses.
The Fed aims for price stability, defined as 2% inflation, and full employment, mainly by setting interest rates. Higher rates tend to attract capital and support the dollar; lower rates tend to weigh on it. The Fed’s main tools affect the currency in predictable directions:
- Rate hikes: usually USD-positive, as returns on dollar assets rise.
- Rate cuts: usually USD-negative, as returns fall.
- Quantitative easing (QE): the Fed creates money to buy government bonds. It usually weakens the dollar by expanding supply.
- Quantitative tightening (QT): the Fed stops buying bonds and stops reinvesting maturing ones. It is usually supportive of the dollar.
CPI matters because it shapes which of these levers markets expect the Fed to pull next.
Reading the DXY setup
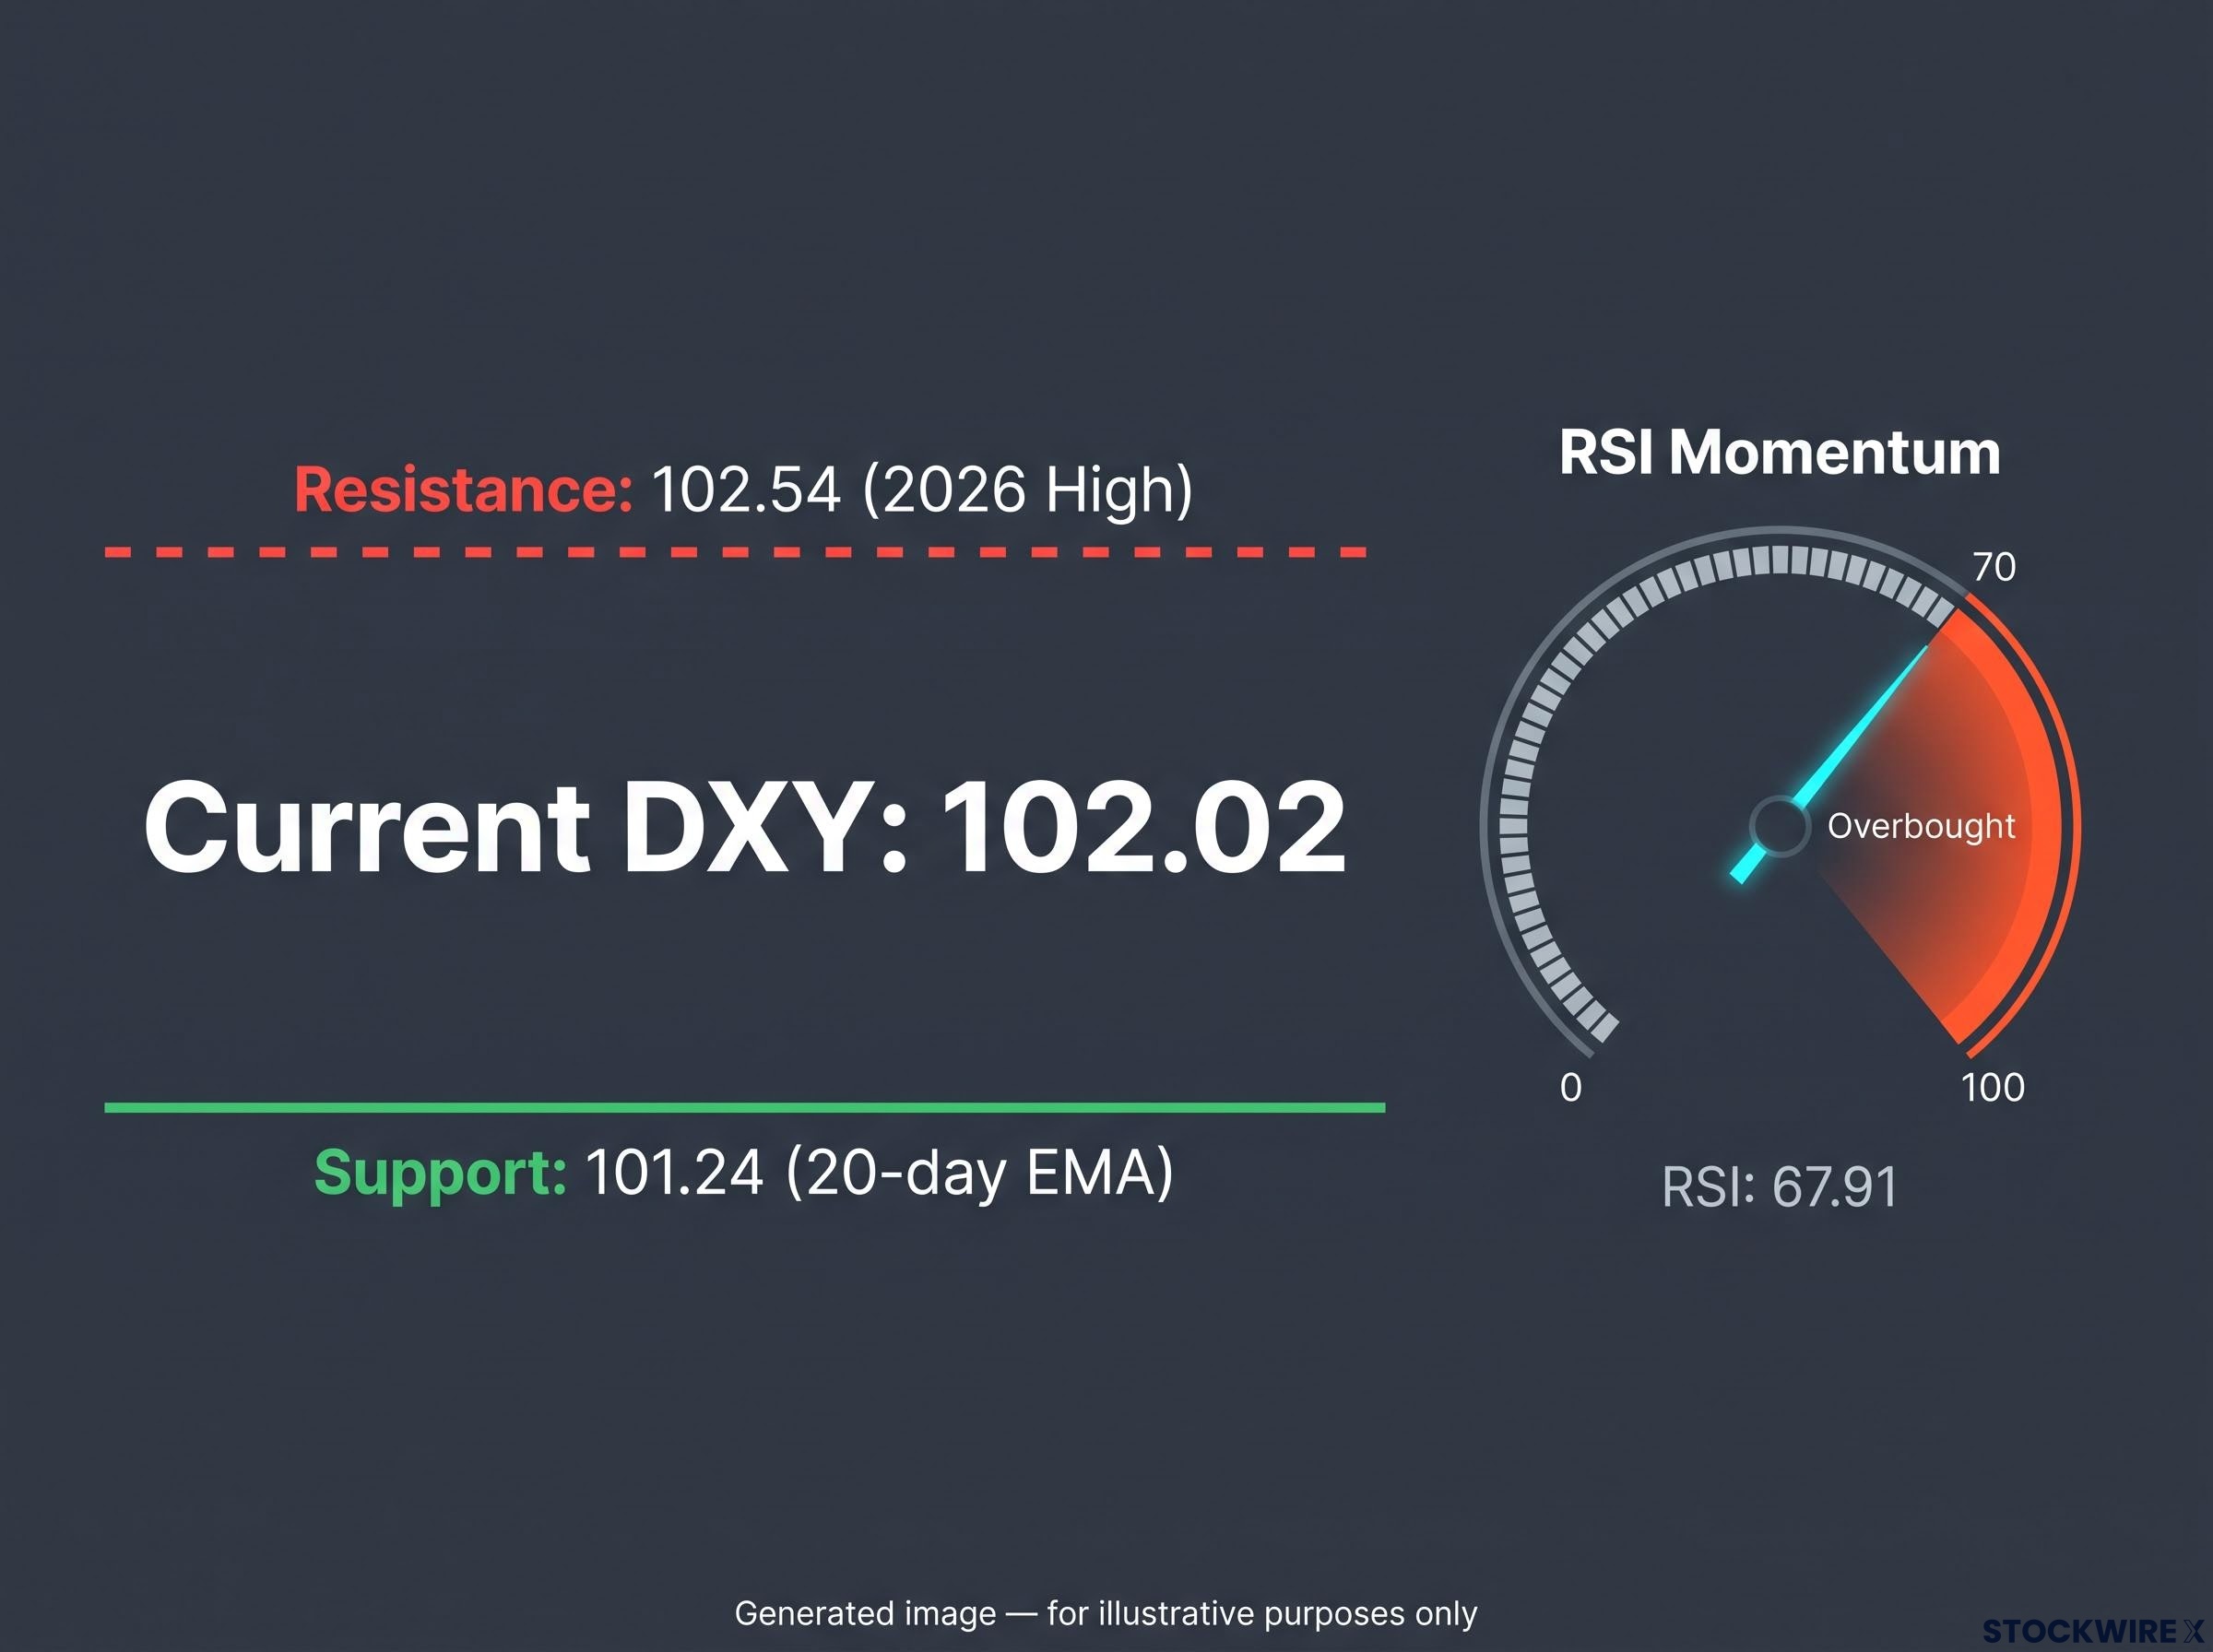
The chart shows those mechanics at work. The index sits around 102.03, holding above its 20-day exponential moving average (EMA), a trend line that weights recent prices more heavily. The Relative Strength Index (RSI), a momentum gauge scaled from 0 to 100 where readings above 70 signal overbought conditions, reads 67.91.
- Support: 20-day EMA at 101.24.
- Resistance: 2026 high at 102.54.
- Momentum: RSI at 67.91, just below overbought, so gains may slow or pause.
The trigger to watch If the index closes clearly under the 20-day EMA, the bullish case loses its footing and a larger retreat towards earlier areas of price clustering becomes more likely.
Put the pieces together. With rates driving the dollar and momentum already stretched, a softer CPI could trigger a slide toward 101.24, while a hot print could push a fresh test of 102.54.
What the pullback changes, and what it does not
The evidence points to tactical consolidation. Yields easing, oil risk fading after Trump’s pledge and pre-CPI positioning explain Friday’s dip without breaking the yield-driven support that has held the DXY near multi-month highs.
The counter-case deserves weight. Some traders see a stretched, long-dollar market vulnerable to profit-taking. Against that, European weakness and elevated global yields still lend the currency cyclical support. Four variables will decide which side wins:
- The September CPI print relative to consensus on 14 October.
- Fed rhetoric versus the at least one hike already priced in.
- Iran-related energy risk, particularly after 3 November.
- The 101.24 EMA support and 102.54 resistance, with the 10-year near 5.23%.
Your read over the next week should hinge less on Friday’s dip and more on whether Wednesday’s CPI confirms or challenges hike pricing.
Past performance does not guarantee future results. Financial projections are subject to market conditions and various risk factors. These statements are speculative and subject to change based on market developments.
This article is for informational purposes only and should not be considered financial advice. Investors should conduct their own research and consult with financial professionals before making investment decisions.
—