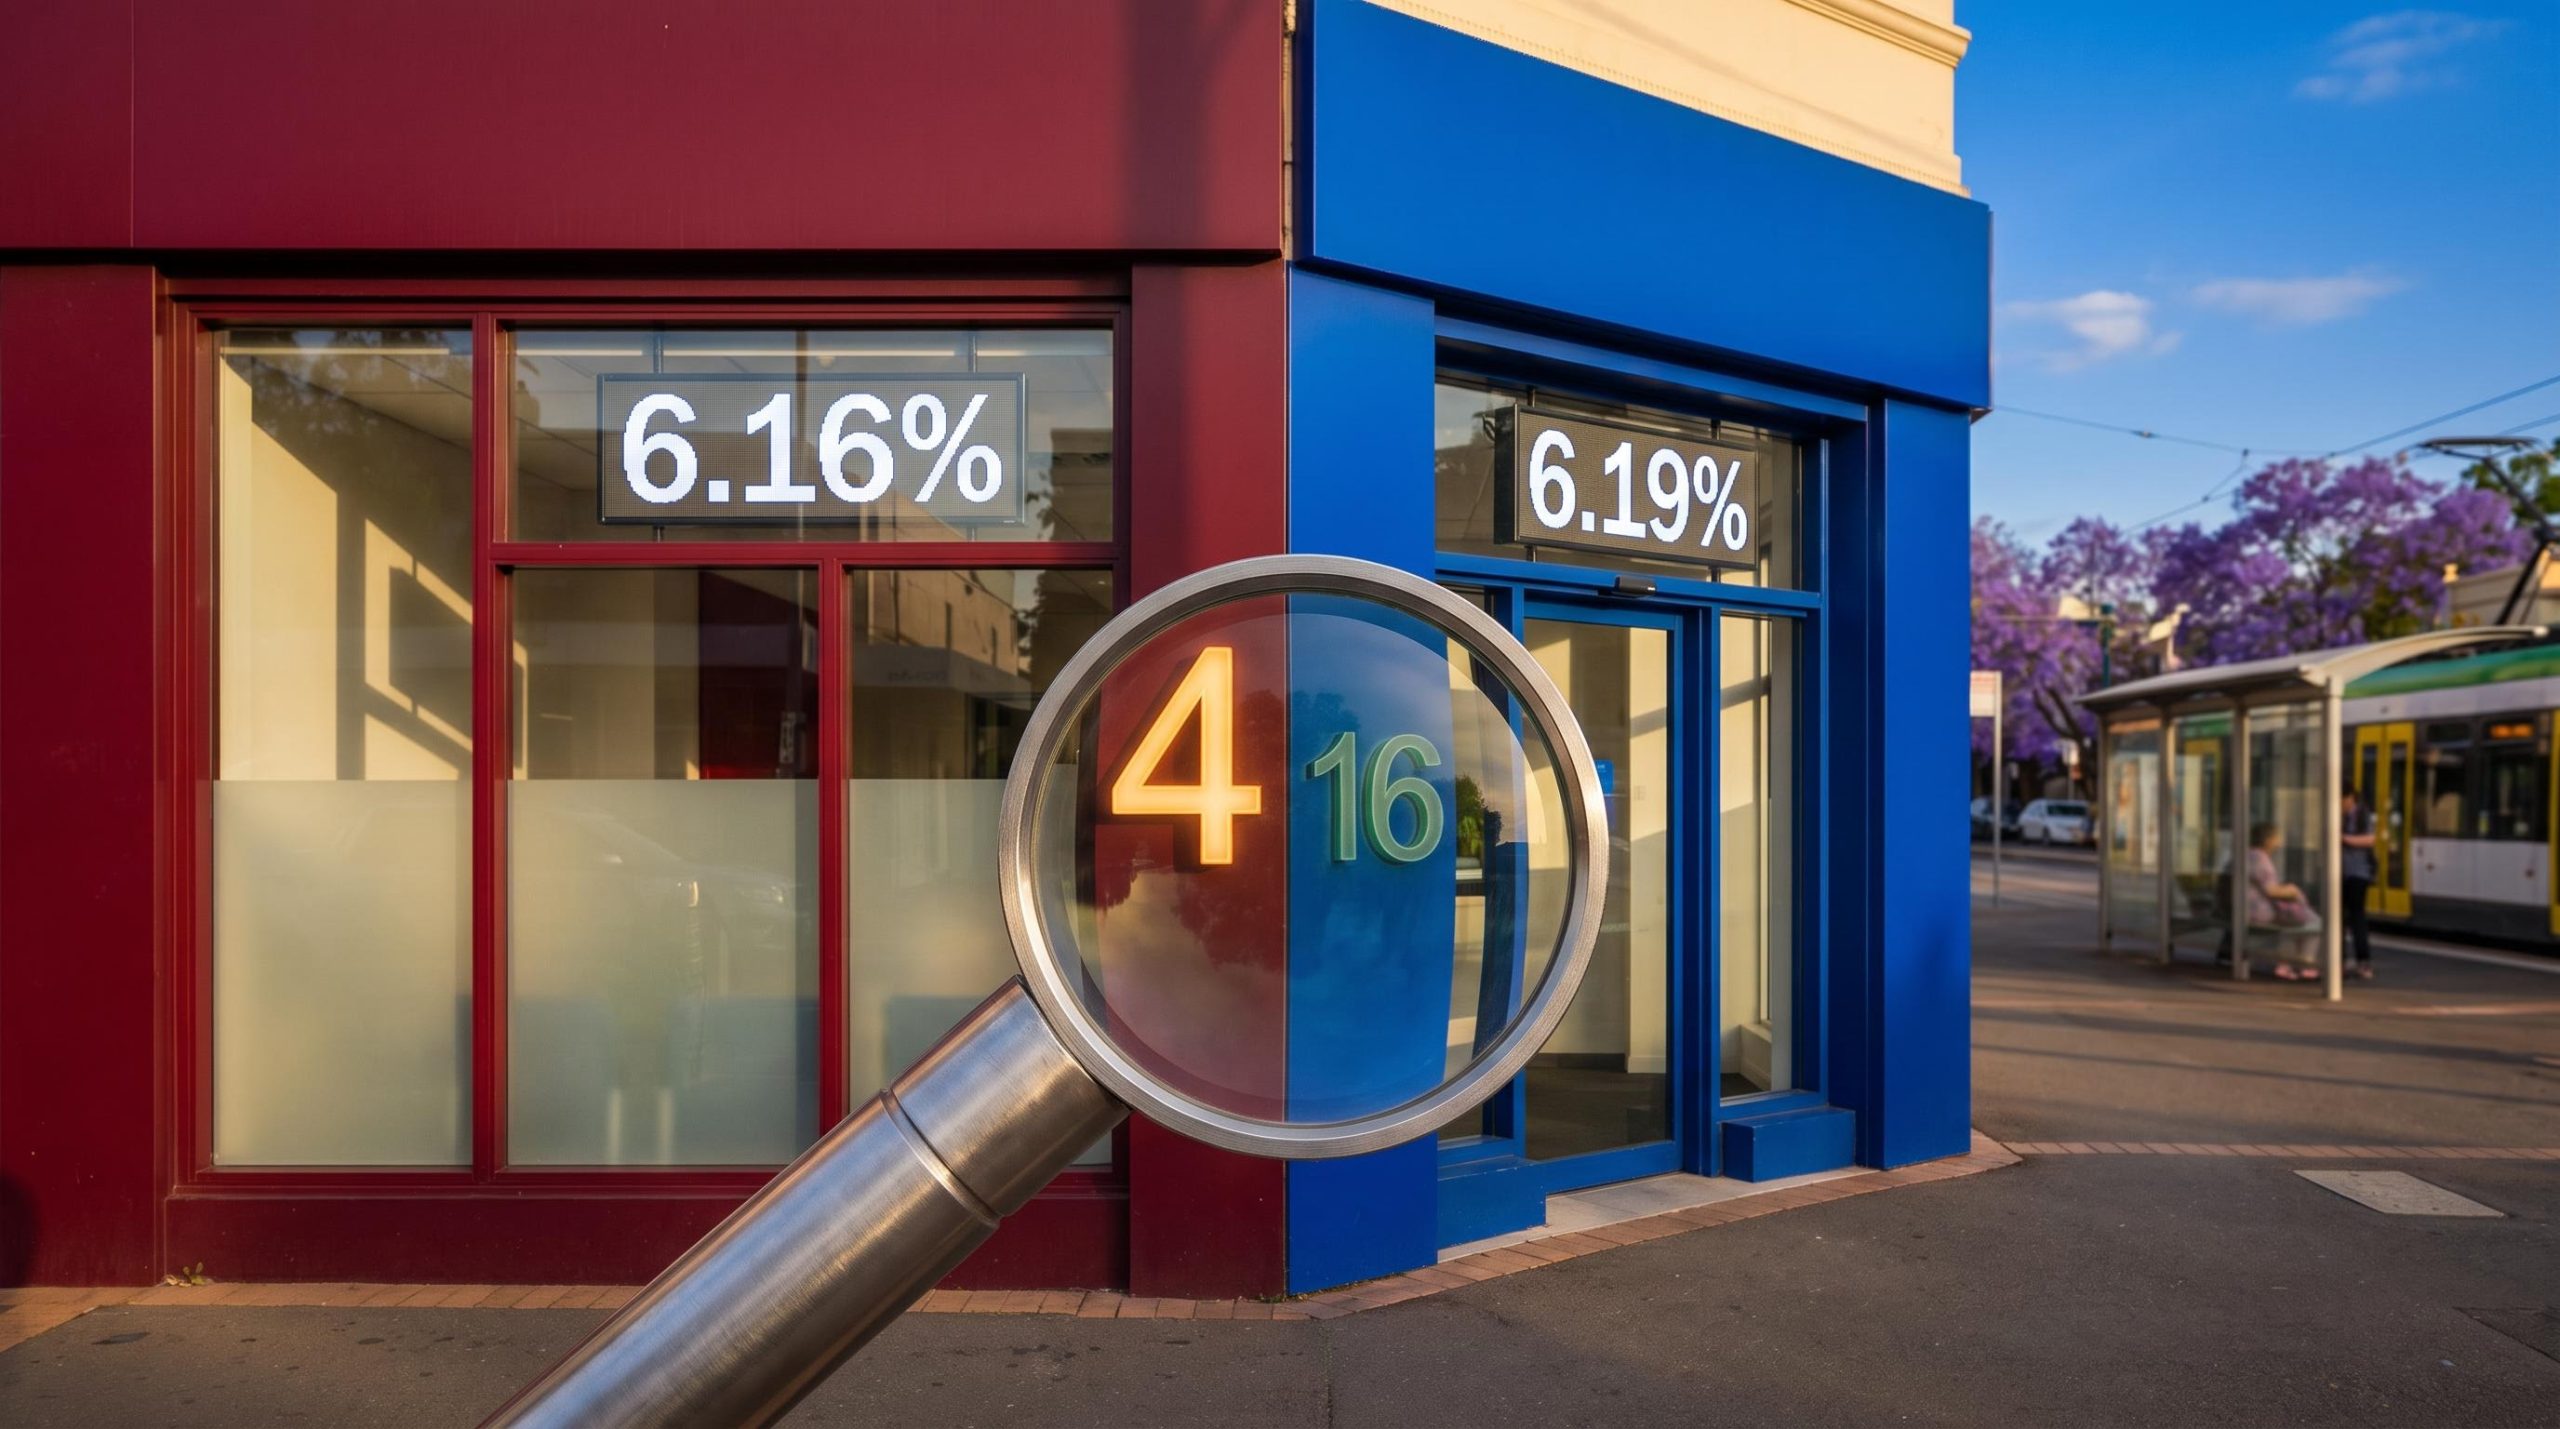
Two regional banks pay almost the same fully franked dividend. Bendigo and Adelaide Bank yields 6.16% and Bank of Queensland yields 6.19%. Yet the market prices one at about 16 times earnings and the other at about 44 times, which is why Bendigo Bank vs BOQ is a more interesting comparison than the yields suggest.
Income investors comparing regional lenders with the majors often screen on headline yield alone. That works when the dividends behind the yield are equally secure. Here, they may not be.
The timing matters. BOQ reports full-year results around 14-15 October 2026, days after the market data used here, which is drawn from early October 2026.
This piece gives you a way to test dividend sustainability beyond yield, and a view on which bank suits which kind of income investor.
Same yield, very different price tags: what the headline numbers hide
On yield, the two banks look like twins. Both pay fully franked dividends. Both yield a little above 6%. A quick screen would treat them as interchangeable.
The rest of the snapshot tells a different story.
| Metric | Bendigo and Adelaide Bank (BEN) | Bank of Queensland (BOQ) |
|---|---|---|
| Dividend yield (fully franked) | 6.16% | 6.19% |
| Price-to-earnings (P/E) ratio | 16.32 | 43.65 |
| Market capitalisation | $5.96bn | $4.29bn |
| Earnings per share (EPS) | $0.627 | $0.148 |
| Dividend per share | $0.66 | $0.40 |
| Year-to-date return | About 3.23% | About 4.29% |
| Close on 6 October 2026 | $10.24 | $6.51 |
A P/E ratio compares a share price with the profit each share earns. On these figures, BEN earns roughly four times as much per share as BOQ and pays out about 26 cents more per share in dividends, yet it trades on a fraction of BOQ’s multiple.
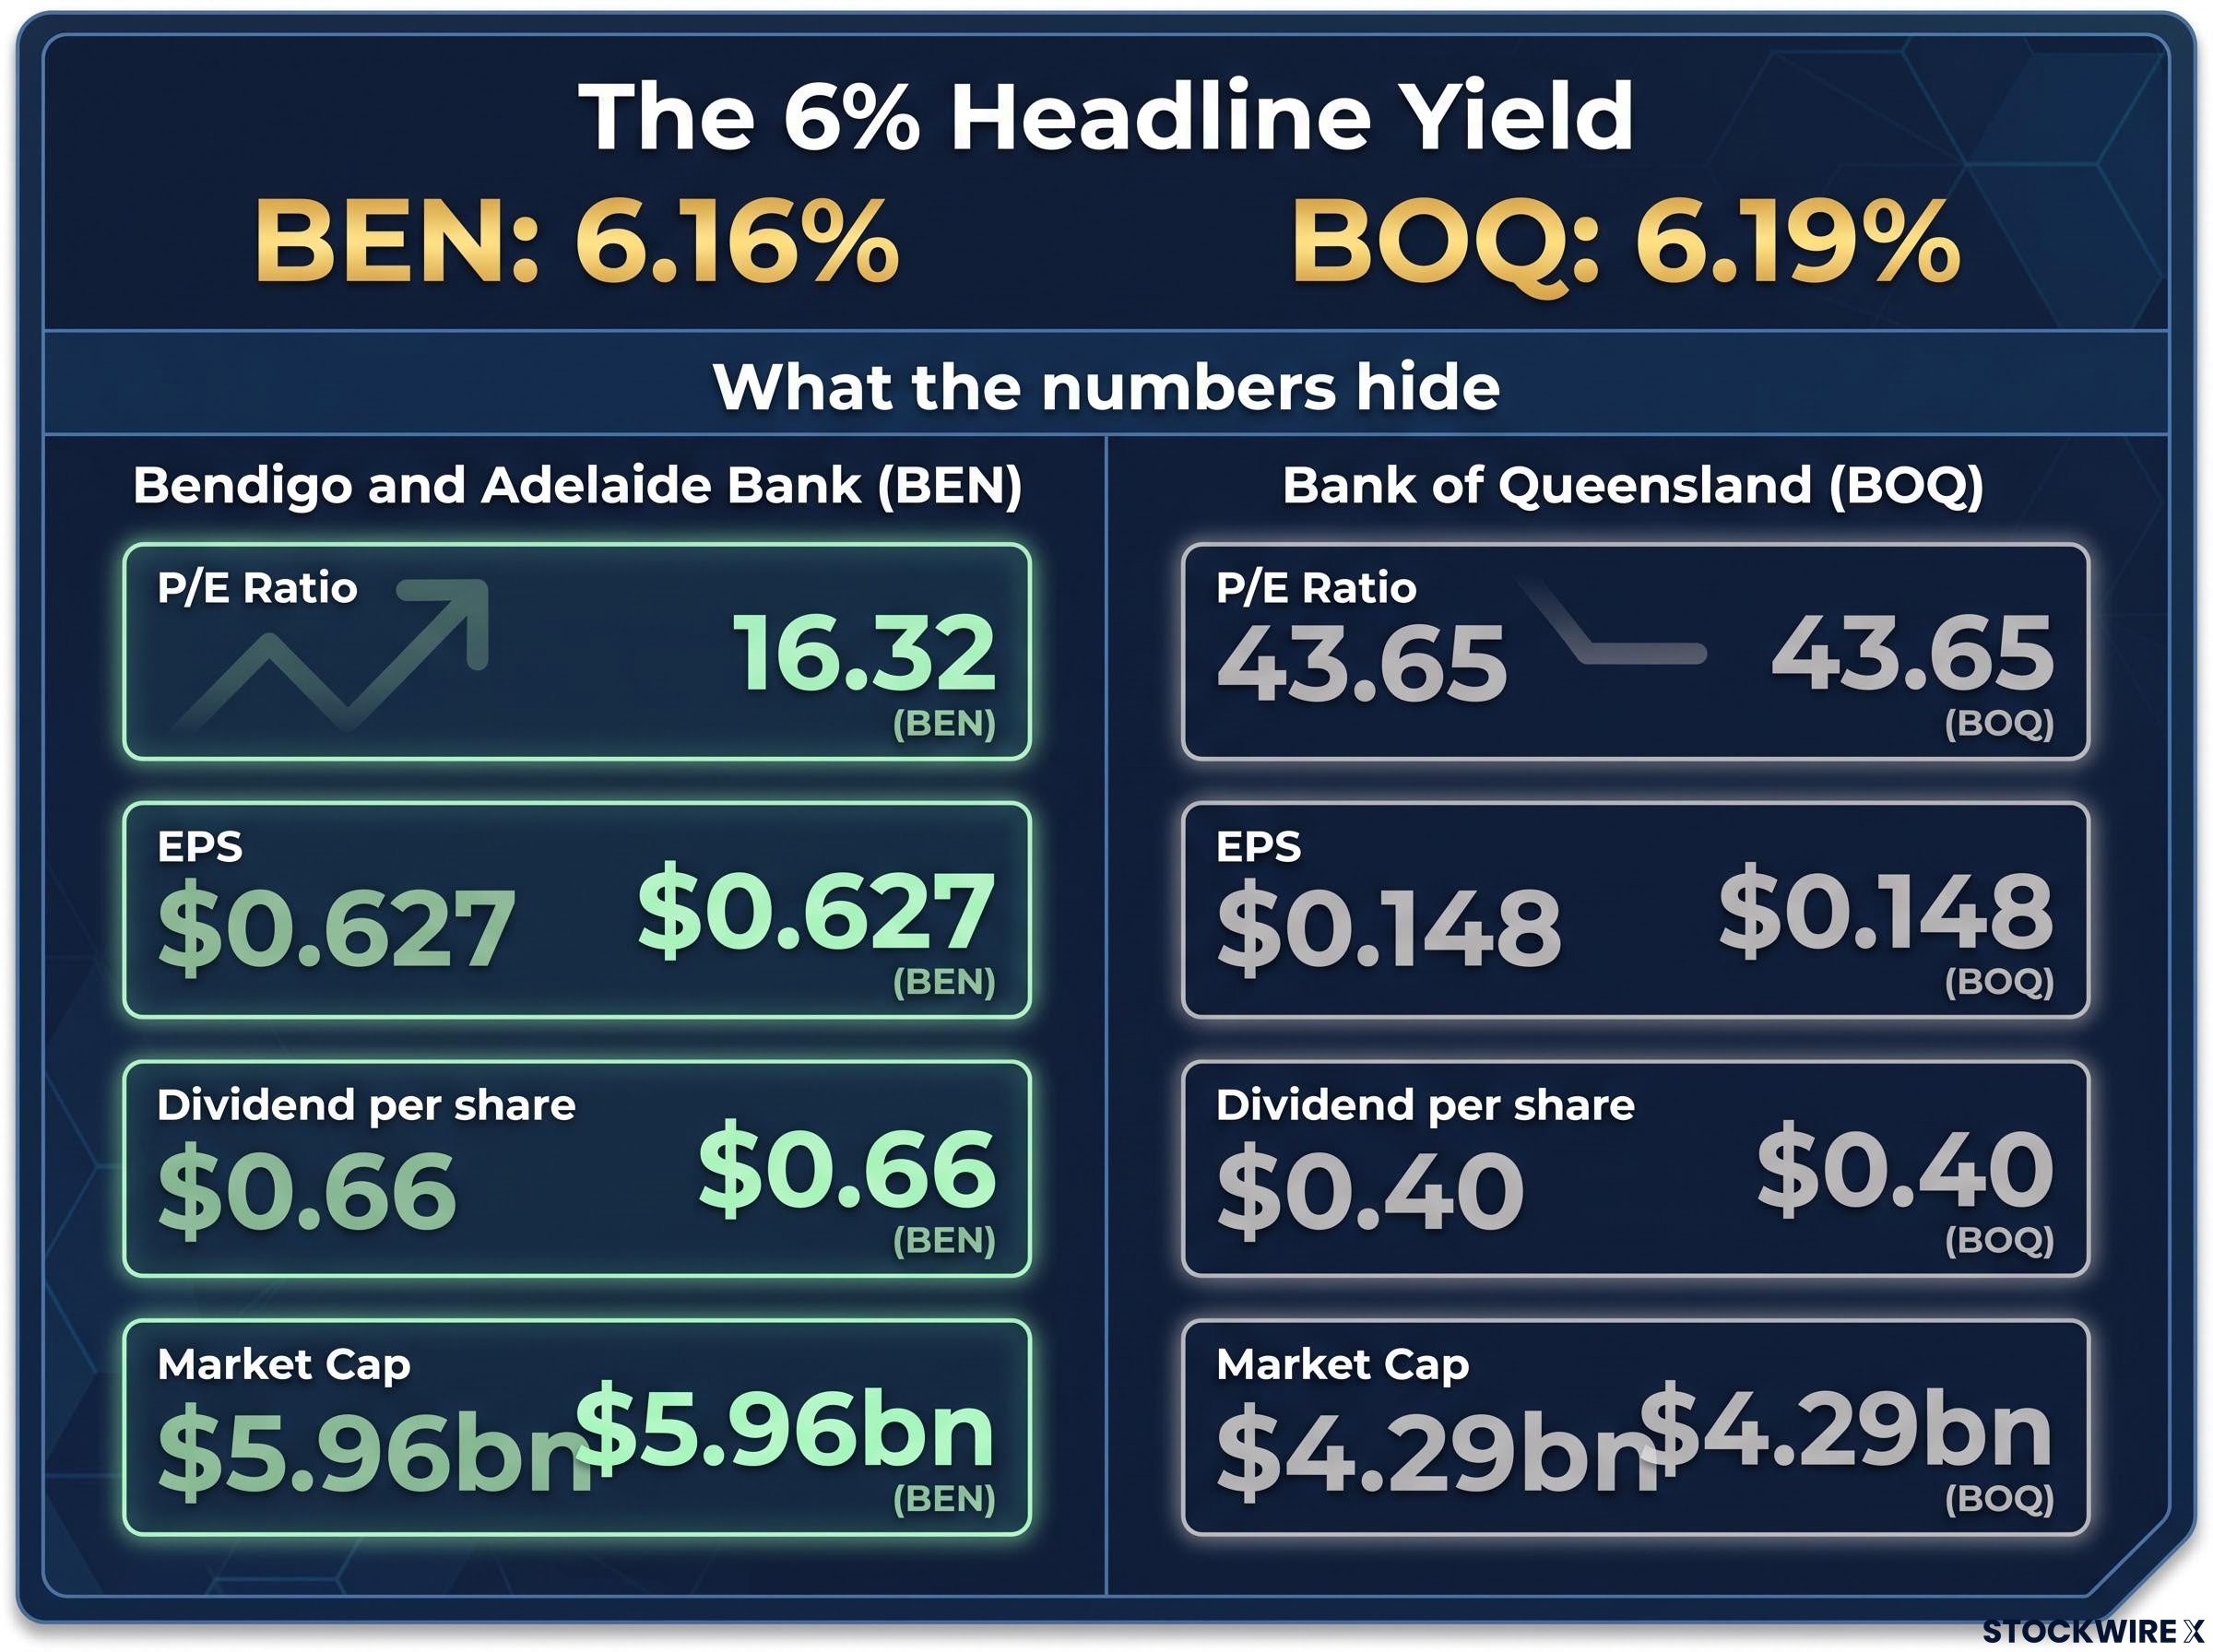
The yield match falls apart once you look at what produces it. Both yields price similar income, but the earnings behind that income differ sharply, so yield alone cannot tell you which dividend is safer.
Recent performance does not settle it either. BOQ’s year-to-date return is about one percentage point higher, a small gap that says little about value.
A few data caveats apply:
- Later research puts BOQ at about $6.38-$6.40 on 8-9 October 2026, with a market cap near $4.2bn.
- The 66 cents BEN dividend figure from one data provider differs from the 63 cents BEN declared for FY26, likely reflecting a different trailing period.
- BOQ’s P/E appears as about 42.5x in later research rather than 43.65x.
When big ASX news breaks, our subscribers know first
How to judge dividend sustainability beyond yield
If yield cannot separate these two, what can? A short set of checks, applied in order, will work on any regional bank.
Start with the building blocks. EPS is the profit attributable to each share. Dividend per share is what the bank actually pays you. The payout ratio is dividends divided by earnings, and it shows how much of the profit goes out the door.
Banks report two kinds of earnings. Statutory earnings include one-off items such as asset write-downs, while cash earnings strip many of those out to show ongoing profit. BEN paid 63 cents against cash EPS of 93.2 cents, a payout of about 67.6%. BOQ targets a payout of 60-75% of cash earnings excluding notable items, with ordinary dividends running at about 40 cents.
BOQ’s trailing P/E of about 42-43x is the live example of distortion. It rests on statutory EPS of about $0.15, dragged down by notable items such as technology and asset review charges. You should read a high P/E on a bank with caution, not as a growth signal, until you know whether it reflects depressed statutory earnings or genuinely expensive pricing.
Watch the denominator A high yield can reflect a falling share price or a payout the bank cannot keep up. It is a starting question, not an answer.
Five checks to run on any regional bank:
- Payout ratio on cash earnings: below about 70% leaves room to absorb a weaker year.
- Capital buffer: the Common Equity Tier 1 (CET1) ratio measures a bank’s highest-quality capital against its risk-weighted loans. Check it sits above the bank’s own target.
- Margin trend: net interest margin (NIM) is the gap between what a bank earns on loans and pays on funding. Rising is better than falling.
- Cost growth: expenses rising faster than income will squeeze future dividends.
- Franking value to you: fully franked dividends carry tax credits worth more to Australian resident investors than to non-residents.
Why regional banks trade at a discount to the majors
Regionals rely more on term deposits and wholesale funding, which costs more than the large transaction-account bases the majors enjoy. They also spread technology, compliance and cyber spending across far fewer customers, and they compete against majors that can use pricing power on mortgages and small business loans.
BEN’s FY26 shows the tension: margins improved, but costs rose alongside them.
Regional lenders carry structurally weaker NIM, ROE and CET1 readings than the majors because scale, cheaper deposit funding and pricing power compound in the larger banks’ favour.
The case for Bendigo: earnings, margins and capital
The BEN case starts with the profit line. FY26 results, released on 24 August 2026, show a dividend comfortably covered by cash earnings:
- Statutory net profit after tax (NPAT) of $375.1 million, a rebound from a prior-year loss
- Cash earnings of $530.2 million, up 3.0%
- Cash EPS of 93.2 cents, up 2.4%
- NIM of 1.95%, up 7 basis points, with the second half at 1.98%
- Final dividend of 33 cents, taking the total to 63 cents, fully franked
- Cash return on equity (ROE) of 8.01%
- CET1 of 11.34% and a liquidity coverage ratio of 140.2%
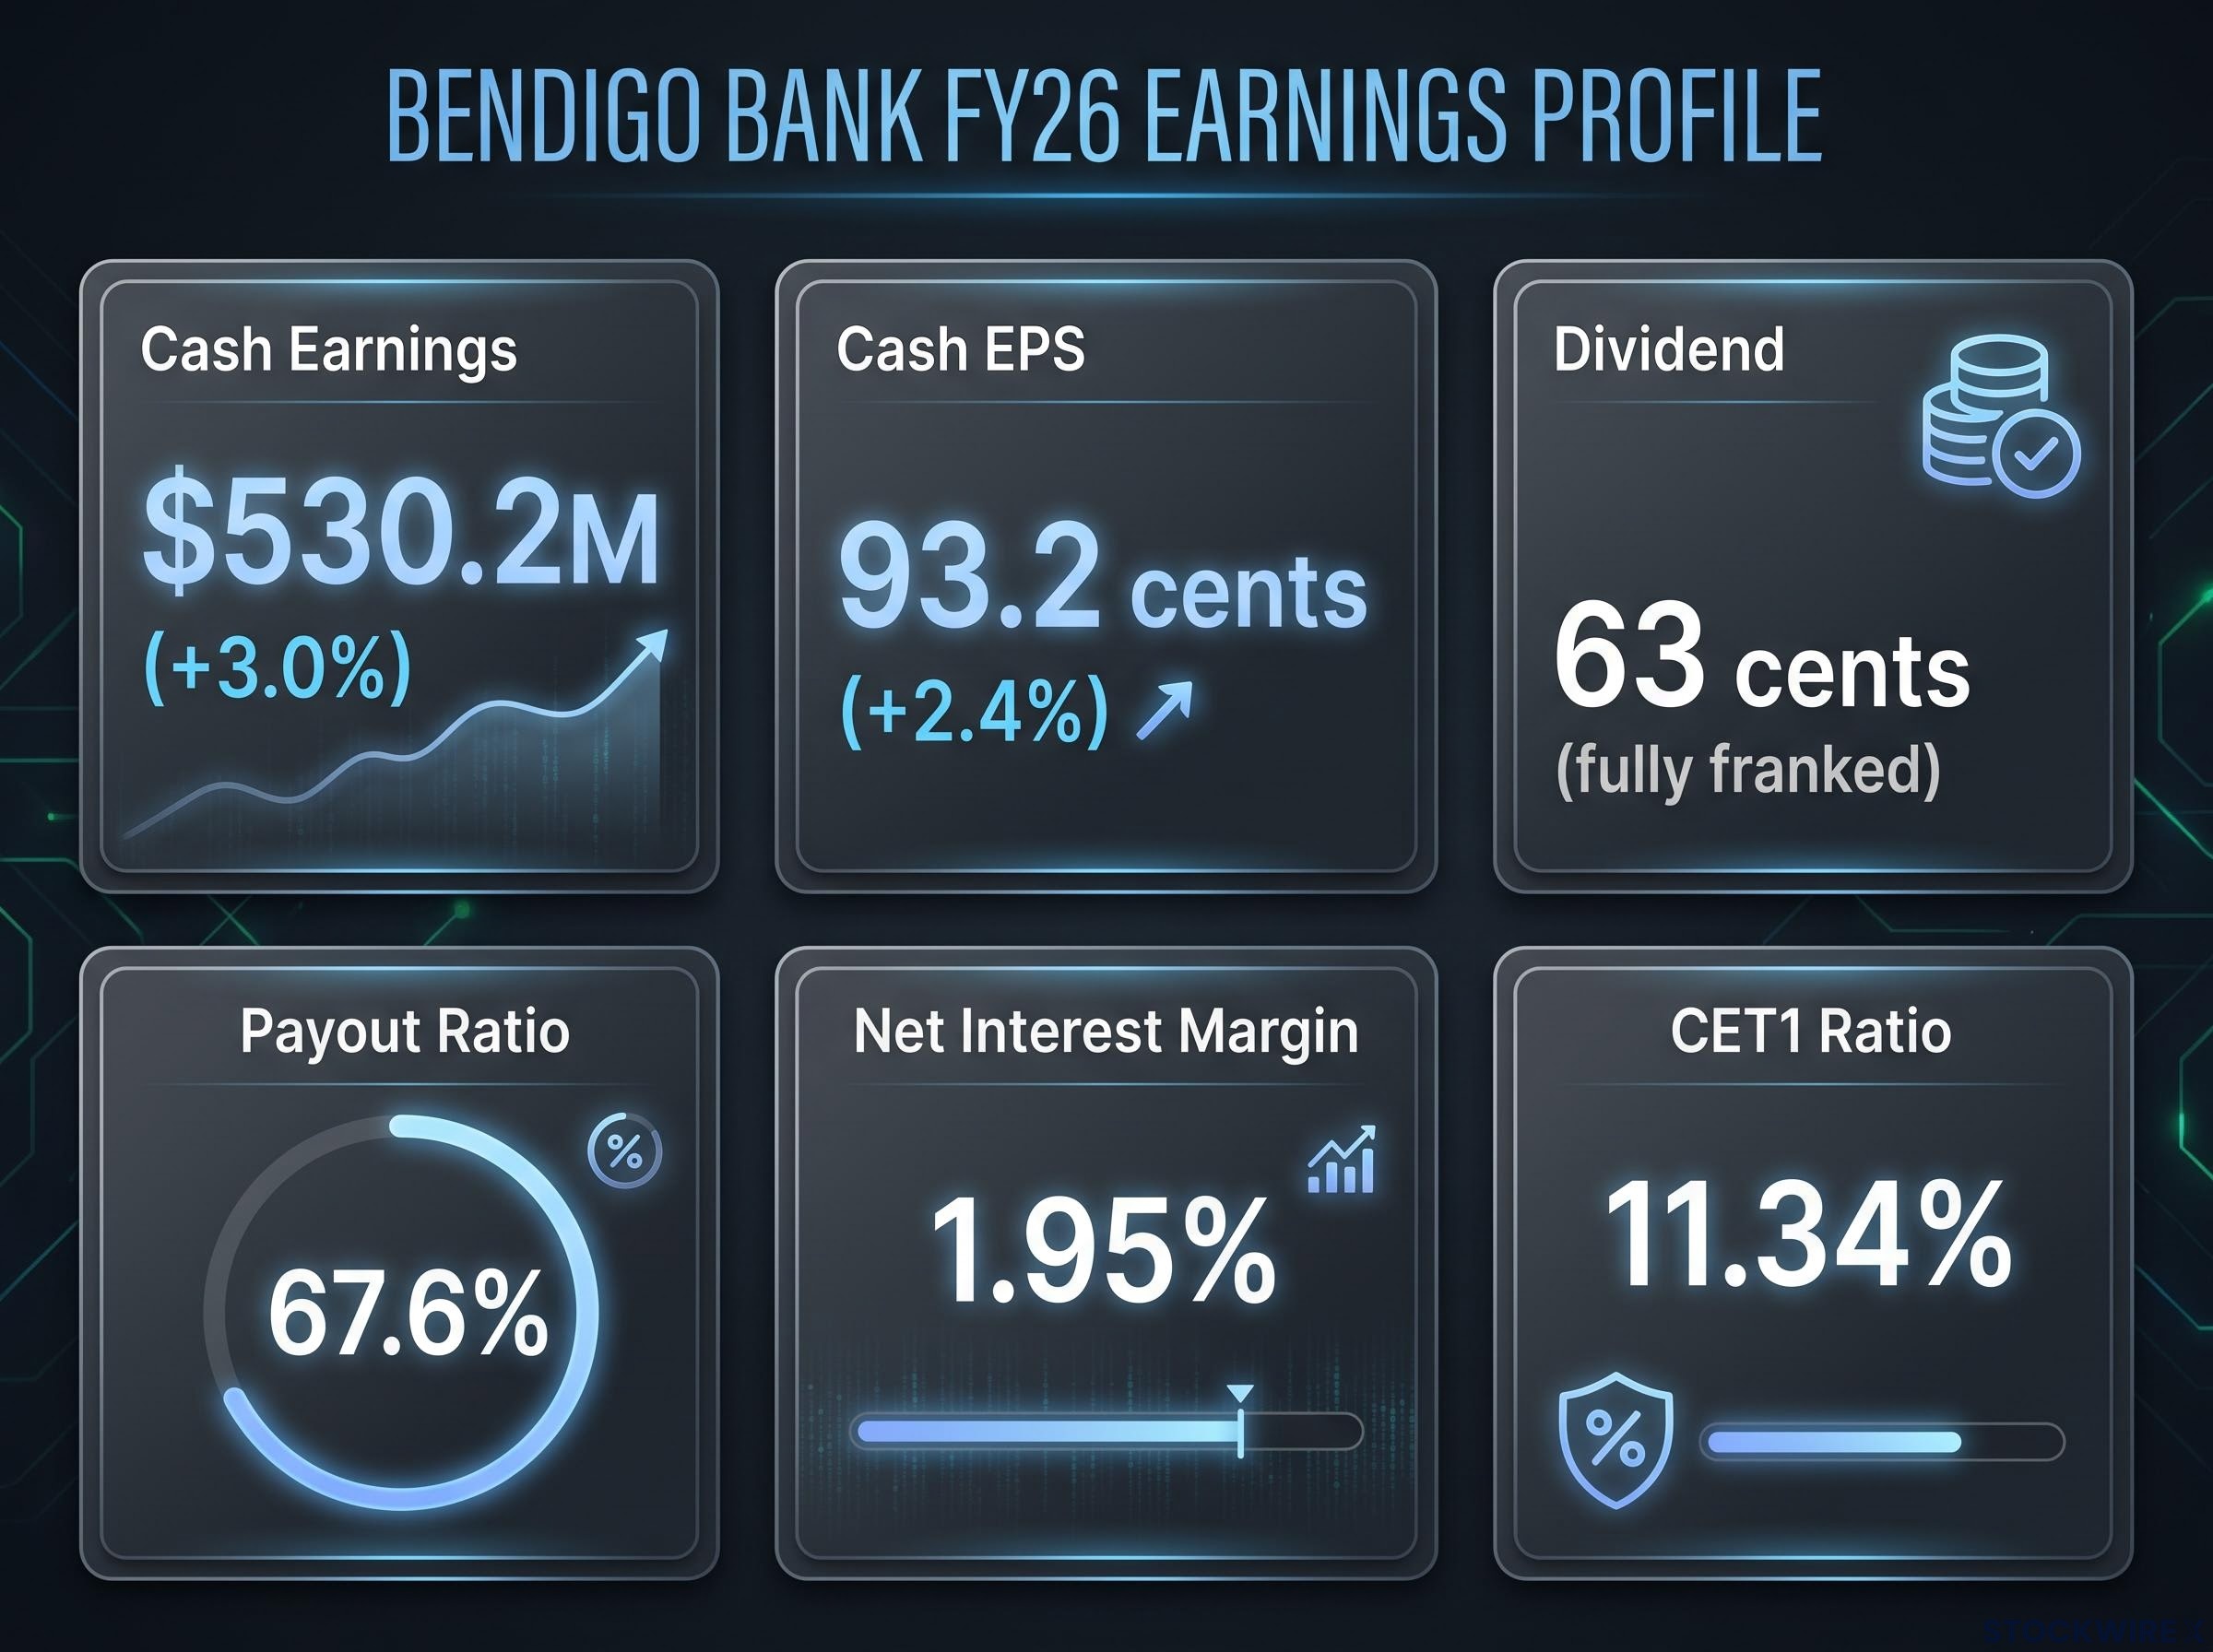
The margin gain came from a better deposit mix. Total deposits grew 2.2%, but lower-cost deposits rose 6.8% while higher-cost deposits fell 2.8%. Investordaily described the result as a more resilient margin profile and a sustainable earnings base.
A payout near two-thirds of cash EPS means the dividend has room to absorb some earnings pressure. Rising costs, however, mean you should not expect rapid dividend growth.
A PE ratio valuation of Bendigo against sector peers shows a persistent multiple discount, but that gap reflects lower returns on equity and regional loan concentration as much as any mispricing.
What could go wrong for Bendigo
Operating expenses rose 4.2%, driven by software amortisation, technology and risk investment, and Investing.com flagged that this spending tempers the near-term outlook. Second-half costs did fall 2.1% on the first half, which offers some encouragement.
The bigger question is execution. BEN booked an initial provision of about $70 million for a multi-year non-financial risk rectification programme, and APRA licence conditions apply. Credit exposure to housing and small business also leaves the bank sensitive to any property or regional slowdown.
The case for BOQ, and what to watch before backing it
BOQ deserves a fair hearing. It owns Virgin Money Australia and ME Bank, lends to specialist professionals such as doctors and accountants, and has completed its multi-year digital migration, including moving ME Bank customers across.
It has also been returning capital. A 15-cent fully franked special dividend went ex on 13 August 2026 and was paid on 24 August 2026, alongside an on-market buy-back of up to $196 million, for a total return of about $295 million. That followed the sale of its equipment finance book and is a one-off capital management step, not a change to ordinary dividend policy.
Two yields, one dividend Including the special, BOQ’s 12-month yield is about 8.5%. On ordinary dividends alone, it is about 6.2-6.3%. The second figure is the one to plan around.
Capital looks adequate. CET1 was 11.79% at 31 May 2026, with a pro-forma 11.01% after the return, above the 10.25-10.75% target range.
Then comes the unresolved part. In the half to 28 February 2026, statutory NPAT fell 20% to $136 million, cash earnings slipped 4% to $176 million, NIM sat at 1.67%, and the interim dividend was 20 cents.
If you hold or are considering BOQ, you are effectively betting on the turnaround and niche strategy. The October result will tell you whether the 40-cent ordinary dividend is well covered. Check:
Thinner CET1 buffers and culture scores below the sector average can signal execution strain, which matters when a turnaround story is the main reason to hold a lender.
- Full-year cash EPS and the resulting payout ratio
- Whether NIM has moved up from 1.67%
- The size of the final ordinary dividend
- The scale of notable items, and how much they explain the P/E gap
Choosing between the two without relying on yield alone
With yields almost identical, earnings quality and sustainability decide this comparison. On current data, BEN offers more earnings and dividend per share at a far lower multiple, with a payout comfortably inside cash earnings. BOQ suits investors confident in its turnaround and specialist lending strategy.
Holding both banks directly is only one income investing structure; listed investment companies can smooth payouts and ETFs pass income through, which changes how a dividend wobble reaches you.
The counterpoint is fair. BOQ’s yield and year-to-date return are marginally higher, and the BEN case rests mainly on P/E and earnings quality rather than a dramatic performance gap.
Your next step is simple: review BOQ’s results when they land around 14-15 October, then compare cash payout ratios side by side before deciding.
Past performance does not guarantee future results. Financial projections are subject to market conditions and various risk factors.
This article is for informational purposes only and should not be considered financial advice. Investors should conduct their own research and consult with financial professionals before making investment decisions.